ARE THE REAL GDP SERIES IN ASIAN COUNTRIES NONSTATIONARY OR NONLINEAR STATIONARY?
Nurun Nahar Jannati, Researcher Nayeem Sultana, Associate Professor Md. Israt Rayhan, Associate Professor University of Dhaka, Dhaka-1000, Bangladesh
E-mail: [email protected], [email protected], [email protected] Phone: +880-1924752885
ABSTRACT
This paper checks whether per capita real gross domestic product (GDP) series in 16 Asian countries are nonstationary or nonlinear and globally stationary during the period from 1970 to 2009, by applying the nonlinear unit root tests developed by Kapitanios, Shin and Snell (2003). In five out of the sixteen countries that is approximately one-third of the countries, the series are found to be stationary with asymmetric or nonlinear mean reversion. Analyses depict that nonlinear unit root test are suitable for some cases compare to the commonly used unit root test, Augmented Dickey-Fuller (ADF) and Dickey-Fuller Generalized Least Square (DF-GLS) tests.
KEY WORDS
Autoregressive model; Nonlinearity; Unit root test.
The moments of the statistical distribution of a stationary time series remain same no matter at what point they are measured, that is, those are time invariant. Such a series will tend to its mean (called mean reversion) and fluctuations around this mean will have a broadly constant amplitude . A nonstationary time series will not revert to its mean path if the series receives any shocks or experiences policy interventions that are following a negative shock automatic return to a normal trend may not occur. Using such series in regression modeling would yield spurious statistical test results. Furthermore, for the purpose of forecasting, such time series may be of little practical value. Therefore, it is must to check stationarity of a time series before analyzing the series. Per capita real gross domestic product (PRGDP) is an important macroeconomic variable for analyzing the impact of economic policies. Therefore, it is essential to determine statistically whether the PRGDP series of an economy of interest has a unit root or nonstationary.
However, studies dealing with this phenomenon for Asian countries are found hardly. The recent study, using the Carrion-i-Silvestre et al.(2005) panel stationarity unit root test allowing for multiple breaks conducted by Narayan (2008), found overwhelming evidence of panel stationarity of per capita real GDP for different panels of Asian countries. But unit root studies based on panel data, despite enhancing the power of unit root tests have some shortcomings. It has been demonstrated that in most of the widely used panel unit root tests such as the Levin-Lin-Chu (LLC) and Im-Pesaran-Shin(IPS) tests, there is a possibility that the panel outcome, where the data generating series of a panel as a whole is stationary is driven often by a small number of stationary panel members [Breuer et al. (2002), Chortareas and Kapetanios (2004)]. Thus, the existence of a few stationary series in the panel might warrant the rejection of the null hypothesis of the presence of a unit root for the whole panel [Breuer et al. (2002)].
The present paper attempts to study the time series properties of individual Asian counties, as to increase the rate of economic growth by undertaking new economic policies, information based on individual country unit root tests is warranted. In this paper, the focus is on the individual country time series mainly for the availability of the data for 16 Asian countries, for a relatively long span, 1970-2009 (WDI, 2010 ) and for the presence of some major theoretical pitfalls of commonly used panel unit root tests leading to misleading inferences, especially when the panel members included in the sample exhibits pronounced variations in economic, political and structural characteristics or heterogeneities [Breuer et al.(2002)].Therefore, we aim to perform univariate unit root test by employing the recent non- linear univariate unit root test developed by Kapetanios et al.(2003), to determine empirically whether real GDP per capita series in levels are nonstationary or nonlinear stationary processes.
DATA AND METHODOLOGY
This study covers a total of 16 Asian countries GDP series. The countries are chosen on the basis of the availability of required data. The data are collected for the period of 1970 to 2009. The data are obtained from World Development Indicators (WDI, 2010). All observations are annual. The data used for estimation and analysis on per capita real GDP for the countries constant in 2000 US dollars. For estimation, the data are expressed in logarithms.
The application of traditional unit root tests as the ADF and Phillips-Perron tests are less powerful and more size distorted when the data exhibit nonlinearity. Nonlinearity arise may be due to high transition costs, high regulatory costs, transportation costs, corruption and frequent policy interventions. Kapetanios Shin and Snell (2003) extended the Augmented Dickey–Fuller (ADF) test to tackle the problem of traditional tests in case of nonlinearity in the Exponential Smooth Transition Autoregressive (ESTAR) framework which is known as KSS or nonlinear ADF (NLADF) test. They state the null hypothesis of the presence of a unit root and hence is nonstationary against the alternative of globally stationary ESTAR process. The ESTAR model can be written as:
t = β t-1 + β* t-1 [1 - exp (- θ 2t-d)] + Єt (1),
where Єt ~ iid (0, σ2). The null hypothesis of a unit root which in terms of the above model implies that β = 1 and θ = 0. Taking β = 1 in equation (1) and assuming d = 1, the ESTAR model can be written as:
Δ t = β* t-1 {1 - exp (- θ 2t-1)} + Єt (2),
order Taylor series approximation Kapetanios, et al. (2003) obtained the following auxiliary regression:
Δ t = 3t-1 + νt (3).
To handle the presence of serial correlation in the error terms, the above equation can be extended as follows:
Δ t =
∑
∅ ∆
+ 3t-1 + νt (4).Here is the coefficient of interest for testing the presence of a unit root. Kapetanios et al. (2003) perform the KSS unit root test as the following t-test:
NLADF =
. .( )
(5),where and s.e. are respectively, the estimated coefficient and the standard error of . The test statistic NLADF does not have an asymptotic standard normal distribution and therefore, Kapetanios, et al. (2003) provide the critical values on p. 364 of their article which is reproduced in table 1. If the computed absolute value of the test statistic exceeds the critical values, the hypothesis of = 0, will be rejected in which case the time series is stationary.
Table1 – Asymptotic critical values for the KSS test
Significance Level Case 1 Case 2 Case 3
1% -2.82 -3.48 -3.93
5% -2.22 -2.93 -3.40
10% -1.92 -2.66 -3.13
Note: Case 1, Case 2 and Case 3 refer to the underlying model with the raw data, demeaned data and de-trended data, respectively.
When the data have non-zero mean such that t = µ + t, the demeaned data t -
̅
, where̅
is the sample mean, is used to perform KSS test. When the data have non-zero mean and non-zero linear trend such that t = µ + δt + t, the demeaned and de-trended data are obtained by t -µ
- t, whereµ
and are the OLS estimators of µ and δ.pmax = int.
12.
(6),where int. stands for integer and T is the sample size. Although Liew et al. (2004) fixed the number of lags to 8, the optimum number of lags chosen on the basis of statistical criteria may be better than fixed arbitrarily. In MAIC procedure lag is selected by minimizing the MAIC.
ANALYSES AND RESULTS
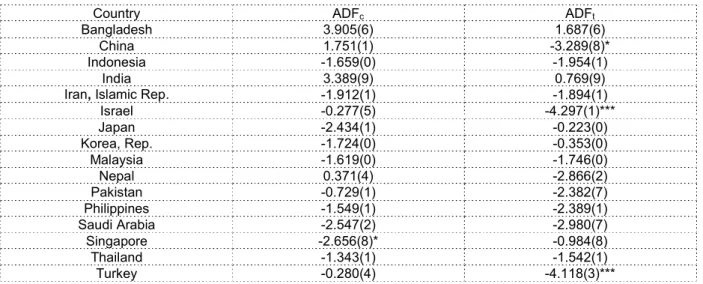
Tables 2 and 3 present the results from the most commonly used tests of the unit root in time-series, the ADF and DF-GLS unit root tests for the level series. Due to capture different possibilities in the data generating process, this study apply the tests for both, with constants and with constants and trend terms in the test equations. The tests are designed to test the null hypothesis of a unit root against the alternative that the series is stationary. These tests are not very efficient tests because sometimes exhibit less power and more size distortion. The size distortion could result from excluding moving average (MA) components from the model or if the model is not appropriate. However, the DF-GLS test has the advantage of allowing for higher power in the sense that the test is more likely to reject the null hypothesis of a unit root.
However, in table 2 the traditional ADF test results show that for only one country, Singapore, the null hypothesis of the presence of a unit root is rejected at the 10% level of significance when only a constant term was included in the model. When a constant and a linear trend were incorporated as the deterministic term, it is apparent that the null hypothesis of nonstationarity is rejected at10% level of significance for China and at 1% level of significance the null hypothesis is rejected for the two countries, Israel and Turkey.
Table 2 – Linear unit root test (ADF) results for level PRGDP series
Country ADFc ADFt
Bangladesh 3.905(6) 1.687(6)
China 1.751(1) -3.289(8)*
Indonesia -1.659(0) -1.954(1)
India 3.389(9) 0.769(9)
Iran, Islamic Rep. -1.912(1) -1.894(1)
Israel -0.277(5) -4.297(1)***
Japan -2.434(1) -0.223(0)
Korea, Rep. -1.724(0) -0.353(0)
Malaysia -1.619(0) -1.746(0)
Nepal 0.371(4) -2.866(2)
Pakistan -0.729(1) -2.382(7)
Philippines -1.549(1) -2.389(1)
Saudi Arabia -2.547(2) -2.980(7)
Singapore -2.656(8)* -0.984(8)
Thailand -1.343(1) -1.542(1)
Turkey -0.280(4) -4.118(3)***
Note: ADF test with constant and with constant and trend are denoted by ADFc and ADFt respectively.
*,**,*** indicate 10%, 5% and 1% significance level respectively.
The figures in parentheses are the optimal lags. Hall(1994), procedure is used to determine the lag length. We set
an upper bound pmax = 9 and estimate the test regression. If the last included lag is significant at the 10% level,
then we set p = 9 and perform the unit root test. However, if p is insignificant, it is reduced by one lag until the last
lag becomes significant. If no lags are significant then we set p equal to zero. We obtain pmax= 9 by using the rule
of thumb for determining pmax, suggested by Schwert (1989).
In table 3 the DF-GLS tests reject the null hypothesis only for one country, Saudi Arabia. Therefore, for a vast majority of the Asian countries included in this study, the overwhelming evidence of nonstationarity in levels is supported.
Table 3 – Linear unit root test (DF-GLS) results for level PRGDP series
Country DF-GLSc DF-GLSt
Bangladesh -0.794(8) -1.432(5)
China -0.664(9) -1.556(2)
Indonesia 1.240(1) -1.496(1)
India -0.408(7) -0.105(1)
Iran, Islamic Rep. -0.766(3) -1.208(3)
Israel 1.242(1) -1.778(3)
Japan -0.477(1) -0.267(1)
Korea, Rep. -0.309(5) -0.905(1)
Malaysia 0.367(3) -1.890(1)
Nepal -0.207(5) -0.731(2)
Pakistan -0.106(2) -2.280(1)
Philippines 0.341(2) -1.978(2)
Saudi Arabia -3.622(1)*** -3.270(1)*
Singapore 0.130(3) -0.608(4)
Thailand 0.063(1) -1.664(1)
Turkey 0.954(2) -2.787(1)
Note: *,**,*** indicate 10%, 5% and 1% significance level respectively. Optimal lag lengths are selected by MAIC procedure.
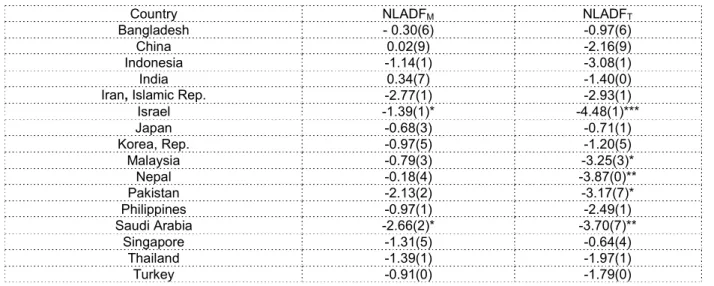
Table 4 reports the results of non-linear ADF (KSS or NLADF) tests. The KSS test results show that for two countries (Israel and Saudi Arabia) in the case of NLADFM (NLADF based on demeaned data) and for five countries (Israel, Malaysia, Nepal, Pakistan, Saudi Arabia) in the case of NLADFT (NLADF based on de-trended data), the null hypothesis of the presence of a unit root is rejected. That means for the two countries, Israel and Saudi Arabia, the per capita real GDP series are stationary and they exhibit asymmetric or nonlinear mean reversion. However, in almost all of these countries where the series on per capita real GDP exhibit upward trends, the unit root tests based on NLADFT are more relevant. The empirical findings from the KSS unit root test results using de-trended series, NLADFT, shows that the null hypothesis of nonstationarity is rejected only in 5 out of 16 countries indicating asymmetric mean reversion and nonlinear stationarity.
Table 4 – Nonlinear unit root test (KSS) results for level PRGDP series
Country NLADFM NLADFT
Bangladesh - 0.30(6) -0.97(6)
China 0.02(9) -2.16(9)
Indonesia -1.14(1) -3.08(1)
India 0.34(7) -1.40(0)
Iran, Islamic Rep. -2.77(1) -2.93(1)
Israel -1.39(1)* -4.48(1)***
Japan -0.68(3) -0.71(1)
Korea, Rep. -0.97(5) -1.20(5)
Malaysia -0.79(3) -3.25(3)*
Nepal -0.18(4) -3.87(0)**
Pakistan -2.13(2) -3.17(7)*
Philippines -0.97(1) -2.49(1)
Saudi Arabia -2.66(2)* -3.70(7)**
Singapore -1.31(5) -0.64(4)
Thailand -1.39(1) -1.97(1)
Turkey -0.91(0) -1.79(0)
Note: 1%, 5%, 10% critical values for NLADFM test are -3.48,-2.93, -2.66 and for NLADFT are -3.93, -3.40, -3.13.
CONCLUSION
There is now a large literature on testing for a unit root in time series and panel data. Standard univariate and multivariate unit root tests can be expected to have low power if the time series contain a nonlinear type of dynamics (e.g. structural breaks). The use of panel data benefits the analysis by enhancing the power of univariate unit root tests but there is the possibility of the time series properties of a minority of panel members influencing the statistical outcome that the panel as a whole is stationary. So if sufficient degrees of freedom are available we need to conduct the individual country unit root test. In this paper we apply the recently developed KSS nonlinear unit root tests to both the demeaned and de-trended per capita real GDP series of 16 Asian countries for the period 1970-2009.
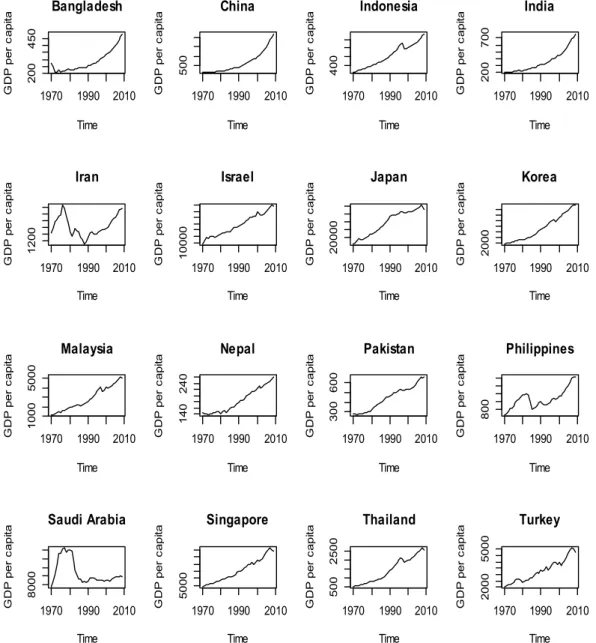
Figure 1 – Plot of real GDP per capita for Asian countries
The results from KSS tests shows that in about one-third of the Asian countries (Israel, Malaysia, Nepal, Pakistan, Saudi Arabia) included in the study sample, per capita real GDP series are found to be stationary with asymmetric non-linear mean reversion. It is apparent that the results were conflicting between the linear and nonlinear unit root tests, since the test developed by Kapetanios et al. (2003) is a stationarity test for nonlinear models, and is deemed to have better power than the standard ADF unit root test for nonlinear series.
1970 1990 2010
20 0 45 0 Bangladesh Time G DP pe r ca pi ta
1970 1990 2010
50 0 China Time G DP pe r ca pi ta
1970 1990 2010
40 0 Indonesia Time G DP pe r ca pi ta
1970 1990 2010
200 70 0 India Time G DP pe r ca pi ta
1970 1990 2010
120 0 Iran Time G DP p er c ap ita
1970 1990 2010
100 00 Israel Time G DP p er c ap ita
1970 1990 2010
200 00 Japan Time G DP p er c ap ita
1970 1990 2010
20 00 Korea Time G DP p er c ap ita
1970 1990 2010
10 00 50 00 Malaysia Time G D P p er c ap ita
1970 1990 2010
14 0 240 Nepal Time G D P p er c ap ita
1970 1990 2010
300 60 0 Pakistan Time G D P p er c ap ita
1970 1990 2010
80 0 Philippines Time G D P p er c ap ita
1970 1990 2010
80 00 Saudi Arabia Time G D P p er c api ta
1970 1990 2010
500 0 Singapore Time G D P p er c api ta
1970 1990 2010
50 0 25 00 Thailand Time G D P p er c api ta
1970 1990 2010
nonstationary. Shocks have permanent effects on the economy of these countries. If there is a unit root in real output, it suggests that following a negative shock automatic return to a normal trend may not occur.
REFERENCES
[1] Ben-David D, Papell D (1998) Slowdowns and meltdowns: postwar growth evidence from 74 countries.Rev Econ Stat 561–571.
[2] Ben-David D, Lumsdaine RL, Papell DH (2003) Unit roots, postwar slowdowns and long-run growth: evidence from two structural breaks. Empirical Econ 28:303–319. [3] Breuer, J.B., R. McNown, and M.S. Wallace (2002) “Misleading Inferences from Panel
Unit Root Tests with an Illustration from Purchasing Power Parity” Review of International Economics 9, 482-493.
[4] Carrion-i-Silvestre, J., L.T. Del Barrio, and L.E Bazo (2005) “Breaking the Panels: An Application to the GDP Per Capita”, The Econometrics Journal 8,159-175.
[5] Chortareas, G. and G. Kapetanios (2004) “Getting PPP Right: Identifying Mean Reverting Real Exchange Rates in Panels”.
[6] Cheung Y-W, Chinn D (1996) Deterministic, stochastic and segmented trends in aggregate output: a cross-country analysis. Oxford Econ Papers 48:134–162.
[7] Davies, R.B. (1977), “Hypothesis Testing When a Nuisance Parameter is Present Under the Alternative,” Biometrika, 64, 247-254.
[8] Duck NW (1992) UK evidence on breaking trend functions. Oxford Econ Papers 44:426-439.
[9] Fleissig AR, Strauss J (1999) Is OECD real per capita GDP trend or difference stationary? Evidence from panel unit root tests. J Macroecon.
[10] Hall AD (1994) Testing for a Unit Root in Time Series with Pretest Data-Based Model Selection, Journal of Business and Economic Statistics 12: 461-70.
[11] Kapetanios, G., Y. Shin, and A. Snell (2003) “Testing for a Unit Root in the Nonlinear STAR Framework” Journal of Econometrics 12, 359-379.
[12] Liew, V.K.S., Baharumshah, A.Z. and Chong T.T.L., “Are Asian Real Exchange Rates Stationary?” Economics Letters, 2004, Vol. 83, pp. 313-316.
[13] Nelson C, Plosser C (1982) Trends and random walks in macroeconomic time series. J Monetary Econ 10:139–162.
[14] Ng, S. and P. Perron (1995) “Unit Root Test in ARMA Models with Data Dependent Methods for the Selection of the Truncation Lag,” Journal of the American Statistical Association 90: 268-281.
[15] Nelson CR, Murray CJ (2000) The uncertain trend in US GDP. J Monetary Econ 10:139–162.
[16] Narayan, P.K (2008) “Is Asian Per Capita GDP Panel Stationary?” Empirical Economics 34, 439-449.
[17] Ng, S. and P. Perron (2001) “Lag Selection and the Construction of Unit Root Tests with Good Size and Power” Econometrica 75, 1519-1554.
[18] Perron P (1994) Trend unit root and structural change in macroeconomic time series. In: Rao BB(ed) Cointegration for Applied Economist. MacMillan, London.
[19] Perron P, Phillips PCB (1987) Does GNP have a unit root? Econ Lett 23:139–145. [20] Raj B (1992) International evidence in persistence in output in the presence of an
episodic change.J Appl Econ 7: 281–293.
[21] Rapach D (2002) Are real GDP levels nonstationary? evidence from panel data tests. Southern Econ J 68:473–495.
[22] Smyth R, Inder B (2004) Is Chinese provincial real GDP per capita non-stationary? Evidence from multiple trend break unit root tests. China Econ Rev 15:1–24.
[23] Stock JH, Watson MW (1986) Does GNP have a unit root? Econ Lett 22:147–151. [24] Vasudeva N. R. Murthy and Emmanuel Anoruo, (2009) ''Are Per Capita Real GDP