Association of Patient Care with
Ventilator-Associated Conditions in Critically Ill Patients:
Risk Factor Analysis
Susumu Nakahashi1☯*, Tomomi Yamada2‡, Toru Ogura3‡, Ken Nakajima4‡, Kei Suzuki1‡, Hiroshi Imai1☯
1Department of Emergency and Critical Care Center, Mie University Hospital, Tsu, Mie, Japan, 2Department of Clinical Epidemiology and Biostatistics, Graduate School of Medicine, Osaka University, Suita, Osaka, Japan,3Clinical Research Support Center, Mie University Hospital, Tsu, Mie, Japan, 4Department of Radiology, Mie University School of Medicine, Tsu, Mie, Japan
☯These authors contributed equally to this work.
‡These authors also contributed equally to this work.
Abstract
Background
Ventilator-associated conditions (VACs), for which new surveillance definitions and meth-ods were issued by the Center for Disease Control and Prevention (CDC), are respiratory complications occurring in conjunction with the use of invasive mechanical ventilation and are related to adverse outcomes in critically ill patients. However, to date, risk factors for VACs have not been adequately established, leading to a need for developing a better understanding of the risks. The objective of this study was to explore care-related risk fac-tors as a process indicator and provide valuable information pertaining to VAC preventive measures.
Methods
This retrospective, single-center, cohort study was conducted in the intensive-care unit (ICU) of a university hospital in Japan. Patient data were automatically sampled using a computerized medical records system and retrospectively analyzed. Management and care-related, but not host-related, factors were exhaustively analyzed using multivariate analysis for risks of VACs. VAC correlation to mortality was also investigated.
Results
Of the 3122 patients admitted in the ICU, 303 ventilated patients meeting CDC-specified eli-gibility criteria were included in the analysis. Thirty-seven VACs (12.2%) were found with a corresponding rate of 12.1 per 1000 ventilator days. Multivariate analysis revealed four vari-ables related to patient care as risk factors for VACs: absence of intensivist participation in management of ventilated patients [adjusted HR (AHR): 7.325,P<0.001)], using relatively higher driving pressure (AHR: 1.216,P<0.001), development of edema (AHR: 2.145,P=
OPEN ACCESS
Citation:Nakahashi S, Yamada T, Ogura T, Nakajima K, Suzuki K, Imai H (2016) Association of Patient Care with Ventilator-Associated Conditions in Critically Ill Patients: Risk Factor Analysis. PLoS ONE 11(4): e0153060. doi:10.1371/journal.pone.0153060
Editor:Philip Alexander Efron, University of Florida, UNITED STATES
Received:October 26, 2015
Accepted:March 23, 2016
Published:April 6, 2016
Copyright:© 2016 Nakahashi et al. This is an open access article distributed under the terms of the
Creative Commons Attribution License, which permits unrestricted use, distribution, and reproduction in any medium, provided the original author and source are credited.
Data Availability Statement:All relevant data are within the paper. There are no Supporting Information files.
Funding:The authors received no specific funding for this work.
0.037), and a larger body weight increase (AHR: 0.058,P= 0.005). Furthermore, this research confirmed mortality differences in patients with VACs and statistically derived risks compared with those without VACs (HR: 2.623,P= 0.008).
Conclusion
Four risk factors related to patient care were clearly identified to be the key factors for VAC preventive measures.
Introduction
Ventilator-associated conditions (VACs), for which new surveillance definitions and methods criteria were issued by the Center for Disease Control and Prevention (CDC) in 2013 [1,2], are
“respiratory complications that occur in conjunction with use of invasive mechanical
ventila-tion (MV)”and are associated with prolonged use of MV, prolonged intensive care unit (ICU)
stay, and increased mortality [3–7]. Therefore, prevention of VACs is an important issue in
managing critically ill patients. VAC surveillance, as part of VAC preventive measures, is con-ducted in western countries to investigate the prevalence, background, and prognosis of VACs. It is crucial to establish firm VAC preventive measures; however, to date, risk factors for VACs have not adequately been established.
For the original goal pertaining to surveillance, i.e., the achievement of medical quality improvement initiative, it is an important and pressing issue to identify risk factors for VACs. The most important characteristic of VAC diagnosis was that it included not only traditional ventilator-associated pneumonia (VAP) but also overall respiratory complications associated with the use of MV[3,8–10]. Thus, VAC surveillance is different from traditional VAP
surveil-lance [6,7,10,11], and it is necessary to better understand the risk factors for VACs. To pre-vent VACs, it is particularly necessary to analyze the risk factors related to patient-care processes and management.
The objective of this study was to explore risk factors for VACs, particularly with a focus on care-related factors as a process indicator. The significance of this study is that its findings could be a basic resource for quality improvement initiatives. Therefore, it could be a valuable source to base VAC preventive measures aiming at the improvement of systems for care, treat-ment, and management of critically ill ventilated patients.
Materials and Methods
This retrospective, observational, single-center study was conducted among patients who had received invasive MV between January 2012 and December 2013 in the ICU of the Mie Univer-sity Hospital, an academic, urban tertiary care center located in Tsu city that has an adult mul-tidisciplinary ICU (“semiclosed”unit) with 18 beds. The study was reviewed and approved by
June 17, 2002; available athttps://www.niph.go.jp/wadai/ekigakurinri/guidelines.pdf. Thus this study was allowed to apply the opt-out and waiving method by the Institutional Review Board of Mie University. Accordingly, for almost all patients, the informed consent was waived (i.e., we did not obtained it). Only when the patient was in hospital during the study period (for data analysis: April 2014–December 2014), written informed consent was obtained on the
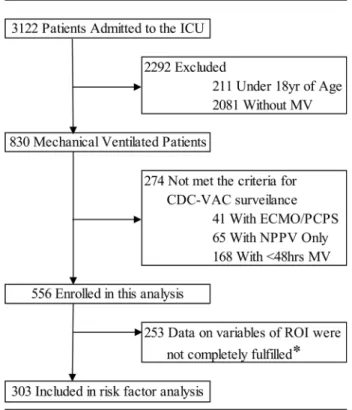
advice of the Institutional Review Board. Moreover, if patients and/or the next of kin check the message board for this study in the hospital or on the website, and wish to receive any addi-tional information, it can be made available. In such cases, we obtained verbal and written informed consent or a clarifying decision for declining testing. Selection criteria for this study were in accordance with the CDC VAC surveillance guidelines [1,2]. Inclusion criteria included: 1) over 18 years of age and 2) receiving MV for48 days. Exclusion criteria con-sisted of: 1) receiving percutaneous cardiopulmonary support (PCPS)/extracorporeal mem-brane oxygenation (ECMO) and 2) not receiving invasive MV but receiving non-invasive positive pressure ventilation (NPPV) (Fig 1). Patient data were automatically sampled using
Fig 1. Patient disposition chart.CDC, Centers for Disease Control and Prevention; ECMO, extracorporeal membrane oxygenation; ICU, intensive-care unit; MV, mechanical ventilation; PCPS, percutaneous cardiopulmonary support; NPPV, noninvasive positive pressure ventilation; VAC, ventilator-associated conditions
our computerized medical records system and then retrospectively analyzed. The data was automatically extracted from the electronic medical record system using“CLISTA”(Medical
Engineering Institute Inc., Mie, Japan), a data warehouse system for medical use. This system is customized to extract and utilize medical information from the hospital’s electronic health
records. In addition, the administrative databases and medical registries that record medical conditions using specific coding algorithms (billing coding), International Classification of Diseases, 10th revision (ICD-10) were also used in our study. Of the 3122 patients admitted to the ICU during the study period, 2292 were excluded because they met the exclusion criteria such as age<18 years and nonventilation (Fig 1). Furthermore, 274 patients were excluded
because of conditions such as PCPS/ECMO, noninvasive positive pressure ventilation (NPPV), or ventilation of<48 h that did not meet the inclusion criteria. The remaining 556 patients
were enrolled into this study (Fig 1). Finally, of the remaining 556, only patients with sufficient information of all clinical variables, discussed in detail in the next section, were included in the risk factor analysis.
Measurements and Definition
The following text outlined the criteria for meeting the VAC definitions according to the CDC guidelines [1,2]: if the patient has a baseline period of stability or improvement on the ventilator, defined by2 calendar days of stable or decreased daily minimum fraction of inspired oxygen (FiO2) or positive end-expiratory pressure (PEEP) values. The baseline period is defined as the
two calendar days immediately preceding the first day of increased daily minimum PEEP or FiO2. After a period of stability or improvement, as shown on the ventilator, the patient has at
least one of the following indicators of worsening oxygenation: 1) an increase in the daily mini-mum FiO2of0.2 over the daily minimum FiO2in the baseline period, sustained for2
calen-dar days; and 2) an increase in the daily minimum PEEP values of3 cmH2O over the daily
minimum PEEP in the baseline period†sustained for2 calendar days. Host-related, environ-mental, and management and care-related factors were analyzed to identify the risk factors for VACs. Comorbid disease status was measured using the International Classification of Diseases, version 10 (ICD-10), of the Charlson comorbidity index [12]. The level of activities of daily living (ADL) on admission was assessed using the Barthel index. The nurse/artificial life support devices (ALS) ratio was defined as the ratio of ALS to the number of daily staffing nurses. Hemo-diafiltration, intraaortic balloon pumping (IABP), and invasive MV were included as ALS. The level of sedation during the day was assessed using the Richmond Agitation Sedation Scale (RASS). Body weight (BW) change was defined as peak minus admission BW. The rate of oral care performance was calculated as follows: total number of oral care/3 (times) × total MV days; oral care three times daily is routine practice in our ICU. Moreover, this study attempted to con-firm whether VAC, with risks statistically derived from this analysis, was related to mortality as in previous studies [4–7,10,11]. The diagnosis that we explicitly considered were defined
accord-ing to the previous research of VAC [6] as follows: 1) pneumonia was identified by imaging, cul-tures, initiation of antibiotics, and clinical documentation; 2) atelectasis was identified by imaging, ultrasonography, blood gas analysis, tidal volume, auscultation, bronchoscopy, and explicit clinical documentation; 3) pleural effusion was identified by imaging, ultrasonography, auscultation, percussion, and chest tube placement; and 4) ARDS (by the Berlin definition [13]) was identified by imaging, timing, ultrasonography, and oxygenation.
Statistical Analysis
included in all models, was used. The adjustment of the APACHE II core was necessary because the severity of illness would lead to a bias. For identification of the variables set in the model, a stepwise variable selection method was applied after forcing APACHE II score in the model. All statistical tests were two-sided, and significance was defined asp<0.05.
Logarith-mic transformation was performed as needed to adjust normality. The period of observation was set from the initiation of MV to the onset of VAC or weaning off MV.
VAC includes traditional VAP. Risks of traditional VAP differ between early-VAP (onset of 4 days) and late-VAP (onset of>4 days). In this regard, the risk of VACs, including VAPs,
will also differ between the early-onset VAC and other types of VAC. Therefore, risk explora-tion was conducted not only by methods that do not involve the classificaexplora-tion of VACs but also by the classification of VACs according to incidence within 4 days (early incidence) and beyond 4 days (late incidence) using a polychotomous logistic regression analysis (stepwise variable selection method) with a forced entry of the APACHE score.
A cumulative survival curve was estimated using the Kaplan–Meier method and was
com-pared using the log-rank test. Hazard ratios and 95% confidence intervals (CIs) were estimated using the Cox proportional hazards analysis, with a VAC as a time-dependent covariate. The follow-up period extended from the initiation of MV to the in-hospital death or discharge. The overall survival from a defined time point was evaluated. SAS software v9.3 for Windows (SAS Institute, Cary, North Carolina) was used for statistical analysis.
Results
Baseline Characteristics of Study Patients
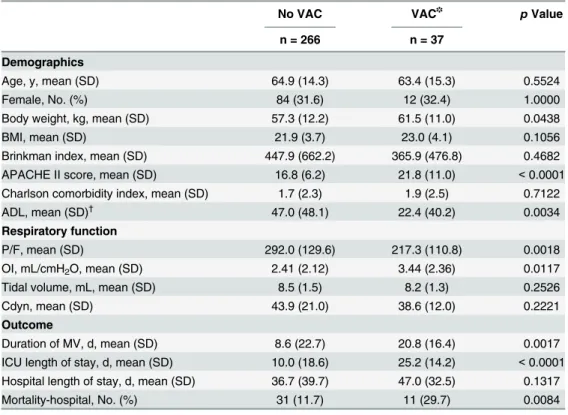
In total, 556 patients were screened initially, of which 253 patients were excluded; data for the remaining 303 patients, shown to have sufficient information on variables in the area of inter-est for this analysis, were calculated using statistical analysis (Fig 1). Baseline characteristics and outcomes in patients with and without VACs are shown inTable 1. No between-group dif-ferences in age, sex, BW, and comorbidities were found. Thirty-seven VACs were identified (12.2%), with a corresponding rate of 12.1 per 1000 MV days (Table 2). VAC onset occurred, on an average at 7.1 ± 6.3 MV days. A comparison of patients with and without VACs demon-strated a significantly higher baseline Acute Physiology and Chronic Health Evaluation (APACHE) II score in those with VACs. In contrast, the baseline ADL score in patients with VACs was lower than in those without VACs. Respiratory function in patients with VACs was associated with lower oxygenation. Compared with patients without VACs, patients with VACs had a longer MV duration and ICU stay. Furthermore, 29.7% (11/37) of patients with VACs died compared to 11.7% (31/266) of patients without VACs (Table 1).Table 2presents the etiology and distribution of the major pathological symptoms of VACs, including pneumo-nia, atelectasis, acute respiratory distress syndrome (ARDS), and pleural effusion. Forty percent of patients with VACs were complicated because of pleural fluid accumulation, regardless of the amount of fluid accumulated.
Risk Factors for VAC
Table 2. Episodes of ventilator-assocated conditions.
VAC✽
Number of episodes 37 (12.2)
Incidence rate (per 1,000 MV) 12.1
Etiology
Pneumonia 14 (37.8)
Atelectasis 8 (21.6)
Acute respiratory distress syndrome 5 (13.5)
Cardiogenic pulmonary edema 0 (0.0)
Pleuralfluid 15 (40.5)
Data are presented as n (%), except where noted otherwise. VAC, ventilator-associated conditions; MV, mechanical ventilation.
*Includes episodes that meet criteria for infected VAC (iVAC) and/or Possible or Probable Pneumonia: pVAP (both subtypes of VAC: iVAC is VAC with general evidence of infection and pVAP is iVAC with lab evidence of pneumonia).
doi:10.1371/journal.pone.0153060.t002
Table 1. Baseline demographics and outcome.
No VAC VAC✽ pValue
n = 266 n = 37
Demographics
Age, y, mean (SD) 64.9 (14.3) 63.4 (15.3) 0.5524
Female, No. (%) 84 (31.6) 12 (32.4) 1.0000
Body weight, kg, mean (SD) 57.3 (12.2) 61.5 (11.0) 0.0438
BMI, mean (SD) 21.9 (3.7) 23.0 (4.1) 0.1056
Brinkman index, mean (SD) 447.9 (662.2) 365.9 (476.8) 0.4682
APACHEⅡscore, mean (SD) 16.8 (6.2) 21.8 (11.0) <0.0001
Charlson comorbidity index, mean (SD) 1.7 (2.3) 1.9 (2.5) 0.7122 ADL, mean (SD)†
47.0 (48.1) 22.4 (40.2) 0.0034
Respiratory function
P/F, mean (SD) 292.0 (129.6) 217.3 (110.8) 0.0018
OI, mL/cmH2O, mean (SD) 2.41 (2.12) 3.44 (2.36) 0.0117
Tidal volume, mL, mean (SD) 8.5 (1.5) 8.2 (1.3) 0.2526
Cdyn, mean (SD) 43.9 (21.0) 38.6 (12.0) 0.2221
Outcome
Duration of MV, d, mean (SD) 8.6 (22.7) 20.8 (16.4) 0.0017
ICU length of stay, d, mean (SD) 10.0 (18.6) 25.2 (14.2) <0.0001 Hospital length of stay, d, mean (SD) 36.7 (39.7) 47.0 (32.5) 0.1317
Mortality-hospital, No. (%) 31 (11.7) 11 (29.7) 0.0084
Data are presented as n (%), except where noted otherwise. SD, standard deviation; MV, mechanical ventilation; APACHE, acute physiology and chronic health evaluation; ADL, activities of daily living; BMI, body Mass Index; ICU, intensive care units; P/F, the ratio of arterial oxygen concentration to the fraction of inspired oxygen; OI, oxygen index; Cdyn, dynamic compliance of respiratory system; VAC, ventilator-associated conditions.
*Includes episodes that meet criteria for infected VAC (iVAC) and/or Possible or Probable Pneumonia: pVAP (both subtypes of VAC: iVAC is VAC with general evidence of infection and pVAP is iVAC with lab evidence of pneumonia).
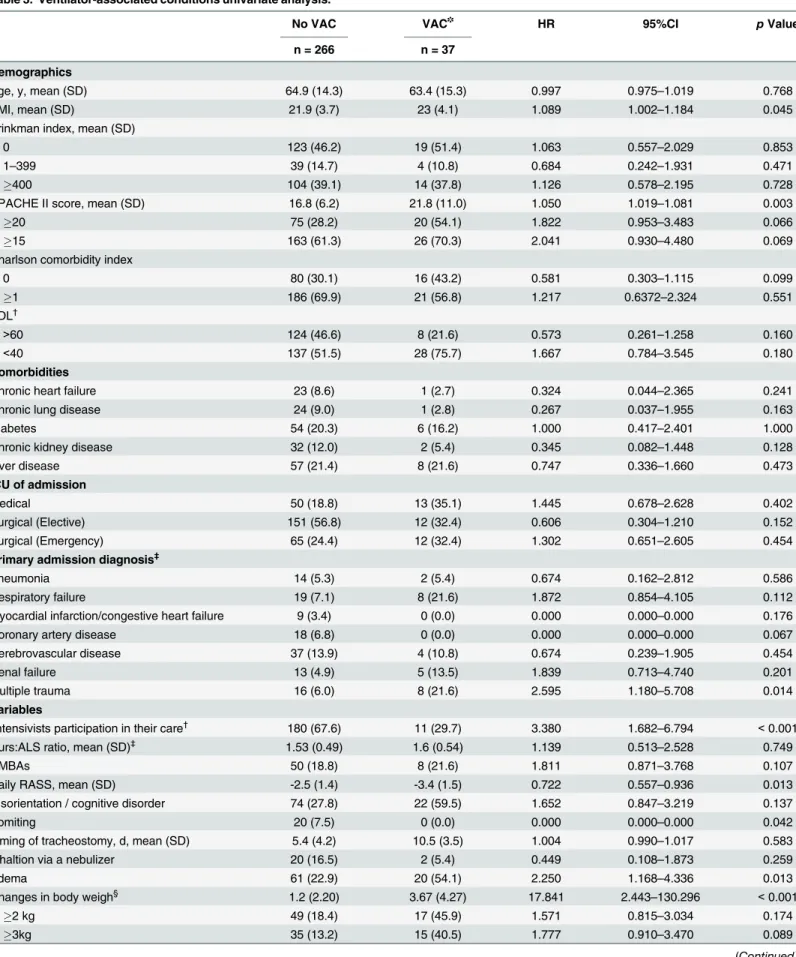
Table 3. Ventilator-associated conditions univariate analysis.
No VAC VAC✽ HR 95%CI pValue
n = 266 n = 37
Demographics
Age, y, mean (SD) 64.9 (14.3) 63.4 (15.3) 0.997 0.975–1.019 0.768
BMI, mean (SD) 21.9 (3.7) 23 (4.1) 1.089 1.002–1.184 0.045
Brinkman index, mean (SD)
0 123 (46.2) 19 (51.4) 1.063 0.557–2.029 0.853
1–399 39 (14.7) 4 (10.8) 0.684 0.242–1.931 0.471
400 104 (39.1) 14 (37.8) 1.126 0.578–2.195 0.728
APACHEⅡscore, mean (SD) 16.8 (6.2) 21.8 (11.0) 1.050 1.019–1.081 0.003
20 75 (28.2) 20 (54.1) 1.822 0.953–3.483 0.066
15 163 (61.3) 26 (70.3) 2.041 0.930–4.480 0.069
Charlson comorbidity index
0 80 (30.1) 16 (43.2) 0.581 0.303–1.115 0.099
1 186 (69.9) 21 (56.8) 1.217 0.6372–2.324 0.551
ADL†
>60 124 (46.6) 8 (21.6) 0.573 0.261–1.258 0.160
<40 137 (51.5) 28 (75.7) 1.667 0.784–3.545 0.180
Comorbidities
Chronic heart failure 23 (8.6) 1 (2.7) 0.324 0.044–2.365 0.241
Chronic lung disease 24 (9.0) 1 (2.8) 0.267 0.037–1.955 0.163
Diabetes 54 (20.3) 6 (16.2) 1.000 0.417–2.401 1.000
Chronic kidney disease 32 (12.0) 2 (5.4) 0.345 0.082–1.448 0.128
Liver disease 57 (21.4) 8 (21.6) 0.747 0.336–1.660 0.473
ICU of admission
Medical 50 (18.8) 13 (35.1) 1.445 0.678–2.628 0.402
Surgical (Elective) 151 (56.8) 12 (32.4) 0.606 0.304–1.210 0.152
Surgical (Emergency) 65 (24.4) 12 (32.4) 1.302 0.651–2.605 0.454
Primary admission diagnosis‡
Pneumonia 14 (5.3) 2 (5.4) 0.674 0.162–2.812 0.586
Respiratory failure 19 (7.1) 8 (21.6) 1.872 0.854–4.105 0.112
Myocardial infarction/congestive heart failure 9 (3.4) 0 (0.0) 0.000 0.000–0.000 0.176
Coronary artery disease 18 (6.8) 0 (0.0) 0.000 0.000–0.000 0.067
Cerebrovascular disease 37 (13.9) 4 (10.8) 0.674 0.239–1.905 0.454
Renal failure 13 (4.9) 5 (13.5) 1.839 0.713–4.740 0.201
Multiple trauma 16 (6.0) 8 (21.6) 2.595 1.180–5.708 0.014
Variables
Iintensivists participation in their care†
180 (67.6) 11 (29.7) 3.380 1.682–6.794 <0.001
Nurs:ALS ratio, mean (SD)‡ 1.53 (0.49) 1.6 (0.54) 1.139 0.513–2.528 0.749
NMBAs 50 (18.8) 8 (21.6) 1.811 0.871–3.768 0.107
Daily RASS, mean (SD) -2.5 (1.4) -3.4 (1.5) 0.722 0.557–0.936 0.013
Disorientation / cognitive disorder 74 (27.8) 22 (59.5) 1.652 0.847–3.219 0.137
Vomiting 20 (7.5) 0 (0.0) 0.000 0.000–0.000 0.042
Timing of tracheostomy, d, mean (SD) 5.4 (4.2) 10.5 (3.5) 1.004 0.990–1.017 0.583
Inhaltion via a nebulizer 20 (16.5) 2 (5.4) 0.449 0.108–1.873 0.259
Edema 61 (22.9) 20 (54.1) 2.250 1.168–4.336 0.013
Changes in body weigh§ 1.2 (2.20) 3.67 (4.27) 17.841 2.443–130.296 <0.001
2 kg 49 (18.4) 17 (45.9) 1.571 0.815–3.034 0.174
3kg 35 (13.2) 15 (40.5) 1.777 0.910–3.470 0.089
development of edema, (5) a larger BW increase, and (6) a higher driving pressure (ΔP). BW changes were as follows: 3.67 ± 4.27 kg (5.9%) in patients with VACs and 1.2 ± 2.20 kg (2.1%) in patients without VACs.ΔP was also greater in patients with VACs than in those without VACs (Table 3). Oral care and semirecumbent position, which are major components of the VAP prevention program (called the VAP bundle), were not presumed to be risk factors for VAC.
A Cox proportional hazards analysis with the exception of the APACHE II score, which was included in all models, showed the following results: At step 0, multiple trauma, intensivist par-ticipation, RASS, edema, BW change,ΔP, peak inspiratory pressure (PIP), and vomiting showed a significant association with the endpoint adjustment for the APACHE II score. The most significant factor for BW change was first entered into the Cox model [Akaike's Informa-tion Criterion (AIC): 327.76]. For step 1, multiple trauma, intensivist participaInforma-tion, RASS,ΔP, PIP, and BMI were significant after adjusting for the APACHE II score and BW change. Among them, intensivist participation showed the most significant and was entered into the Cox model (AIC: 316.42). In step 2, edema,ΔP, PIP, heart failure, and timing of tracheostomy show a significant association with the endpoint adjustment for the APACHE II score, BW change, and intensivist participation. Next, the most significant factor forΔP was entered into the Cox model (AIC: 301.37). In step 3, edema was significant after adjusting for the APACHE II score, BW change, intensivist participation, andΔP. Edema demonstrated the highest signifi-cance and was entered into the Cox model (AIC: 299.07). In the next step, none of the factors was significantly associated with the VAC after adjusting for the APACHE II score, BW change, intensivist participation,ΔP, and edema. Thus, the stepwise analysis was terminated at step 3.Table 4presents the results of the multivariate analysis using the Cox proportional haz-ard analysis. This table shows the estimates and P values when five final variables selected by the stepwise procedure (that is, statistically significant) were set to the model. Predominantly, care-related risk factors likely impacted the incidence of VACs. Risk varied with the participa-tion of intensivists. Furthermore, results from this Cox proporparticipa-tional hazard analysis indicated
Table 3. (Continued)
No VAC VAC✽ HR 95%CI pValue
n = 266 n = 37
Urine output
mL, mean (SD) 1776 (809.8) 1569 (929.9) 1.000 0.999–1.000 0.344
mL/kg/hr, mean (SD) 1.26 (0.82) 1.15 (1.00) 0.738 0.349–1.562 0.427
Driving pressure, cmH2O, mean (SD) 11.7 (2.8) 13.4 (3.6) 1.122 1.035–1.217 0.007
Oral care, mean (SD) 0.39 (0.99) 0.448 (0.38) 1.759 0.881–3.513 0.105
Semirecumbent position, hr, mean (SD) 3.59 (2.29) 3.46 (1.01) 1.057 0.842–1.326 0.633
Data are presented as n (%), except where noted otherwise. SD, standard deviation; CI, confidence interval; HR, hazard ratio; APACHE, acute physiology and chronic health evaluation; ADL, activities of daily living; BMI, body Mass Index; VAC, ventilator-associated conditions; ALS, artificial life support devices; NMBAs, neuromuscular blocking agents; RASS, Richmond agitation sedation scale.
*Includes episodes that meet criteria for infected VAC (iVAC) and/or Possible or Probable Pneumonia: pVAP (both subtypes of VAC: iVAC is VAC with general evidence of infection and pVAP is iVAC with lab evidence of pneumonia).†Activities of daily living (ADL) were assessed using the Barthel index.
‡Recorded as the diagnosis most representative of the reason for admission in the ICU.
†Patients experienced greater exposure to intensivists (attending physician specialists in critical care medicine). §The ratio of artificial life support devices to the number of daily staffing nurses.
#Body weight change was defined as peak minus admission body weight.
that a relatively higher meanΔP level, development of edema, and large BW increase were major risk factors for VACs (Table 4). Accordingly, on multivariate analyses in the polychoto-mous logistic regression analysis, a similar trend was indicated for the following risk factors: APACHE II score [odds ratio (OR): 1.068,p<0.001], participation of intensivists (OR: 0.079,
p<0.001),ΔP (OR: 1.198,p<0.001), edema (OR: 0.223,p= 0.001), and change in BW (OR:
0.071,p= 0.004) was associated with increased risk of VACs.
VAC and Associated Mortality
Fig 2depicts survival curves estimated using the Kaplan–Meier method. The survival rate
rap-idly declined in a linear manner (by ~50 days) in patients with VACs, whereas the rate in patients without VACs gradually declined. Between-group differences (particularly prominent after hyperacute phase) in the cumulative survival rate existed, and statistically significant dif-ferences were found using log-rank analysis (p= 0.036). Another test using Cox’s proportional
hazard analysis with a time-dependent covariate confirmed a statistically significant difference in mortality of patients with VACs compared with those without VACs (hazard ratio = 2.623; 95% CI = 1.294–5.317;p= 0.0075).
Discussion
With the intention to set a basic guideline for VAC preventive measures, a risk factor analysis was conducted. The following four risk factors were identified on multivariate analysis: (1)
Table 4. Risk of ventilator-associated conditions: VAC using Cox proportional hazard model (Stepwise Variable Selection) (n = 303).
Risk factor Adujusted (95% CI) PValue
HR
APACHEⅡscore 1.063 1.021–1.106 0.010
Insufficient participation of Intensivists in their care 7.325 3.264–16.440 <.0001
Higher driving pressure 1.216 1.109–1.333 <.0001
Changes in body weight increases 0.058 0.008–0.430 0.005
Development of edema 2.145 1.045–4.401 0.037
HR, hazard ratio; CI, confidence interval; VAC, ventilator-associated conditions; APACHE, acute physiology and chronic health evaluation.
doi:10.1371/journal.pone.0153060.t004
Fig 2. Kaplan–Meier analysis of cumulative survival.
patient non-exposure to intensivists; (2) relatively higher meanΔP level; (3) development of edema; and (4) a larger BW increase. Moreover, the presence or absence of VACs was related to mortality.
The etiologies of VAC in this study were pneumonia, atelectasis, ARDS, and pleural effu-sion. The four care-related risk factors for VAC identified in this study corresponded to well-known risk factors for each of these etiologies as members of VACs. Volume overload is associ-ated with ARDS [14,15], VAP [16], atelectasis [17], and pleural effusion. In this analysis, the development of edema and BW increase are extracted as a surrogate of volume overload, and this result is compatible with those reported in several previous reports [3,8,18]. In this study, the BW increase rate for patients with VACs was approximately 5%. According to Chittawata-narat et al., who analyzed the relationship between volume overload and respiratory complica-tions in the ICU, the cut-off value of the BW increase rate was 5% [19]; our results concur with their finding. ARDS is developed and/or aggravated by ventilator-induced lung injury (VILI) that accompanies inappropriate MV [20,21]. Therefore, extracting ofΔP, a risk factor for VILI, is reasonable. Lewis S et al. reported that the mode of the mandatory MV was a risk factor for VAC. The authors provided further discussion on increasing the risk for VAC because of the mandatory mode-induced VILI. Moreover, the mandatory mode generally has a largerΔP than the modes with spontaneous breathing. Thus, identification ofΔP in our study appears to be consistent with their results. Apart from the development of VILI and ARDS, the potential for spreading and extending the pneumonia was not eliminated because lagerΔP provides the dispersion and propagation of inflammatory infiltrates and secretion via airway network in the lung [22,23]. Participation of intensivists in the treating of ICU patients is useful for prevent-ing VAP [24]. In addition, as intensivists have great knowledge and skills for MV, i.e., they can applyΔP, PEEP, and associated adjacent therapies (fluid management, sedation management, etc.) most appropriately, we supposed their involvement was advantageous for preventing any other various ventilator-associated respiratory complications (i.e., VACs). Therefore, it seems that this shows why the presence or absence of or collaboration with intensivists when treating patients has a major effect on VAC. Our ICU is not a closed ICU; therefore, intensivist involve-ment varied from patient to patient. This result indicates that the positive involveinvolve-ment of intensivists in the management of MV patients can be recommended. Boyer et al., who investi-gated the preventability of VACs, surmised that VACs caused by volume overload, insufficient PEEP, VAP, or aspiration were preventable [8]. Moreover, Kompas et al. revealed that sponta-neous awakening trials (SATs) and spontasponta-neous breathing trials (SBTs), indicating these two could avoidΔP and volume overload, were associated with lower prevalence of VACs [25]. In this regard, we believe that prevention of risks identified in our analysis can actually reduce VACs to some extent. We recommend that these four core factors be targeted for the preven-tion of VACs.
The results of the Cox proportional hazard analysis that do not involve the classification of VACs were also consistent with that of the polychotomous logistic regression analysis that involves the classification of VACs according to the incidence of early- or late-VACs, which may indicate that there were no differences for core risk factors between early- and late-VACs. Although the causes of VAP differ between early- and late-VAPs, the risk of VACs, including VAP, did not differ between early-VACs and other types of VACs. This also supports that VACs is not equivalent to VAP and encompasses a variety of respiratory complications.
Nevertheless, it was comprehensively acceptable that the external and internal validities of these results were maintained; moreover, external validity should be carefully interpreted as described further.
but also various respiratory complications. Therefore, there is a potential for variation in the risks of VACs as statistically and preferentially identified, depending on the etiological compo-nents of clinical VACs. In this analysis, the major etiologies of VACs, except for pneumonia, were atelectasis (21.6%) and ARDS (13.5%). In a report by Hayashi et al., major conditions other than pneumonia were atelectasis (16.3%) and pulmonary edema (11.8%), and a care-related risk factor for VACs was fluid overload [3]. Boyer et al. reported ARDS (16.4%) and pulmonary edema (14.9%) as major conditions, and care-related risks for VACs were insuffi-cient PEEP, fluid overload, and aspiration [8]. According to a report by Muscendere et al, wherein pneumonia accounted for a relatively large proportion (28%) of VAC, VAP-related factors such as frequency of change of humidifiers, heat moisture exchangers, and suction sys-tems were risks factors for VACs [6]. As stated earlier, it seems safe to conclude that the four factors derived from this study are likely core factors for VAC risk. Moreover, a potential for minor variation remains in the statistically identified risks depending on the etiology of VACs. Moreover, it indicated that the VAC risk prevention initiative requires minor individual adjust-ments based on the details of the components implicated in VAC etiology. When addressing a quality improvement initiative for the prevention of VACs (called the VAC bundle), directly applying the traditional VAP bundle [26–30] may not be appropriate. Therefore, we believe
that risk analysis should be undertaken when a VAC is monitored for an appropriate period in each ICU.
In the results of our study, factors other than host-related factors were mainly identified as risk factors for VACs; however, in general, the severity of the underlying disease is also consid-ered to be contributory. In addition, Boyer et al., who researched the preventability of VACs, concluded that preventable VACs were only 37% of the overall VACs in their study [8]. With these taken into consideration, it is not known by how much the survival rate will be improved when the risks identified are eliminated, with a subsequent reduction in VACs achieved.
this study. Further investigation of the risk factors of infected VAC (iVAC) and possible or probable pneumonia VAC (pVAP), as subtypes of VAC provided by CDC guidelines (iVAC is VAC with general evidence of infection and pVAP is iVAC with lab evidence of pneumonia), was not performed due to the small number of patients; however, this should be considered as a future avenue of research.
Conclusion
In this study, care-related factors were identified as risk factors for VAC. The results of this analysis demonstrate that key components of the VAC prevention program are the involve-ment of intensivists in treatinvolve-ment, avoidance of volume overload, and manageinvolve-ment by lower
ΔP. It seems safe to conclude that these are likely core factors; however, it was suggested that minor adjustments should be made for preventive measures by each ICU because the etiology and components of VAC can vary, indicating that the care-related risk factors can vary a little by surveillance in each ICU. For the quality improvement initiative, it is crucial to verify how much the risk prevention program (VAC bundle), derived from VAC surveillance, contributes to the improvement of patient outcomes, and hence, further studies are needed.
Author Contributions
Conceived and designed the experiments: SN TY HI. Performed the experiments: SN TY TO KN KS HI. Analyzed the data: SN TY TO KN. Wrote the paper: SN TY HI.
References
1. (NHSN) CfDCaPNHSN. Surveillance for ventilator-associated events. [updated 2013 Apr 24]. Available from:http://www.cdc.gov/nhsn/acute-care-hospital/vae/.
2. Raoof S, Baumann MH. Ventilator-associated events: the new definition. Am J Crit Care. 2014; 23 (1):7–9. doi:10.4037/ajcc2014469PMID:24382609
3. Hayashi Y, Morisawa K, Klompas M, Jones M, Bandeshe H, Boots R, et al. Toward improved surveil-lance: the impact of ventilator-associated complications on length of stay and antibiotic use in patients in intensive care units. Clin Infect Dis. 2013; 56(4):471–7. doi:10.1093/cid/cis926PMID:23118272
4. Klompas M, Khan Y, Kleinman K, Evans RS, Lloyd JF, Stevenson K, et al. Multicenter evaluation of a novel surveillance paradigm for complications of mechanical ventilation. PLoS One. 2011; 6(3): e18062. doi:10.1371/journal.pone.0018062PMID:21445364
5. Klompas M, Kleinman K, Murphy MV. Descriptive epidemiology and attributable morbidity of ventilator-associated events. Infect Control Hosp Epidemiol. 2014; 35(5):502–10. doi:10.1086/675834PMID: 24709718
6. Muscedere J, Sinuff T, Heyland DK, Dodek PM, Keenan SP, Wood G, et al. The clinical impact and pre-ventability of ventilator-associated conditions in critically ill patients who are mechanically ventilated. Chest. 2013; 144(5):1453–60. doi:10.1378/chest.13-0853PMID:24030318
7. Stevens JP, Silva G, Gillis J, Novack V, Talmor D, Klompas M, et al. Automated surveillance for ventila-tor-associated events. Chest. 2014; 146(6):1612–8. doi:10.1378/chest.13-2255PMID:25451350
8. Boyer AF, Schoenberg N, Babcock H, McMullen KM, Micek ST, Kollef MH. A prospective evaluation of ventilator-associated conditions and infection-related ventilator-associated conditions. Chest. 2015; 147(1):68–81. doi:10.1378/chest.14-0544PMID:24854003
9. Klompas M. Does this patient have ventilator-associated pneumonia? JAMA. 2007; 297(14):1583–93. PMID:17426278
10. Lilly CM, Landry KE, Sood RN, Dunnington CH, Ellison RT 3rd, Bagley PH, et al. Prevalence and test characteristics of national health safety network ventilator-associated events. Crit Care Med. 2014; 42 (9):2019–28. doi:10.1097/CCM.0000000000000396PMID:24810522
12. Sundararajan V, Henderson T, Perry C, Muggivan A, Quan H, Ghali WA. New ICD-10 version of the Charlson comorbidity index predicted in-hospital mortality. J Clin Epidemiol. 2004; 57(12):1288–94. PMID:15617955
13. Ranieri VM, Rubenfeld GD, Thompson BT, Ferguson ND, Caldwell E, Fan E, et al. Acute respiratory distress syndrome: the Berlin Definition. JAMA. 2012; 307(23):2526–33. doi:10.1001/jama.2012.5669 PMID:22797452
14. Sakr Y, Vincent JL, Reinhart K, Groeneveld J, Michalopoulos A, Sprung CL, et al. High tidal volume and positive fluid balance are associated with worse outcome in acute lung injury. Chest. 2005; 128 (5):3098–108. PMID:16304249
15. Wiedemann HP, Wheeler AP, Bernard GR, Thompson BT, Hayden D, deBoisblanc B, et al. Compari-son of two fluid-management strategies in acute lung injury. N Engl J Med. 2006; 354(24):2564–75. PMID:16714767
16. Mekontso Dessap A, Katsahian S, Roche-Campo F, Varet H, Kouatchet A, Tomicic V, et al. Ventilator-associated pneumonia during weaning from mechanical ventilation: role of fluid management. Chest. 2014; 146(1):58–65. doi:10.1378/chest.13-2564PMID:24652410
17. Gattinoni L, Caironi P, Cressoni M, Chiumello D, Ranieri VM, Quintel M, et al. Lung recruitment in patients with the acute respiratory distress syndrome. N Engl J Med. 2006; 354(17):1775–86. PMID: 16641394
18. Lewis SC, Li L, Murphy MV, Klompas M. Risk factors for ventilator-associated events: a case-control multivariable analysis. Crit Care Med. 2014; 42(8):1839–48. doi:10.1097/CCM.0000000000000338 PMID:24751498
19. Chittawatanarat K, Pichaiya T, Chandacham K, Jirapongchareonlap T, Chotirosniramit N. Fluid accu-mulation threshold measured by acute body weight change after admission in general surgical inten-sive care units: how much should be concerning? Ther Clin Risk Manag. 2015; 11:1097–106. doi:10. 2147/TCRM.S86409PMID:26251605
20. Amato MB, Meade MO, Slutsky AS, Brochard L, Costa EL, Schoenfeld DA, et al. Driving pressure and survival in the acute respiratory distress syndrome. N Engl J Med. 2015; 372(8):747–55. doi:10.1056/ NEJMsa1410639PMID:25693014
21. Slutsky AS, Ranieri VM. Ventilator-induced lung injury. N Engl J Med. 2013; 369(22):2126–36. doi:10. 1056/NEJMra1208707PMID:24283226
22. Graf J, Marini JJ. Do airway secretions play an underappreciated role in acute respiratory distress syn-drome? Curr Opin Crit Care. 2008; 14(1):44–9. doi:10.1097/MCC.0b013e3282f2f4cbPMID:18195625
23. Marini JJ, Gattinoni L. Propagation prevention: a complementary mechanism for "lung protective" venti-lation in acute respiratory distress syndrome. Crit Care Med. 2008; 36(12):3252–8. doi:10.1097/CCM. 0b013e31818f0e68PMID:18936705
24. Shime N, Morrow LE. Current practices for ventilator-associated pneumonia prevention in Japan: a sur-vey study. Chest. 2012; 141(1):281–3. doi:10.1378/chest.11-2387PMID:22215846
25. Klompas M, Anderson D, Trick W, Babcock H, Kerlin MP, Li L, et al. The preventability of ventilator-associated events. The CDC Prevention Epicenters Wake Up and Breathe Collaborative. Am J Respir Crit Care Med. 2015; 191(3):292–301. doi:10.1164/rccm.201407-1394OCPMID:25369558
26. Abbott CA, Dremsa T, Stewart DW, Mark DD, Swift CC. Adoption of a ventilator-associated pneumonia clinical practice guideline. Worldviews Evid Based Nurs. 2006; 3(4):139–52. PMID:17177928
27. Al-Tawfiq JA, Abed MS. Decreasing ventilator-associated pneumonia in adult intensive care units using the Institute for Healthcare Improvement bundle. Am J Infect Control. 2010; 38(7):552–6. doi:10. 1016/j.ajic.2010.01.008PMID:20400203
28. Caserta RA, Marra AR, Durao MS, Silva CV, Pavao dos Santos OF, Neves HS, et al. A program for sus-tained improvement in preventing ventilator associated pneumonia in an intensive care setting. BMC Infect Dis. 2012; 12:234. doi:10.1186/1471-2334-12-234PMID:23020101
29. Hawe CS, Ellis KS, Cairns CJ, Longmate A. Reduction of ventilator-associated pneumonia: active ver-sus passive guideline implementation. Intensive Care Med. 2009; 35(7):1180–6. doi: 10.1007/s00134-009-1461-0PMID:19308354