online | memorias.ioc.fiocruz.br
The distribution pattern of Lutzomyia longipalpis
(Diptera: Psychodidae) in the peridomiciles of a sector
with canine and human visceral leishmaniasis transmission
in the municipality of Dracena, São Paulo, Brazil
Osias Rangel/+, Susy Mary Perpetuo Sampaio,
Ricardo Mario de Carvalho Ciaravolo, Marcia Moreira Holcman
Superintendência de Controle de Endemias, Secretaria de Estado da Saúde de São Paulo, Rua São Carlos 546, 13035-420 Campinas, SP, Brasil
The specimen distribution pattern of a species can be used to characterise a population of interest and also provides area-specific guidance for pest management and control. In the municipality of Dracena, in the state of São Paulo, we analysed 5,889 Lutzomyia longipalpis specimens collected from the peridomiciles of 14 houses in a sector where American visceral leishmaniasis (AVL) is transmitted to humans and dogs. The goal was to analyse the dispersion and a theoretical fitting of the species occurrence probability. From January-December 2005, samples were collected once per week using CDC light traps that operated for 12-h periods. Each collection was considered a sub-sample and was evaluated monthly. The standardised Morisita index was used as a measure of dispersion. Adherence tests were performed for the log-series distribution. The number of traps was used to adjust the octave plots. The quantity of Lu. longipalpis in the sector was highly aggregated for each month of the year, adhering to a log-series distribution for 11 of the 12 months analysed. A sex-stratified analysis demonstrated a pattern of ag-gregated dispersion adjusted for each month of the year. The classes and frequencies of the traps in octaves can be employed as indicators for entomological surveillance and AVL control.
Key words: American visceral leishmaniasis - log-series distribution - dispersion index - Lutzomyia longipalpis
American visceral leishmaniasis (AVL) is a serious public health problem in Brazil. In the state of São Paulo (SP), the first case was reported in 1999. Since September 2009, there have been 3,720 suspected cases of the disease, of which 1,612 cases were confirmed (SESSP 2010).
In Dracena (SP), Lutzomyia longipalpis was first de-tected in 2003 and canine and human cases have been detected since 2005 (D’Andrea et al. 2009). Actions to control the vector and the reservoir have been directed toward transmission areas. These areas are determined by stratifying the city into sectors or groups of sectors according to the Control Programme of Aedes aegypti in SP (MS/SVS 2009).
In AVL transmission areas, light-baited traps (LTs) have been frequently used to detect and monitor the abun-dance of Lu. longipalpis in peridomicile and intradomi-cile areas. Major contributions to this field of research were made in Araçatuba (SP) by Camargo Neves (2004), in Belo Horizonte, state of Minas Gerais, by Rezende et al. (2006) and in Campo Grande (SP) by Silva et al. (2007). In previous research, several indexes have been used, with the absolute number and the arithmetic mean of the specimens being most frequently used, followed
Financial support: SUCEN
+ Corresponding author: osias@sucen.sp.gov.br Received 15 May 2011
Accepted 11 January 2012
by the distribution of frequencies in percentages and trap indexes. Researchers have demonstrated the importance of the peridomicile as a location with greater specimen abundance compared with intradomicile.
Dispersion indexes and models of theoretical prob-ability distribution contribute to our understanding of the spatial distribution of organisms and can be obtained from counting data. According to published research, an understanding of the habitat of a species is essential (McGill et al. 2007). Such information is necessary for developing the sampling methods used for making sur-veillance and vector control decisions (Almeida et al. 2006, Costa et al. 2006).
To accommodate the random standards of a species, an analysis of the dispersion index and the probabil-ity distribution should be conducted (Maruyama et al. 2002, Almeida et al. 2006, Costa et al. 2006), which has not been reported for Lu. longipalpis. The goals of this study are to analyse the dispersion pattern and associ-ate the probability distribution of Lu. longipalpis in the peridomiciles of a sector with human and canine AVL transmission in the municipality of Dracena to improve entomological surveillance and vector control.
MATERIALS AnD METHODS
Dracena has a land area of 488.04 km2 and is at an
alti-tude of 421 m on the northern Brazilian plateau in west-ern SP (Figure). In 2005, there was an estimated popula-tion of 38,206 urban inhabitants and 3,818 in the rural areas. The Koöppen climate classification is Aw type, with cold dry winters and hot rainy summers (Tremo-coldi & Brunini 2008). Since 2005, human AVL cases have been reported in all of the city sectors.
Characteristics of the study site - The study location is one sector with 82 blocks and an average of 24.6 hous-es per block. Most of the buildings (86%) are rhous-esidential, with approximately 4,712 inhabitants. In 2005, a canine census survey was conducted and showed that 33.3% (284/852) of the dogs were AVL positive (SESSP 2005). The tests were performed according to the standard cri-teria set by the Ministry of Health, with a positive re-sult from an indirect fluorescent antibody test, using the Biomanguinhos/Oswaldo Cruz Foundation (Rio de Ja-neiro, Brazil) kit, as a confirmation criterion (D’Andrea et al. 2009). In July and August 2006, an environmental diagnosis was conducted by the Municipal Health Sec-retary; it was determined that animals were present in 33.5% of the households. The most frequently reported animals were cats (43.6%) and chickens (27.9%).
Methods and data analysis - We randomly selected 14 blocks and chose 14 residences, one per block, with environmental characteristics conducive to the occur-rence of Lu. longipalpis. These characteristics included the presence of vertebrate animals, trees and
peridom-iciles with a size equal or greater than 200 m2. These
characteristics were standardised to homogenise the peridomiciles surveyed.
From January-December 2005, weekly systematised collections were conducted. CDC-type LT-baited traps (Sudia & Chamberlain 1962) were installed in the peri-domiciles and were considered as the collection point, with a ratio of one trap per peridomicile. A 12-h col-lection period (06:00 pm-06:00 am) was used. The LTs were installed 1 m above the ground and in proximity to domestic animal shelters to standardise the capture loca-tion and to attain a localoca-tion favourable to the vector’s oc-currence (SESSP 2006). The number of specimens cap-tured in each collection was considered a sub-sample and was evaluated monthly. Male and female specimens were analysed separately using the same methodol-ogy. The standardised Morisita index (Ip) was used as a dispersion measurement. The index value indicated a standard pattern when Ip was less than or equal to -0.50, an aggregate pattern when Ip was greater than or equal to 0.50 and a random pattern when the Ip value was be-tween -0.50-0.50 (Krebs 1989). The data were adjusted for a log-series distribution (Fisher 1943) and considered the number of specimens acquired per trap in each col-lection. For the adjustment, it used the number of traps in octaves, which refers to the abundance of geometric intervals and is equivalent to the logarithmic scale base2 (Preston 1948). A calculation of the expected number of traps in this range was made according to the number of specimen occurrences (0-1, 1-2, 2-4, 4-8, 8-16,
31 and so on). Adherence tests were conducted to com-pare the observed to the expected values. A chi-square statistical test that included a class number of at least one degree of freedom at a 5% probability was used. The statistical analyses were performed using two soft-ware programmes Biodap (Thomas & Clay 2010) and R
(Oksanem et al. 2010).
RESuLTS
In total, 4,613 male and 1,276 female Lu. longipalpis
specimens were captured. Further, five female and three male Nissomyia neivai specimens were captured. No other sandfly species were captured. The analyses were performed using the Lu. longipalpis specimens.
TABLE I
Number of individuals collected per month and the collection point (cp), standardized Morisita Index (Ip) in 2005, Dracena, state of São Paulo
cp Jan Feb Mar Apr May Jun Jul Aug Sep Oct Nov Dec
1 2 3 2 0 4 9 4 1 1 1 5 1
2 1 32 39 123 73 63 3 1 1 5 25 32
3 0 36 11 17 2 35 6 22 3 58 11 0
4 28 30 21 20 7 10 2 2 3 19 4 2
5 9 10 23 176 72 21 39 40 19 39 87 44
6 8 17 6 86 5 7 4 2 1 2 4 4
7 2 3 7 0 5 3 2 0 0 3 3 0
8 43 49 22 77 11 42 10 4 2 16 13 1
9 11 12 24 30 3 22 1 4 0 2 0 0
10 7 19 31 34 18 62 13 32 9 8 3 0
11 17 65 9 36 13 11 2 2 1 8 3 11
12 37 212 33 81 55 83 43 19 13 21 26 51
13 1 2 3 0 3 5 0 2 0 1 1 3
14 72 147 247 605 302 450 333 318 95 135 47 97
Total 238 637 478 1,285 573 823 462 449 148 318 232 246
Ip 0.537 0.536 0.528 0.537 0.548 0.527 0.585 0.643 0.618 0.603 0.532 0.554
TABLE II
Number of individuals (male) collected per month and the collection point (cp), standardized Morisita index (Ip) in 2005, Dracena, state of São Paulo
cp Jan Feb Mar Apr May Jun Jul Aug Sep Oct Nov Dec
1 2 1 2 0 2 7 1 1 0 0 4 0
2 1 25 36 96 63 54 2 0 0 5 19 21
3 0 28 7 11 1 29 6 20 1 45 8 0
4 24 20 12 12 5 6 0 2 2 14 3 2
5 6 6 18 133 53 15 31 29 16 29 63 35
6 6 5 1 48 3 2 3 0 1 2 2 3
7 2 2 4 0 3 1 1 0 0 0 2 0
8 27 27 13 51 7 31 4 2 1 10 9 1
9 4 5 18 22 3 14 1 4 0 2 0 0
10 6 13 18 17 15 36 3 17 7 5 2 0
11 14 52 5 25 12 10 2 2 1 6 1 8
12 33 183 25 58 51 65 29 15 10 15 19 38
13 0 2 2 0 3 2 0 0 0 1 1 3
14 67 124 201 508 257 360 298 285 82 111 32 79
Total 192 493 362 981 478 632 379 375 121 245 165 190
TABLE III
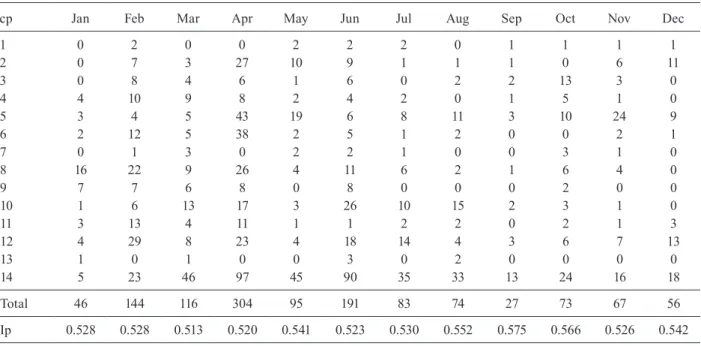
Number of individuals (female) collected per month and the collection point (cp), standardized Morisita index (Ip) in 2005, Dracena, state of São Paulo
cp Jan Feb Mar Apr May Jun Jul Aug Sep Oct Nov Dec
1 0 2 0 0 2 2 2 0 1 1 1 1
2 0 7 3 27 10 9 1 1 1 0 6 11
3 0 8 4 6 1 6 0 2 2 13 3 0
4 4 10 9 8 2 4 2 0 1 5 1 0
5 3 4 5 43 19 6 8 11 3 10 24 9
6 2 12 5 38 2 5 1 2 0 0 2 1
7 0 1 3 0 2 2 1 0 0 3 1 0
8 16 22 9 26 4 11 6 2 1 6 4 0
9 7 7 6 8 0 8 0 0 0 2 0 0
10 1 6 13 17 3 26 10 15 2 3 1 0
11 3 13 4 11 1 1 2 2 0 2 1 3
12 4 29 8 23 4 18 14 4 3 6 7 13
13 1 0 1 0 0 3 0 2 0 0 0 0
14 5 23 46 97 45 90 35 33 13 24 16 18
Total 46 144 116 304 95 191 83 74 27 73 67 56
Ip 0.528 0.528 0.513 0.520 0.541 0.523 0.530 0.552 0.575 0.566 0.526 0.542
TABLE IV
Adherence test of traps expected frequencies (exp) and observed (obs) in each octave on the log series model of abundance
Jan Feb Mar Apr May Jun
Octave exp obs exp obs exp obs exp obs exp obs exp obs
1 15.96 19 16.20 18 21.38 21 11.66 6 14.82 21 18.59 21
2 5.63 5 6.08 3 7.8 10 4.48 4 5.56 4 7.00 5
3 5.37 3 6.29 7 7.77 8 4.78 9 5.75 5 7.29 4
4 4.31 4 5.96 8 6.82 6 4.83 6 5.43 3 6.98 10
5 2.62 3 5.01 4 4.94 4 4.6 3 4.55 3 5.99 8
6 1.1 1 3.44 3 2.54 1 4.05 7 3.1 2 4.29 0
7 - - 2.01 2 0.75 2 3.09 3 1.44 2 2.84 5
8 - - - 1.8 1 0.35 1 -
-9 - - - 0.72 1 - - -
-X2 1.78 2.8 3.91 9.97 6.53 10.29
p 0.878 0.833 0.688 0.267 0.479 0.112
Jul Aug Sep Oct Nov Dec
Octave exp obs exp obs exp obs exp obs exp obs exp obs
1 10.55 14 9.73 15 8.85 10 12.83 18 18.68 21 7.02 10
2 3.97 6 3.67 1 3.16 4 4.71 5 6.46 7 2.62 0
3 4.13 3 3.83 1 3.05 3 4.74 1 5.99 5 2.70 1
4 3.95 2 3.68 5 2.52 0 4.23 5 4.55 2 2.52 1
5 3.39 1 3.18 4 1.62 2 3.17 1 2.49 3 2.07 5
6 2.42 1 2.31 1 0.67 0 1.74 1 0.83 1 2.04 2
7 1.23 2 1.21 0 0.13 1 0.54 0 - - -
-8 0.36 1 0.38 1 - - 0.06 1 - - -
-X2 7.58 10.53 9.74 22.5 2.06 10.02
TABLE V
Adherence test (male) of traps expected frequencies (exp) and observed (obs) in each octave on the log series model of abundance
Jan Feb Mar Apr May Jun
Octave exp obs exp obs exp obs exp obs exp obs exp obs
1 14.63 16 15.49 19 18.77 18 12.05 10 13.21 19 16.71 17
2 5.09 6 5.76 4 6.78 12 4.61 6 4.94 3 6.26 5
3 4.76 3 5.90 8 6.66 3 4.89 6 5.09 3 6.47 4
4 3.68 2 5.45 3 5.68 4 4.87 4 4.78 3 6.10 10
5 2.09 3 4.37 2 3.89 4 4.53 3 3.95 4 5.09 5
6 0.75 1 2.74 3 2.20 3 3.80 6 2.62 2 3.44 2
7 - - 1.28 2 - - 2.63 2 1.41 2 1.94 3
8 - - - 1.61 2 - - -
-X2 2.20 4.91 6.85 3.22 5.22 4.88
p 0.821 0.556 0.232 0.864 0.516 0.559
Jul Aug Sep Oct Nov Dec
Octave exp obs exp obs exp obs exp obs exp obs exp obs
1 7.93 13 7.96 11 8.24 11 12.26 19 17.62 19 6.57 8
2 3.00 3 3.00 0 2.90 1 4.44 2 5.85 4 2.43 1
3 3.13 2 3.14 5 2.76 3 4.38 3 5.13 5 2.47 1
4 3.01 1 3.02 3 2.21 2 4.76 3 3.50 4 2.26 2
5 2.62 1 2.62 3 1.33 0 2.61 0 1.56 1 1.77 4
6 1.93 0 1.92 0 0.55 1 1.24 1 0.34 1 1.48 1
7 1.37 3 1.02 0 - - 0.31 1 - - -
-8 - - 0.33 1 - - -
-X2 9.86 9.62 3.91 9.81 2.26 5.04
p 0.131 0.211 0.562 0.133 0.812 0.411
During March, June, September and November, five weekly collections were conducted instead of four, as in the other months, due to the occurrence of more collec-tion days in these months. In total, 728 samples were collected during 8,736 h of trap exposure time.
Table I shows the number of Lu. longipalpis speci-mens collected per month and per collection site and the values of the standardised Ip. In April, the largest num-ber of specimens was collected; the smallest numnum-ber was collected in September. The proportions of males and fe-males maintained in these months were equivalent (Ta-bles II, III). In total, we collected 5,889 Lu. longipalpis
specimens. The Ip values showed aggregated patterns for each month. In August, the index was the highest; in June, the lowest value was observed. Male specimens maintained a constant proportion (Table II), whereas for the female specimens, the largest Ip was observed in September and the lowest in March (Table III).
Table IV shows the adherence test results of the monthly frequencies of the expected and the observed traps arranged in octaves and modelled on a log-series distribution. October was the only month for which there was no adjustment to the distribution. The best fits were obtained for January, February, November and
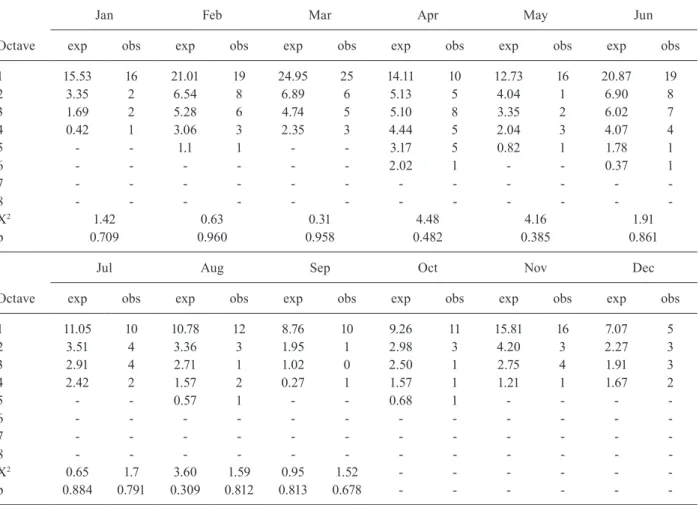
Decem-ber. Adjustments for male and female specimens were made for all collection months, with no predominance of any period of the year (Tables V, VI).
DISCuSSIOn
In this study, the distribution pattern of Lu. longi-palpis was analysed using peridomiciles as a scenario in which fundamental ecological characteristics, such as the birth, death and migration of specimens, occurred in an urbanised environment. This information describes the pattern of the organisms and was obtained by count-ing data, which makes it important to consider the limi-tations of the method used to obtain the specimens, be-yond those issues inherent in a peridomicile.
The proportion of males is higher than that of fe-males; this result is consistent with previously reported results obtained for LTs (Resende et al. 2006, Silva et al. 2007). The low number of other species may be due to the fact that the habitat studied was in an urban area, which is more favourable to Lu. longipalpis.
TABLE VI
Adherence test (female) of traps expected frequencies (exp) observed (obs) in each octave on the log series model of abundance
Jan Feb Mar Apr May Jun
Octave exp obs exp obs exp obs exp obs exp obs exp obs
1 15.53 16 21.01 19 24.95 25 14.11 10 12.73 16 20.87 19
2 3.35 2 6.54 8 6.89 6 5.13 5 4.04 1 6.90 8
3 1.69 2 5.28 6 4.74 5 5.10 8 3.35 2 6.02 7
4 0.42 1 3.06 3 2.35 3 4.44 5 2.04 3 4.07 4
5 - - 1.1 1 - - 3.17 5 0.82 1 1.78 1
6 - - - 2.02 1 - - 0.37 1
7 - - -
-8 - - -
-X2 1.42 0.63 0.31 4.48 4.16 1.91
p 0.709 0.960 0.958 0.482 0.385 0.861
Jul Aug Sep Oct Nov Dec
Octave exp obs exp obs exp obs exp obs exp obs exp obs
1 11.05 10 10.78 12 8.76 10 9.26 11 15.81 16 7.07 5
2 3.51 4 3.36 3 1.95 1 2.98 3 4.20 3 2.27 3
3 2.91 4 2.71 1 1.02 0 2.50 1 2.75 4 1.91 3
4 2.42 2 1.57 2 0.27 1 1.57 1 1.21 1 1.67 2
5 - - 0.57 1 - - 0.68 1 - - -
-6 - - -
-7 - - -
-8 - - -
-X2 0.65 1.7 3.60 1.59 0.95 1.52 - - - - -
-p 0.884 0.791 0.309 0.812 0.813 0.678 - - -
-the species could not be measured, only an approxima-tion could be made using LTs in this environment. In this study, 728 samples were systematically collected; this number is comparable to that of other studies conducted under similar conditions (Oliveira et al. 2006).
Dispersion indexes, although not mathematically de-scriptive of a distribution, provide a more clear idea of the spatial arrangement of a given species. A variety of index-es are used in abundance studiindex-es. The standardised Ip has been used because of its easy interpretation and lack of significant influence from the average population density or sample size (Myers 1978). To describe the spatial dis-tribution of an organism, it is essential to incorporate the data adjustment to the theoretical probability distribution. However, the use of indexes does not allow the knowledge of expected values for the sample classes.
The log-series distribution was created by Fisher (1943). This method was first used to analyse the rela-tionship between the number of species and the number of specimens. Gradually, this method was expanded to other studies (Williams 1947, Buzas & Culver 1999). The log-series is a special type of negative binomial distribution (NDB), where values for kapproach zero, allowing one to use a single parameter instead of two,
as in most NDBs. In this study, an adjustment was ob-tained for 11 months (91.67%). When male and female specimens were analysed separately, adjustments were obtained for each collection month, which appears ap-propriate for adjusting the data and can contribute to our knowledge of the vector’s population distribution. The data show that Lu. longipalpis has an aggregate pat-tern in time and space, with most samples containing few specimens. This information should contribute to the development of sampling plans and decision-making processes in vector control.
With the use of LTs in entomological programmes and vector control, it is critical to conduct research that can contribute to understanding the observable patterns obtained by using such traps in an urban environment, especially in peridomiciles, which are the sites in which disease control measures are usually performed. These findings may have an epidemiological significance that could contribute to understanding AVL transmission as it relates to surveillance measures and disease control.
ACKnOWLEDGEMEnTS
REfEREnCES
Almeida PS, Ferreira AD, Pereira VL, Fernandes MG, Fernandes WD 2006. Distribuição espacial de Aedes albopictus na região sul do estado de Mato Grosso do Sul. Rev Saude Publica 40: 1094-1100. Buzas MA, Culver SJ 1999. Understanding regional species diver-sity trough the log series distribution of occurrences. Divers Distrib5: 187-195.
Camargo-Neves VLF 2004. Aspectos epidemiológicos e avaliação das medidas de controle da leishmaniose visceral americana no estado de São Paulo, Brasil, Thesis, Faculdade de Saúde Pública da Universidade de São Paulo, São Paulo, 205 pp.
Costa MG, Barbosa JC, Yamamoto PT 2006. Distribuição de proba-bilidades de ocorrência de Orthesia praelonga Douglas (Hemi-ptera: Sternorrhyncha: Orthezidae) na cultura de citros. Neotrop Entomol35: 395-401.
D’Andrea Laz, Camargo-Neves VLF, Sampaio SMP, Kronka SN, Sartor IF 2009. American visceral leishmaniasis: disease control strategies in Dracena microregion in Alta Paulista, SP, Brasil.
J Venom Anim Toxins incl Trop Dis15: 305-324.
Fisher RA 1943. The relation between the number species and the number of individuals in a random sample of an animal popula-tion. Part 3. A theoretical distribution for the apparent abundance of different species. J Anim Ecol12: 54-58.
Galati EAB, Nunes VLB, Rego Jr FA, Oshiro MRC 1997. Estudo de flebotomíneos (Diptera: Psychodidae) em foco de leishmaniose visceral no estado de Mato Grosso do Sul, Brasil. Rev Saude Pu-blica31: 378-390.
Krebs CJ 1989. Ecological methodology, Harper & Row, New York, 654 pp.
Maruyama WI, Barbosa JC, Fernandes MG, Yamamoto PT 2002. Dis-tribuição espacial de Dilobopterus costalimai Young (Hemiptera: Cicadellidae) em citros na região de Taquaritinga, SP. Neotrop Entomol31: 35-40.
McGill BJ, Etienne RS, Gray JS, Alonso D, Anderson MJ, Benecha HK 2007. Species abundance distributions: moving beyond sin-gle prediction theories to integration within an ecological frame-work. Ecol Lett10: 995-1015.
MS/SVS - Ministério da Saúde/Secretaria de Vigilância em Saúde 2009. Guia de vigilância epidemiológica, MS/SVS, 7th ed., Brasília, 815 pp.
Myers JH 1978. Selecting a measure of dispersion of individuals. En-viron Entomol 7: 619-621.
Oksanem J, Blanchet FG, Kindt R, Legendre P, O’Hara RB, Simpson GL, Solymos LP, Stevens MHH, Wagner HH 2010. Vegan: com-munity ecology package. R package version 1.17-3. [Updated june 2010]. Available from: cran.r-project.org/package=vegan. Oliveira AG, Galati EAB, Oliveira O, Oliveira GR, Espindola IAC,
Dorval MEC, Brazil RP 2006. Abundance of Lutzomyia longi-palpis (Diptera: Psychodidae: Phlebotominae) and urban trans-mission of visceral leishmaniasis in Campo Grande, state of Mato Grosso do Sul, Brazil. Mem Inst Oswaldo Cruz 101: 869-874. Preston WF 1948. The commonness and rarity of species. Ecology
29: 254-283.
Rezende MC, Camargo MCV, Vieira JRM, Nobi RCA, Porto NMN, Oliveira CD 2006. Seasonal variation of Lutzomyia longipalpis
em Belo Horizonte, state of Minas Gerais. Rev Soc Bras Med Trop 39: 51-55.
SESSP - Secretaria de Estado da Saúde de São Paulo 2005. Relatórios de encerramento de inquéritos caninos do município de Dracena, Superintendência de Controle de Endemias, São Paulo, 10 pp. SESSP - Secretaria de Estado da Saúde de São Paulo 2006. Manual
de Vigilância e Controle da leishmaniose visceral americana no estado de São Paulo, SESSP, São Paulo, 158 pp.
SESSP - Secretaria de Estado da Saúde de São Paulo 2010. Clas-sificação epidemiológica dos municípios segundo o Programa de Vigilância e Controle da Leishmaniose Visceral Americana no Estado de São Paulo, atualizado em maio de 2010. Bol Epi-demiol Paul7: 21-40.
Silva EA, Andreotti R, Honer MR 2007. Comportamento de Lutzomy-ia longipalpis, vector principal de leishmaniose visceral America em Campo Grande, estado do Mato Grosso do Sul. Rev Soc Bras Med Trop 40: 420-425.
Sudia WD, Chamberlain RW 1962. Battery operated light trap, an im-proved model. Mosquito News 22: 126-129.
Thomas G, Clay D 2010. [Updatedoct 2010]. Biodap - Ecological di-versity and its measurement. Available from: nhsbig.inhs.uiuc. edu/populations/bio-dap.zip.
Tremocoldi WA, Brunini O 2008. Caracterização agroclimática da Secretaria de Agricultura e Abastecimento do Estado de São Pau-lo: Adamantina e região. Boletim Técnico do Instituto Agronômi-co de Campinas (Série Tec)204: 1-18.