Can
Lutjanus purpureus
(South red snapper) be “legally” considered
a red snapper (
Lutjanus campechanus
)?
Grazielle Gomes
1, Horacio Schneider
1, Marcelo Vallinoto
1, Simoni Santos
1, Guillermo Orti
2and Iracilda Sampaio
11
Laboratório de Genética e Biologia Molecular, Universidade Federal do Pará, Aldeia Bragança,
PA, Brazil.
2
Department of Biology, University of Nebraska, Lincoln, USA.
Abstract
Red snappers (Lutjanus purpureus in Brazil and Lutjanus campechanus in USA and Gulf of Mexico) are both under clear effect of overfishing. Because of their high morphological similarity it has already been suggested that they could possibly be considered as a single species. To investigate the degree of similarity and the genetic structure of red snapper populations we constructed a common dataset of partial D-loop mtDNA sequences ofL. purpureus from Brazil (Amapá, Pará and Maranhão) andL. campechanus from the Atlantic coast of the USA (Florida, Louisiana and Mississippi). Phylogenetic and population genetic analyses surprisingly depicted high similarity between L. campechanus and L. purpureus, compatible with the hypothesis of a single species of red snapper for the Western Atlantic Ocean. These preliminary but very curious findings open an important discussion regarding the legislation in-volved on the capture of this overexploited fish resources as well as regarding their taxonomy.
Key words:red snapper,Lutjanus purpureus,Lutjanus campechanus, population genetic structure, mitochondrial D-loop.
Received: October 23, 2006; Accepted: July 10, 2007.
Lutjanus campechanus (northern red snapper) and
Lutjanus purpureus(southern red snapper) are very impor-tant fish resources which are heavily fished along their dis-tribution areas in the Western Atlantic Ocean (Rivas, 1966; Cervigón, 1993).L. campechanuspopulations are spread on the East Coast of the USA, from North Carolina to Florida including the entire Gulf of Mexico (Rivas, 1966). According to Rivas (1966) and Carpenter and Nelson (1971),L. purpureusis found in the Caribbean Sea, in some areas of the USA coast, and also can be found on the north-ern and northeastnorth-ern coast of Brazil. Cervigón (1993) re-ports a distribution of L. purpureus from south of the Antilles to Northeastern Brazil.
The Brazilian Ministry for Environment has regis-tered for the year of 1975 an amount of capture of L. purpureusin Brazil close to nine thousand tons. Despite improvement in fleet and fishery techniques, the produc-tion decreased seven years later to only six thousand tons, which was an indication of overfishing of southern red snappers. A more dramatic scenario has been described in USA for the northern red snapper,L. campechanusduring
the last decades. In 1996 the Gulf of Mexico Fishery Man-agement Council and the US Department of Commerce de-clared that L. campechanus was grossly overfished and called for strict management measures to restore stocks to sustainable levels (Garberet al.; 2004; Markoet al.; 2004)
There is a remarkable similarity in morphology be-tweenL. campechanusandL. purpureus,starting by their same red color pattern, and coupled with completely identi-cal (hard and soft dorsal and anal fin rays) or overlapping (hard and soft pectoral fin rays, scale on lateral line, and gill rakers) meristic characters. Based on these characters, Cer-vigón (1993) raised the hypothesis of the existence of a sin-gle species of red snapper for the western Atlantic Ocean.
A recent phylogenetic analysis based on mitochon-drial DNA sequences (Markoet al.2004) surprisingly re-vealed that 77% of the fish sold in the marketplace in USA labeled as red snapper (Lutjanus campechanus) belonged indeed to other species of the Lutjanidae family, such as
Lutjanus erythropterus, L. synagris and Rhomboplites aurorubens. According to US FDA (Food and Drug Ad-ministration) (see Markoet al., 2004) onlyL. campechanus
can be legally labeled in USA as red snapper, regardless of the additional species called as red snappers in different countries, which is the case for L. purpureus in Brazil. However, if the hypothesis of Cervigón (1993) that L.
Send correspondence to Iracilda Sampaio. Laboratório de Gené-tica e Biologia Molecular, Universidade Federal do Pará, Alameda Leandro Ribeiro sn, 68600-000 Bragança, PA, Brazil. E-mail: ira@ufpa.br.
campechanusandL. purpureusare not different species be-came confirmed, all issues related to stock management of red snappers must be reconsidered.
To make a contribution to this interesting debate, we carried out the first molecular comparative analysis be-tween these two red snappers. For this purpose we collected DNA sequences of about 400 bp for the mitochondrial con-trol region (D-loop) from 93 specimens of L. purpureus
captured in three distinct localities of northern coastal wa-ters of Brazil (Amapá- 3° 20’ N, 50° 41’ W; Pará- 0° 08’ N, 47° 32’ W and Maranhão- 2° 13’ S, 42° 39’ W). These se-quences were pooled together in the same alignment with D-loop sequences for 27 L. campechanus deposited in GenBank (Garber, 2001) for Florida (AF356750-AF356757), Louisiana (AF356758-AF356763) and Mis-sissippi (AF356764-AF356776).
To extract DNA, muscle tissue was for 1 h by ribo-nuclease at 37 °C, followed by 2-4 h incubation at 55 °C with proteinase K. Total DNA was then purified by stan-dard phenol/chloroform extraction followed by precipita-tion using isopropanol (Sambrooket al., 1989). For each DNA sample the entire D-loop was amplified using the primers L1-5’-CCTAACTCCCAAAGCTAGGTATTC-3’ and H2-5’-CCGGCAGCTCTTAGCTTTAACTA-3’ de-signed for this work, and a fragment of approximately 400 base pairs was sequenced. PCR reactions were performed in 25µL of reaction mixture containing 4µL of 1.25 mM dNTP, 2.5 µL of buffer (10X conc.), 1 µL of 25 mM MgCl2, 0.5µL of each primer (200 ng/µL), 1µL of total DNA (200 ng/µL), 0.5µL of 5 U/µL Taq DNA polymerase and 15µL of pure water to complete the final volume of 25µL. Amplifications were performed in a thermocycler with a cycling profile of 94 °C for 3 min followed by 30 cy-cles of 94 °C for 30 s, 57 °C for 1 min, 72 °C for 2 min, end-ing with an extension step at 72 °C for 7 min. Amplification products were purified using ExoSap IT (Amersham-Phar-macia Biotech. Inc., Piscataway, NJ, USA) and submitted to a cycle-sequencing reaction using the fluorescence-labeled dideoxy terminators supplied in the ABI PrismTM Dye Terminator Cycle Sequencing Ready Reaction kit (Applied Biosystems, Foster City, CA, USA). Sequencing reactions were performed in a 10µL reaction mixture con-taining 1µL of DNA, 0.5 (1 mM) of primer, 1µL of Big Dye mix, 2µL of buffer (200 mM Tris/5 mM MgCl2) and 5.5µL of pure water. We used a cycling profile of 25 cycles of 96 °C for 30 s, 50 °C for 15 s and 60 °C for 3 min. The products were separated by electrophoresis (3 h at 3.000 V) and the sequences collected using the ABI Prism 377 auto-mated sequencer. Sequences were aligned using the Clustal X version 1.8 program (Thompsonet al., 1997) with default parameters. Minor modifications were made using the BIOEDIT sequence editor (Hall, 1999). Sequences of
Lutjanus synagris(Lane Snapper) from Pará State (Brazil) were used as outgroup. All newly generated D-loop
se-quences were deposited in GenBank (accession numbers EF656482-EF656576).
The best fit model selected by hierarchical Likelihood Ratio Test in Modeltest Version 3.6 (Posada and Crandal, 1998) was HKY+I+G with a proportion of invariant loci equal to 0.3934 and rates modeled by a gamma distribution with parameter alpha equal to 0.701. A Neighbor Joining tree was built in PAUP* (Swofford, 2002) using the param-eters chosen by Modeltest, and 1000 bootstrap pseudorepli-cates were generated in order to establish node reliability. The analysis of molecular variance (AMOVA) was used to partition genetic variance within and between populations of northern and southern red snapper using Arlequin 3.0 (Excoffieret al., 2005). The exact test of sample differenti-ation based on haplotype frequencies (Raymond and Rous-set. 1995) was accomplished using Arlequin 3.0 (Excoffier
et al., 2005).
The pairwise mismatch distribution for the entire populations was generated using Arlequin 3.0 (Excoffieret al., 2005), and demographic parametersθ0andθ1(and their
associated SSDPvalues) were estimated using a paramet-ric bootstrap (Rogers and Harpending, 1992; Rogers, 1995). Harpending’s (1994) raggedness index was com-puted for mismatch distribution, and its significance tested with 1000 replicates of bootstrap in Arlequin 3.0 (Excoffier
et al., 2005).Snnstatistic developed by Hudson (2000) and implemented in DnaSP 4.1 (Rozaset al., 2003) was applied to evaluate the proportion of nearest-neighbor haplotypes in the area shared by both species. We also used the statis-ticsD(Tajima (1989) andFs(Fu, 1997) implemented in the Arlequin 3.0 and in DnaSP 4.1 to infer deviations from neu-trality ofL.purpureusandL. campechanuspopulations.
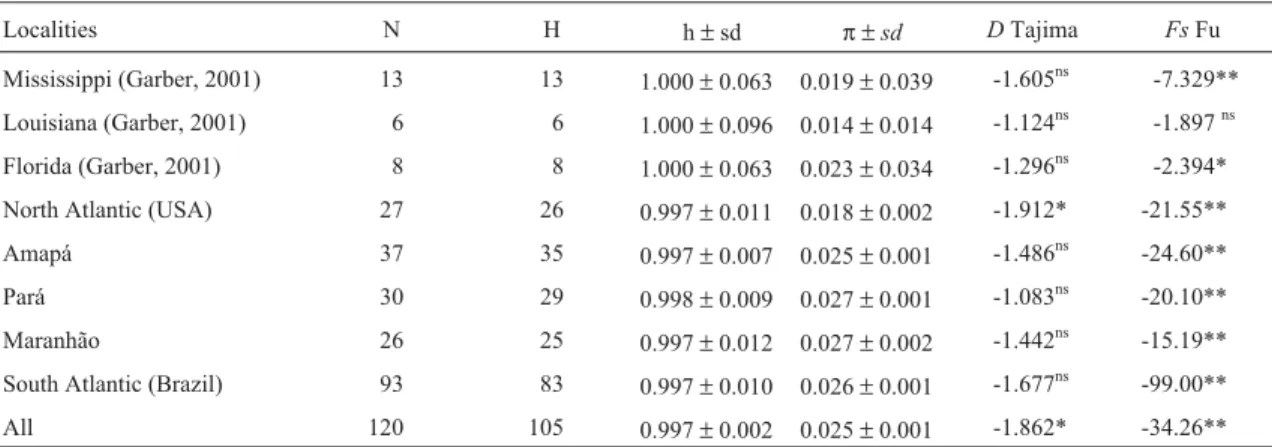
Ninety-threeL. purpureusfrom northern coastal wa-ters of Brazil (37 from Amapá, 30 from Pará and 26 from Maranhão) were compared with 27L. campechanus previ-ously studied by Garber (2001). Two sequences ofLutjanus synagrisfrom Pará were used as outgroup in the phylogen-etic analysis. A total of 143 variant sites were found of which 99 were informative for parsimony (82 with two and 15 with three variants) and 43 were singletons. A total of 89 haplotypes were observed of which 35 were from Amapá, 29 from Pará and 25 from Maranhão populations. The high-est number of absolute differences among haplotypes was 24, and the total haplotype diversity was 0.997. The USA populations showed the highest levels of haplotype diver-sity (1.0), probably as a consequence of the small sample sizes. Nucleotide diversity levels ranged from 0.014 in Louisiana to 0.027 in Pará and Maranhão populations (Ta-ble 1). North and South Atlantic populations have high haplotype and nucleotide diversities, which according to Grant and Bowen (1998) is suggestive of stable populations with long evolutionary history or secondary contact be-tween differentiated lineages.
interpretations are also valid in situations where selective neutrality cannot be discounted, such as in the mitochon-drial control region (Rand, 1996; Hartl and Clark, 1997). Tajima’sDwas negative and significant only for North At-lantic populations as a whole, but not for individual popula-tions. On the other hand, Tajima’s D was negative but not significant for the three South Atlantic populations. As it is well known the expected value of Tajima’sDstatistic is equal to zero under the null hypothesis and negative values reflect an excess of low-frequency variants in the popula-tion, consistent with positive selection or expansion (Taji-ma, 1989; Fu and Li, 1993). However, Fu’sFsstatistic test of neutrality tends be negative when there is an excess of re-cent mutations (population growth) as seems to be the case in the present study for all populations, except for the small sample (N = 6) of Louisiana. The apparent conflict between
D and Fs statistics could be due different sensitivity of these tests to sample size effect.
The phylogenetic tree showed no evidence of separa-tion betweenL. campechanusandL. purpureus(Figure 1), showing an unresolved polytomy. AMOVA also shows that North and South Atlantic red snappers are not signifi-cantly different (F/ΦCT= 0.1379, ns), with almost 90% of
the variance being found within populations (significant
F/ΦSTvalue of 0.1311) (Table 2). The exact test of sample
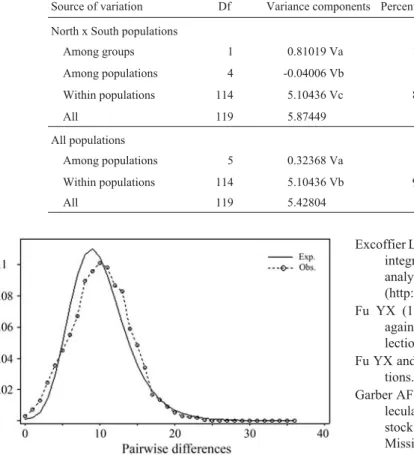
differentiation based on haplotype frequencies (Raymond and Rousset, 1995) also showed no genetic differentiation between populations, and similar conclusions were reached based on the very sensitiveSnntest (Hudson. 2000), which showed a value of 0.297 when all sub-samples of L. campechanusandL. purpureus were compared. Interest-ingly, mismatch distribution built for the entire group of
Lutjanusshowed a unimodal pattern (Figure 2) which is usually interpreted as representing populations that have passed through recent demographic expansion (Slatkin and Hudson, 1991; Rogers and Harpening, 1992) or through a
range expansion with high levels of migration between neighboring demes (Rayet al.2003, Excoffier 2004). Con-sidering these results, the hypothesis of a single species of red snappers cannot be rejected.
As morphological and the present mitochondrial data are not able to discriminate between the two Atlantic red snappers species, the most plausible and parsimonious hy-pothesis would be thatLutjanusfrom the North and South Atlantic Ocean represent slightly different populations of a single species with a large geographical distribution. This would be in agreement with the suggestion of Cervigón
Figure 1- Neighbor joining tree ofL. purpureusandL. campechanus pop-ulations from the West Atlantic based on the control region of mitochon-drial DNA. Numbers in the branches are bootstrap values obtained with 1000 pseudoreplicates. Bootstrap values shown in the tree are = 75%. The numbers beside each location are the registration of the sample in the labo-ratory.
Table 1- Measures of mitochondrial DNA haplotype (h) and nucleotide (π) diversity, and neutrality tests observed based on the D-loop region of red snappers from six localities of the Western Atlantic.
Localities N H h±sd π ±sd DTajima FsFu
Mississippi (Garber, 2001) 13 13 1.000±0.063 0.019±0.039 -1.605ns -7.329**
Louisiana (Garber, 2001) 6 6 1.000±0.096 0.014±0.014 -1.124ns -1.897ns
Florida (Garber, 2001) 8 8 1.000±0.063 0.023±0.034 -1.296ns -2.394*
North Atlantic (USA) 27 26 0.997±0.011 0.018±0.002 -1.912* -21.55**
Amapá 37 35 0.997±0.007 0.025±0.001 -1.486ns -24.60**
Pará 30 29 0.998±0.009 0.027±0.001 -1.083ns -20.10**
Maranhão 26 25 0.997±0.012 0.027±0.002 -1.442ns -15.19**
South Atlantic (Brazil) 93 83 0.997±0.010 0.026±0.001 -1.677ns -99.00**
All 120 105 0.997±0.002 0.025±0.001 -1.862* -34.26**
N = sample size; H = number of haplotypes;h= haplotype diversity;π= nucleotide diversity; sd = standard deviation; ns = no significant;D= Tajima sta-tistic (Tajima, 1989);Fs= Fu statistic (Fu, 1997).
(1993). However, considering the economic importance of this overexploited fish resource, and all legal questions re-lated to stock management ,as well as the mislabelling issue raised by Markoet al (2004), any decision about their taxo-nomic status should be well supported by additional genetic data, including the analysis of more populations along the entire distribution range ofL. purpureus/campechanus, as well as additional representatives of the Lutjanidae family.
Acknowledgments
This study was funded by CNPq-PADCT/MCT (Mil-lenium Project, grant no. 62.0052/01-5).
References
Carpenter JS and Nelson WR (1971) Fishery potential for snapper and grouper in the Caribbean area and the Guianas. FAO Fish Rep Rome 7:21-26.
Cervigón F (1993) Los Peces Marinhos de Venezuela, v. II. 2nded. Fundacion Científica Los Roques, Caracas, 498 pp. Excoffier L (2004) Patterns of DNA sequence diversity and
ge-netic structure after a range expansion: Lessons from the in-finite-island model. Mol Ecol 13:853-864.
Excoffier L, Laval G and Schneider S (2005) Arlequin (v. 3.0): An integrated software package for population genetics data analysis. Evol Bioinform Online 2005:47-50 (http://systbio.org/?q = node/73).
Fu YX (1997) Statistical methods of neutrality of mutations against population growth, hitchhiking and background se-lection. Genetics 147:915-925.
Fu YX and Li WH (1993) Statistical tests of neutrality of muta-tions. Genetics 133:93-709.
Garber AF (2001) Utilization of a hypervariable region as a mo-lecular marker for red snapper, Lutjanus campechanus, stock enhancement. M.Sc. Thesis. University of Southern Mississippi, Hattiesburg.
Garber AF, Tringali MD and Stuck KC (2004) Population struc-ture and variation in Red snapper (Lutjanus campechanus) from the Gulf of Mexico and Atlantic Coast of Florida as de-termined from mitochondrial DNA control region sequence. Mar Biotechnol 6:175-185.
Grant WS and Bowen BW (1998) Shallow population histories in deep evolutionary lineages of marine fishes: Insights from sardines and anchovies and lessons for conservation. J Hered 89:415-426.
Hall TA (1999) BioEdit: A user-friendly biological sequence alignment editor and analysis program for Windows 95/98/NT. Nucleic Acids Symp Ser 41:95-98.
Harpending HC (1994) Signature of ancient population growth in a low-resolution mitochondrial DNA mismatch distribution. Hum Biol 66:591-600.
Hartl DL and Clark AG (1997) Principles of Population Genetics. Sinauer Associates, Sunderland, 542 pp.
Hudson RR (2000) A new statistic for detecting genetic differenti-ation. Genetics 155:2011-2014.
Marko PB, Lee SC, Rice AM, Gramling JM, Fitzhenry TM, Mcalister JS, Harper GR and Moran AL (2004) Mislabelling of a depleted reef fish. Nature 430:309-310.
Posada D and Crandall KA (1998) MODELTEST: Testing the model of DNA substitution. Bioinformatics 14:817-818. Rand DM (1996) Neutrality tests of molecular markers and the
connections between DNA polymorphism, demography, and conservation biology. Conserv Biol 10:665-671. Ray N, Currat M and Excoffier L (2003) Intra-Deme molecular
diversity in spatially expanding populations. Mol Biol Evol 20:76-86.
Figure 2- Mismatch distribution based on 120 D-loop sequences ofL. purpureusandL. campechanusfrom six localities of the West Atlantic. The solid line is the observed and the dotted line is the expected distribu-tion of the pairwise differences.
Table 2- Analysis of Molecular Variance (AMOVA) for populations ofL. campechanusandL. purpureusfrom six localities based on mitochondrial D-loop sequences.
Source of variation Df Variance components Percentage of variation F/Φstatistic p
North x South populations
Among groups 1 0.81019 Va 13.79 F/ΦCT= 0.1379 NS
Among populations 4 -0.04006 Vb -0.68 F/ΦSC= -0.0079 NS
Within populations 114 5.10436 Vc 86.89 F/ΦST= 0.1311 < 0.001
All 119 5.87449
All populations
Among populations 5 0.32368 Va 5.96 F/ΦST= 0.0596 < 0.001
Within populations 114 5.10436 Vb 94.04
Raymond M and Rousset F (1995) An exact test for population differentiation. Evolution 49:1280-1283.
Rivas LR (1966) Review of theLutjanus campechanuscomplex of red snappers. Q J Flor Acad Sci 29:117-136.
Rogers AR (1995) Genetic evidence for a Pleistocene population explosion. Evolution 49:608-615.
Rogers AR and Harpending HC (1992) Population growth makes waves in the distribution of pairwise genetic differences. Mol Biol Evol 9:552-569.
Rozas J, Sánchez-DelBarrio JC, Messeguer X and Rozas R (2003) DNASP, DNA polymorphism analyses by the coalescent and other methods. Bioinformatics 19:2496-2497.
Sambrook J, Fritsch EF and Maniatis T (1989) Molecular Clon-ing: A Laboratory Manual. Cold Spring Harbor Laboratory Press, Could Spring Harbor.
Slatkin M and Hudson RR (1991) Pairwise comparisons of mito-chondrial DNA sequences in stable and exponentially grow-ing populations. Genetics 129:555-562.
Swofford DL (2002) PAUP, Phylogenetic Analysis Using Parsi-mony (and other methods), v. 4b10. Sinauer Associates, Inc. Publisher, Sunderland.
Tajima F (1989) Statistical method for testing the neutral mutation hypothesis by DNA polymorphism. Genetics 123:585-595. Thompson JD, Gibson TJ, Plewniak F, Jeanmougin F and Higgins
DG (1997) The CLUSTALX windows interface: Flexible strategies for multiple sequence alignment aided by quality analysis tools. Nucleic Acids Res 24:4876-4882.
Associate Editor: Antonio Solé-Cava