Germán Lobos Andrade
I, Carolina Salas Palma
III Universidad de Talca, Faculty of Business. Talca, Chile.
II Hospital Dr. Luis CalvoMackenna, Clinical Laboratory Unit. Providencia, Santiago, Chile.
How to cite this article:
Lobos G, Salas C. Costs of examinations performed in a hospital laboratory in Chile.
Rev Bras Enferm [Internet]. 2018;71(2):363-71. DOI: http://dx.doi.org/10.1590/0034-7167-2016-0688
Submission: 02-14-2017 Approval: 04-25-2017
ABSTRACT
Objective: To determine the total average costs related to laboratory examinations performed in a hospital laboratory in Chile. Method: Retrospective study with data from July 2014 to June 2015. 92 examinations classifi ed in ten groups were selected according to the analysis methodology. The costs were estimated as the sum of direct and indirect laboratory costs and indirect institutional factors. Results: The average values obtained for the costs according to examination group (in USD) were: 1.79 (clinical chemistry), 10.21 (immunoassay techniques), 13.27 (coagulation), 26.06 (high-performance liquid chromatography), 21.2 (immunological), 3.85 (gases and electrolytes), 156.48 (cytogenetic), 1.38 (urine), 4.02 (automated hematological), 4.93 (manual hematological). Conclusion: The value, or service fee, returned to public institutions who perform laboratory services does not adequately refl ect the true total average production costs of examinations.
Descriptors: Average Costs; Diagnoses and Laboratory Examinations; Direct and Indirect Costs; Service Fee; Production of Examinations.
RESUMEN
Objetivo: determinar los costos medios totales asociados a la realización de exámenes de laboratorio en un laboratorio clínico hospitalario de Chile. Método: estudio retrospectivo con información del período julio 2104 a junio 2015. Se seleccionaron 92 exámenes clasifi cados en diez grupos según la metodología de análisis. Los costos se estimaron como la suma de costos directos e indirectos de laboratorio y factores indirectos institucionales. Resultados: se obtuvieron los valores promedio para los costos según grupo de exámenes (en dólares): 1,79 (química clínica), 10,21 (técnicas de inmunoensayos), 13,27 (coagulación), 26,06 (cromatografía líquida de alta resolución), 21,2 (inmunológicos), 3,85 (gases y electrolitos), 156,48 (citogenéticos), 1,38 (orina), 4,02 (hematológicos automatizados), 4,93 (hematológicos manuales). Conclusión: el valor que retorna a las instituciones públicas, o arancel por servicio, que prestan servicios de laboratorio no refl eja adecuadamente los verdaderos costos medios totales de producción de exámenes. Descriptores: Costos Medios; Diagnósticos y Exámenes de Laboratorio; Costos Directos e Indirectos; Arancel por Servicio; Producción de Exámenes.
RESUMO
Objetivo: Determinar os custos médios totais associados à realização de exames laboratoriais em um laboratório clínico hospitalar no Chile. Método: Estudo retrospectivo com informações de julho de 2014 a junho de 2015. Foram selecionados 92 exames classifi cados em dez grupos de acordo com a metodologia de análise. Os custos foram estimados como a soma dos custos diretos e indiretos de laboratório e fatores institucionais indiretos. Resultados: Os valores médios dos custos foram obtidos de acordo com o grupo de exames (em dólares): 1,79 (química clínica), 10,21 (técnicas de imunoensaio), 13,27 (coagulação), 26,06 (cromatografi a líquida de alta resolução), 21,2 (imunológicos), 3,85 (gases e eletrólitos), 156,48 (citogenéticos), 1,38 (urina), 4,02 (hematológicos automáticos), 4,93 (hematológicos manuais). Conclusão: O valor retornado às instituições públicas, ou taxas de serviço, que prestam serviços laboratoriais não refl etem adequadamente os custos totais reais da produção de exames. Descritores: Custos Médios; Diagnósticos e Exames Laboratoriais; Custos Diretos e Indiretos; Tarifa de Serviço; Produção de Exames.
Costs of examinations performed in a hospital laboratory in Chile
Costos de exámenes en un laboratorio clínico hospitalario de Chile
Custos de exames em um laboratório clínico hospitalar no Chile
Carolina Salas Palma E-mail: [email protected]
INTRODUCTION
In the management of health services, like those of a clinical laboratory, criteria are applied in the operational and scientific planning, and others are applied that are inherent to the social sciences, like those used in human resources management or economic-administrative management(1). In a clinical laboratory
LC, it is fundamental to have reliable and up-to-date informa-tion on the magnitude of the total cost (CT) of the examinainforma-tions processed as a basis to improve efficiency. Knowing the costs is a valuable contribution to the management of the hospitals for two reasons. First, because in a scenario of increasing demand for examinations, costs are permanently rising; it is estimated that expenditure on laboratory examinations for a hospitalized patient is 6% of the total cost and for a surgical patient 9% of the total cost of hospitalization(2). Second, given the possible
exis-tence of “economies of scale”, i.e., that the cost per examination produced, the total average cost (CMT) decreases as more exam-inations are performed(3). This is possible to apply using the
in-strumentation and human resources available, but it has a limit given the existence of fixed factors transformed into limiting fac-tors for the expansion of laboratory production. Therefore, cost estimation is a fundamental tool for the management oversight of a hospital clinical laboratory, as it enables approximation of the economic production cost (i.e., knowing all the costs includ-ing the opportunity costs), which allows among other thinclud-ings estimation of the price that should be charged for the service, knowing the profitability as a percentage of the price, and plan-ning the destination of surpluses, when the income for examina-tion services are greater than the total costs of these services. Although the factors that influence the cost of an examination are easily identifiable, there is not much information or many ad hoc costing models on the issue. As background, the literature shows that for clinical examinations more than half of the cost of the examination is direct labor(4), which is why it is important to
increase productivity to reduce the unit production costs(5). Most
studies describe clinical laboratory cost systems as being based on their assignability, i.e., direct and indirect costs(6-10).
In the Chilean public health system, examinations are coded by the National Health Insurance System (FONASA). This entity is in charge of giving a unique code to practically all laboratory examinations as well as assigning them a monetary value. This coding and valuation system is called the “FONASA institutional attention modality” (F-IAM) fee and it is the value that each pub-lic institution receives when they render these services. If this fee is not in line with the true CMT of producing examinations, then the economic return to the institutions in laboratory examina-tions could be creating gaps for public health instituexamina-tions. These gaps between income and costs may be due to production (in) efficiencies associated with institutional, management, financ-ing, socioeconomic and demographic factors(11). An efficiency
analysis, however, is beyond the scope of this study.
In Chile there are two recent studies on the costs of health services. The first study included twelve service providers, nine public and three private, and 738 laboratory and 218 im-aging services(12). The second included 16 public hospitals
se-lected by convenience and 120 services with the F-IAM fee(13).
The results of this study indicate that the prices of the services are undervalued as they do not cover 43.7% of the invoicing, although the gaps differ by health center.
At the moment the valuation of examination costs used in the clinical laboratory of the Hospital Dr. Luis Calvo Mackenna (HCM) does not identify in any integrated way all the costs that affect their performance. Nevertheless, our central hypothesis is that the F-IAM fee differs from the HCM’s valuation because the costing methodology applied by FONASA only includes some of the production costs currently valued by the HCM. Thus, this work has two objectives: The first is to determine the total aver-age costs related to laboratory examinations processed in the clinical laboratory unit of the HCM. This involves allocating all the relevant costs(7) that influence the performance of each
ex-amination, which will make it possible to verify the status of the costs of the HCM compared to the F-IAM fee. The second ob-jective is to compare the F-IAM fee with the total average costs for a selected group of examinations in order to identify the gap between the economic return and the average production cost.
METHOD
Ethical aspects
The use of the information in this study was authorized by the Director of the HCM. The results will be “a contribution to optimizing the management” of the institution.
Design, study site and period
This is a retrospective study with complete information from one calendar year. Quantitative information was used; the data were extracted from primary sources of the CL of the HCM. The information used corresponds to data from July 2014 to June 2015.
Population or sample; inclusion and exclusion criteria 170 types of examinations were processed during the study period. 92 representative examinations were selected from all the methodology types of analyses available in the CL. The 92 examinations were classified in 10 groups (G1, ..., G10) accord-ing to the analytical technique used. The number of examina-tions included in each group and the technique used were: G1 = 35 (clinical chemistry), G2 = 16 (immunoassay-based tech-niques), G3 = 9 (coagulation), G4 = 3 (performed by high per-formance liquid chromatography, HPLC), G5 = 8 (immunologi-cal), G6 = 2 (gases and electrolytes), G7 = 4 (cytogenetic), G8 = 1 (urine by microscopy), G9 = 1 (automated hematological), G10 = 13 (hematological by manual techniques).
Theoretical-methodological and conceptual framework This article is derived from the Master in Health Management Systems thesis entitled, “Estimation of costs of clinical laboratory services in the Hospital Dr. Luis Calvo Mackenna”. For each type of examination, the total average cost (CMTi, j ) was calculated as the sum of the direct average laboratory costs (CMDLi, j ), indirect average laboratory costs (CMILi, j ) and average indirect institution-al costs (CMIIi, j ). This is:
In Equation (1) subindex i indicates the type of examination ( i = 1, ..., 92 ) and subindex j indicates the group to which the type of examination i belongs ( j = 1, ..., 10 ). Additionally, the total average cost ( �j ) and the standard deviation ( �� ) of each group of examinations were calculated.
CMDLi, j refer to costs related directly to processing the exami-nations; CMILi, j are all the costs not directly related to the produc-tion of an examinaproduc-tion. To collect the data regarding the direct and indirect costs, an Excel spreadsheet was used that included a page dedicated to identifying and quantifying each cost type. The direct costs included reagents ( RC i,j ), internal controls ( CIi, j ), external controls ( CEi, j ) and direct labor ( MODi, j ). The indirect laboratory costs included indirect labor ( MOIi, j ), main equipment ( EPi, j ), infrastructure ( INi, j ), furniture ( MBi, j ), general supplies ( IGi, j ), office supplies ( AFi, j ), and maintenance and repairs ( MRi, j ). Indirect institutional costs included basic services ( SBi, j ) and general services ( SGi, j ). For the analysis of reagent costs, all the supplies with the respective yields were identified and quantified. The information about the purchase price was obtained from the monthly purchase lists made in the laboratory. In order to esti-mate the labor cost, laboratory personnel salary information was requested from human resources; this information was differenti-ated in relation to the unit to which each of them belongs and was associated with the respective group of examinations.
Average direct laboratory costs
Reagents: For each RCi, j the average consumption per purchase
unit and the cost of each of these units were calculated. The average cost was calculated as the ratio between the individual value of RCi, j and the number of examinations reported with this reagent.
Internal controls: These are controls used periodically to
verify the analytical behavior of the technique, the objective of which is to control the results that the CL provides. To do this, control samples (commercial preparations) of known value were used. The CIi, j used for each type of examination were identified ,and it was estimated how many examinations were possible to report for each purchase unit. The average cost was calculated as the ratio between the individual value of each CIi, j kit and the number of examinations reported with this kit. For the case of more than one CIi, j, this was determined in the same way and then the contributions from each were added.
External controls: These are controls used to verify the
ana-lytical behavior of each technique and to compare them to those obtained by different laboratories for the same examinations. The CEi, j used for each of the examinations were identified and it was estimated how many examinations could be reported for each purchase unit. The average cost was calculated as the ratio between the individual value of each CEi, j kit or program and the number of examinations reported with this kit. For the case of more than one CEi, j this was determined in the same way and then the contributions of each were added.
Direct labor: The annual cost in remunerations included all the
personnel in the CL who participate directly in the performance of
an examination: the unit head, professionals and laboratory techni-cians. The average cost of MODi, j was estimated as the ratio be-tween the annual cost in remunerations of the direct personnel and the number of examinations reported by the CL in the same period.
Average indirect laboratory costs
This study included the alternative cost of the capital as a proxy variable of the depreciation for the assets EPi, j, ESi, j, INi, j and MBi, j. In each case the annual replacement cost (CRA) was calculated as its commercial value (VC) multiplied by the simple formula of payment amortization:
where n is the remaining useful life estimated for each asset and r = 6% is the social discount rate reported by the Chilean Ministry of Social Development (MIDESO) in 2016.
Indirect labor: The annual cost in remunerations of all the
per-sonnel in the CL who participate indirectly in the performance of examinations and who provide cross-sectional support to all the specialized units in the CL. This is the general laboratory head, receiving laboratory technicians and laboratory assistants. The av-erage cost of the MOIi, j was estimated as the ratio between the an-nual cost in remunerations of indirect personnel and the number of examinations reported by the CL in the same period.
Main equipment: This is used to process the laboratory
ex-aminations included in the work. The average cost assigned to each examination processed was obtained as the ratio be-tween the CRA ( �=10 ) of the EPi, j and the annual production of examinations performed on the equipment.
Laboratory support equipment: This is the basic
equip-ment in the CL which serves as support for all the examina-tions processed in this unit. This includes such equipment as centrifuges, hoods, thermoregulated baths, analytical balanc-es and ovens, among other things. The average cost assigned to each examination was obtained as the ratio between the sum of the CRA ( �=10 ) of all the ESi, j and the annual produc-tion of examinaproduc-tions performed in the CL.
Infrastructure: The surface occupied by the CL with respect
to the total surface of the HCM was estimated (in %). This per-centage was multiplied by the commercial value of the infra-structure of the HCM to obtain the commercial value of the infrastructure allocated to the CL. The CRA associated with in-frastructure use was obtained as the commercial value allocated to the CL multiplied by the social discount rate. Thus, the aver-age cost assigned to each examination was obtained as the ratio between the TAC ( � ∞) of the INi, j and the annual production of examinations performed in the CL.
Furniture: This included office furniture, computers, printers,
telephones, various dispensers and chairs, among other things. The average cost assigned to each examination was obtained as
(2) CRA = VC (1+r)
n xr
the ratio between the sum of the CRA ( �=10 ) of all the MBi, j and the annual production of examinations performed in the CL.
General supplies:This included all the general supplies used
in the CL during the period, which are used cross-sectionally to process all the examinations performed in the CL, such as gloves, Eppendorf tubes, tips for micropipettes, droppers, etc. The average cost assigned to each examination was obtained as the ratio between the sum of the costs of all the IGi, j and the an-nual production of examinations performed in the CL.
Office supplies: This included all the office supplies used
in the CL during the period, which are used interchangeably in the production of all the laboratory examinations. The aver-age cost assigned to each examination was obtained as the ra-tio between the sum of the costs of all the AFi, j and the annual production of examinations performed in the CL unit.
Maintenance and repairs: This included the costs of
main-tenance and repairs of buildings, furniture, machinery and office equipment, CL equipment and other maintenance and repairs of each unit in the CL. The average cost assigned to each examination was obtained as the ratio between the sum of the costs in MRi, j and the annual production of examina-tions performed in the CL unit.
Average indirect institutional costs
Basic services:This included the cost of electricity, water,
gas, telephones, Internet and telecommunications links. The
average cost assigned to each examination was obtained as the ratio between the sum of the costs in SBi, j and the annual production of examinations performed in the CL unit.
General services: This included the cost of janitorial
ser-vices, security, landscaping, trash and hazardous waste col-lection, transportation, shipping, storage and other general services. The average cost assigned to each examination was obtained as the ratio between the sum of the costs in SGi,
j and the annual production of examinations performed in
the CL unit.
Results analysis
The F-IAM fee was compared with the CMT for a selected group of examinations. The profitability(14) of each
examina-tion was calculated as the difference between the F-IAM fee and the CMTexpressed as a percentage of the F-IAM fee. Fi-nally, and given the total number of examinations performed for each type of examination selected, the total production cost (TPC) of examinations was compared with the total in-come (TI) derived from the total contribution by the F-IAM fee.
RESULTS
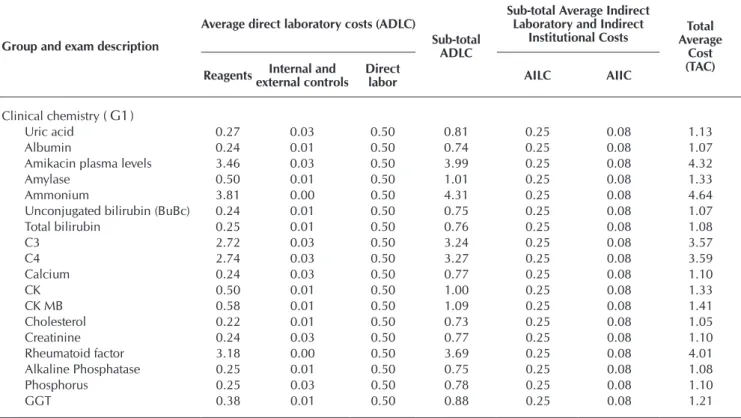
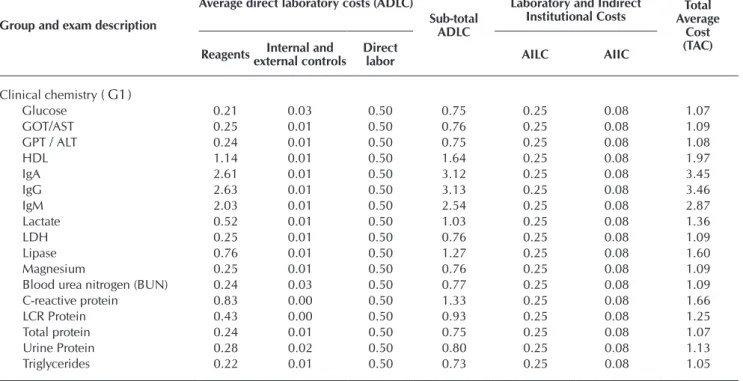
In the area of clinical chemistry ( G1 ), the most expensive examination was ammonium at 4.64 USD and the least ex-pensive were cholesterol and triglycerides at 1.05 USD (Table 1). The average cost ( �1 ) and the standard deviation ( �1 ) of
this group of examinations was estimated to be 1.79 and 1.12 USD, respectively.
Table 1 − Total average cost of examinations in the area of clinical chemistry (G_1 ), Values in USD
Group and exam description
Average direct laboratory costs (ADLC)
Sub-total ADLC
Sub-total Average Indirect Laboratory and Indirect
Institutional Costs Average Total Cost (TAC) Reagents Internal and
external controls
Direct
labor AILC AIIC
Clinical chemistry ( G1)
Uric acid 0.27 0.03 0.50 0.81 0.25 0.08 1.13
Albumin 0.24 0.01 0.50 0.74 0.25 0.08 1.07
Amikacin plasma levels 3.46 0.03 0.50 3.99 0.25 0.08 4.32
Amylase 0.50 0.01 0.50 1.01 0.25 0.08 1.33
Ammonium 3.81 0.00 0.50 4.31 0.25 0.08 4.64
Unconjugated bilirubin (BuBc) 0.24 0.01 0.50 0.75 0.25 0.08 1.07
Total bilirubin 0.25 0.01 0.50 0.76 0.25 0.08 1.08
C3 2.72 0.03 0.50 3.24 0.25 0.08 3.57
C4 2.74 0.03 0.50 3.27 0.25 0.08 3.59
Calcium 0.24 0.03 0.50 0.77 0.25 0.08 1.10
CK 0.50 0.01 0.50 1.00 0.25 0.08 1.33
CK MB 0.58 0.01 0.50 1.09 0.25 0.08 1.41
Cholesterol 0.22 0.01 0.50 0.73 0.25 0.08 1.05
Creatinine 0.24 0.03 0.50 0.77 0.25 0.08 1.10
Rheumatoid factor 3.18 0.00 0.50 3.69 0.25 0.08 4.01
Alkaline Phosphatase 0.25 0.01 0.50 0.75 0.25 0.08 1.08
Phosphorus 0.25 0.03 0.50 0.78 0.25 0.08 1.10
GGT 0.38 0.01 0.50 0.88 0.25 0.08 1.21
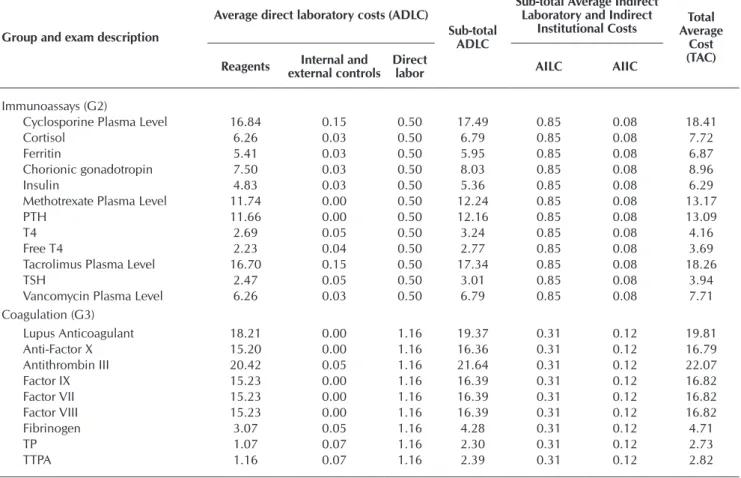
Table 2 − Total average cost of examinations based on immunoassay ( G2 ) and coagulation techniques ( G3 ), Values in USD
Group and exam description
Average direct laboratory costs (ADLC)
Sub-total ADLC
Sub-total Average Indirect Laboratory and Indirect
Institutional Costs Average Total Cost (TAC) Reagents external controlsInternal and Direct labor AILC AIIC
Immunoassays (G2)
25-Hydroxy Vitamin D 20.64 0.03 0.50 21.17 0.85 0.08 22.09
Alpha-fetoprotein 6.64 0.71 0.50 7.84 0.85 0.08 8.77
aTG 8.90 0.00 0.50 9.40 0.85 0.08 10.32
aTPO 8.47 0.00 0.50 8.97 0.85 0.08 9.90
Group and exam description
Average direct laboratory costs (ADLC)
Sub-total ADLC
Sub-total Average Indirect Laboratory and Indirect
Institutional Costs Average Total Cost (TAC) Reagentsexternal controlsInternal and Direct labor AILC AIIC
Clinical chemistry ( G1)
Glucose 0.21 0.03 0.50 0.75 0.25 0.08 1.07
GOT/AST 0.25 0.01 0.50 0.76 0.25 0.08 1.09
GPT / ALT 0.24 0.01 0.50 0.75 0.25 0.08 1.08
HDL 1.14 0.01 0.50 1.64 0.25 0.08 1.97
IgA 2.61 0.01 0.50 3.12 0.25 0.08 3.45
IgG 2.63 0.01 0.50 3.13 0.25 0.08 3.46
IgM 2.03 0.01 0.50 2.54 0.25 0.08 2.87
Lactate 0.52 0.01 0.50 1.03 0.25 0.08 1.36
LDH 0.25 0.01 0.50 0.76 0.25 0.08 1.09
Lipase 0.76 0.01 0.50 1.27 0.25 0.08 1.60
Magnesium 0.25 0.01 0.50 0.76 0.25 0.08 1.09
Blood urea nitrogen (BUN) 0.24 0.03 0.50 0.77 0.25 0.08 1.09
C-reactive protein 0.83 0.00 0.50 1.33 0.25 0.08 1.66
LCR Protein 0.43 0.00 0.50 0.93 0.25 0.08 1.25
Total protein 0.24 0.01 0.50 0.75 0.25 0.08 1.07
Urine Protein 0.28 0.02 0.50 0.80 0.25 0.08 1.13
Triglycerides 0.22 0.01 0.50 0.73 0.25 0.08 1.05
Note: AC: Average Cost; AILC: Average indirect laboratory cost; AIIC: Average indirect institutional cost.
Table 1 (concluded)
The costs of examinations in the immunoassay ( G2 ) and co-agulation ( G3 ) groups are shown in Table 2. In G2 the most and least expensive examinations were cyclosporine plasma level at 18.41 USD and free T4 at 3.69 USD. In this group �2 = 10.21 and �2 = 4.49. In G3 the most and least expensive examinations were
lupus anticoagulant at 19.81 USD and TTPA at 2.82 USD. In this group �3 = 13.27 and �3 = 7.62.
The examinations done using HPLC ( G4 ), immunology ( G5 ) and gases and electrolytes ( G6 ) are in Table 3. In G4 the most and least expensive examinations were voriconazole plasma lev-el at 26.78 USD and mycophenolic acid plasma levlev-el at 24.53 USD. In this group �4 = 26.06 and �4 = 1.33. In G5 the most and
least expensive examinations were antineutrophil cytoplasmic antibody (cANCA) at 29.91 USD and antiendomysial antibody at 15.29 USD. In this group �5 = 21.2 and �5 = 5.55. In G6 the
costs of the examinations were 5.35 USD for urinary electrolytes and 2.30 USD for arterial blood gases+plasma electrolytes. In this group �6 = 3.85 and �6 = 2.18.
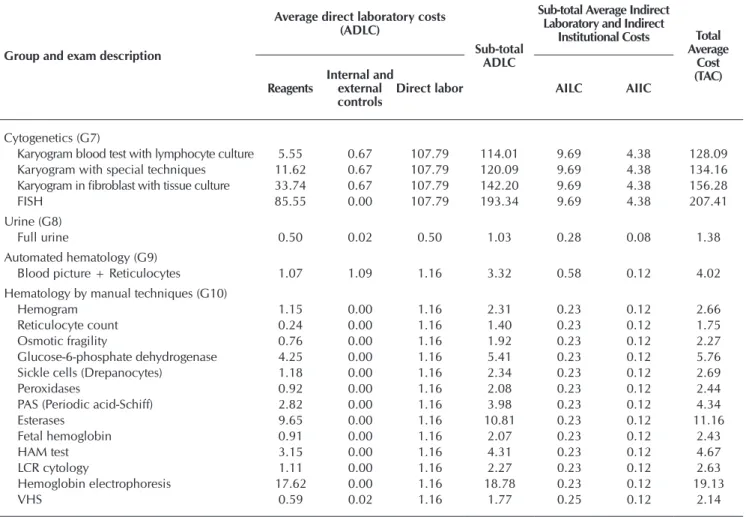
In the cytogenetic group ( G7 ) the most expensive examination was FISH at 207.41 USD and the least expensive was the karyo-gram blood test with lymphocyte culture at 128.09 USD. In this group �7 = 156.48 and �7 = 36.05. In the urine by microscopy
group ( G8 ) the cost of the full urine examination was 1.38 USD. In the automated hematology group ( G9 ) the cost of the blood picture examination + reticulocyte count was 4.02 USD. Finally, in the hematology by manual techniques group ( G10 ) the most expensive examination was hemoglobin electrophoresis at 19.13 USD and the least expensive was reticulocyte count at 1.75 USD. In this group �10 = 4.93 and �10 = 4.95 (Table 4).
Table 5 presents the results of the comparison of the F-IAM fee and the TAC for a selected group of 32 examinations. The highest profitability was observed in CK MB with 74.5% and lowest was -170.1% for karyogram in fibroblast with tissue cul-ture. The total cost for the group of 32 selected examinations was estimated to be 607,936 USD, whereas the total income for examination services was estimated to be 608,050 USD.
Group and exam description
Average direct laboratory costs (ADLC)
Sub-total ADLC
Sub-total Average Indirect Laboratory and Indirect
Institutional Costs Average Total Cost (TAC) Reagents external controlsInternal and Direct labor AILC AIIC
Immunoassays (G2)
Cyclosporine Plasma Level 16.84 0.15 0.50 17.49 0.85 0.08 18.41
Cortisol 6.26 0.03 0.50 6.79 0.85 0.08 7.72
Ferritin 5.41 0.03 0.50 5.95 0.85 0.08 6.87
Chorionic gonadotropin 7.50 0.03 0.50 8.03 0.85 0.08 8.96
Insulin 4.83 0.03 0.50 5.36 0.85 0.08 6.29
Methotrexate Plasma Level 11.74 0.00 0.50 12.24 0.85 0.08 13.17
PTH 11.66 0.00 0.50 12.16 0.85 0.08 13.09
T4 2.69 0.05 0.50 3.24 0.85 0.08 4.16
Free T4 2.23 0.04 0.50 2.77 0.85 0.08 3.69
Tacrolimus Plasma Level 16.70 0.15 0.50 17.34 0.85 0.08 18.26
TSH 2.47 0.05 0.50 3.01 0.85 0.08 3.94
Vancomycin Plasma Level 6.26 0.03 0.50 6.79 0.85 0.08 7.71 Coagulation (G3)
Lupus Anticoagulant 18.21 0.00 1.16 19.37 0.31 0.12 19.81
Anti-Factor X 15.20 0.00 1.16 16.36 0.31 0.12 16.79
Antithrombin III 20.42 0.05 1.16 21.64 0.31 0.12 22.07
Factor IX 15.23 0.00 1.16 16.39 0.31 0.12 16.82
Factor VII 15.23 0.00 1.16 16.39 0.31 0.12 16.82
Factor VIII 15.23 0.00 1.16 16.39 0.31 0.12 16.82
Fibrinogen 3.07 0.05 1.16 4.28 0.31 0.12 4.71
TP 1.07 0.07 1.16 2.30 0.31 0.12 2.73
TTPA 1.16 0.07 1.16 2.39 0.31 0.12 2.82
Note: AC: Average Cost; AILC: Average indirect laboratory cost; AIIC: Average indirect institutional cost.
Table 3 − Total average cost of exams done by HPLC ( G4 ), immunology ( G5 ), and gases and electrolytes ( G6 ), Values in USD
Group and exam description
Average direct laboratory costs (ADLC)
Sub-total ADLC
Sub-total Average Indirect Laboratory
and Indirect
Institutional Costs Total Average
Cost (TAC) Reagents
Internal and external controls
Direct
labor AILC AIIC
HPLC ( G4 )
Mycophenolic Ac. plasma level 3.26 1.47 0.50 5.23 19.22 0.08 24.53 Voriconazole plasma level 7.07 0.00 0.50 7.57 19.22 0.08 26.87 Posaconazole plasma level 6.98 0.00 0.50 7.48 19.22 0.08 26.78 Immunology (G5)
Antitransglutaminase AB IgA 9.82 0.15 5.33 15.30 1.86 0.56 17.72
Anti-DNA AB (aDNA) 7.52 0.14 5.33 12.99 1.86 0.56 15.42
Antibody to Extractable Nuclear Antigen (aENA) profile (identification) 16.40 0.86 5.33 22.59 1.86 0.56 25.02 Anti-cardiolipin AB identification (IgG or IgA) 18.37 0.00 5.33 23.70 1.86 0.56 26.12 Antineutrophil cytoplasmic AB (cANCA) 22.15 0.00 5.33 27.48 1.86 0.56 29.91
Antinuclear AB (ANA) 9.17 0.14 5.33 14.64 1.86 0.56 17.06
Mitochondrial AB and anti-smooth muscle AB. 15.32 0.00 5.33 20.65 1.86 0.56 23.07
Antiendomysial AB 7.54 0.00 5.33 12.87 1.86 0.56 15.29
Gases and electrolytes (G6)
Arterial blood gases/+ plasma electrolytes 1.17 0.01 0.50 1.68 0.55 0.08 2.30
Urinary electrolytes 1.07 0.00 0.50 1.57 3.75 0.08 5.39
Note: AC: Average Cost; AILC: Average indirect laboratory cost; AIIC: Average indirect institutional cost.
Table 4 − Total average cost of cytogenic exams ( G7 ), urinary ( G8 ), automated hematology ( G9 ), and hematology by manual techniques ( G10 ). Values in USD
Group and exam description
Average direct laboratory costs (ADLC)
Sub-total ADLC
Sub-total Average Indirect Laboratory and Indirect
Institutional Costs Total Average
Cost (TAC) Reagents
Internal and external controls
Direct labor AILC AIIC
Cytogenetics (G7)
Karyogram blood test with lymphocyte culture 5.55 0.67 107.79 114.01 9.69 4.38 128.09 Karyogram with special techniques 11.62 0.67 107.79 120.09 9.69 4.38 134.16 Karyogram in fibroblast with tissue culture 33.74 0.67 107.79 142.20 9.69 4.38 156.28
FISH 85.55 0.00 107.79 193.34 9.69 4.38 207.41
Urine (G8)
Full urine 0.50 0.02 0.50 1.03 0.28 0.08 1.38
Automated hematology (G9)
Blood picture + Reticulocytes 1.07 1.09 1.16 3.32 0.58 0.12 4.02 Hematology by manual techniques (G10)
Hemogram 1.15 0.00 1.16 2.31 0.23 0.12 2.66
Reticulocyte count 0.24 0.00 1.16 1.40 0.23 0.12 1.75
Osmotic fragility 0.76 0.00 1.16 1.92 0.23 0.12 2.27
Glucose-6-phosphate dehydrogenase 4.25 0.00 1.16 5.41 0.23 0.12 5.76 Sickle cells (Drepanocytes) 1.18 0.00 1.16 2.34 0.23 0.12 2.69
Peroxidases 0.92 0.00 1.16 2.08 0.23 0.12 2.44
PAS (Periodic acid-Schiff) 2.82 0.00 1.16 3.98 0.23 0.12 4.34
Esterases 9.65 0.00 1.16 10.81 0.23 0.12 11.16
Fetal hemoglobin 0.91 0.00 1.16 2.07 0.23 0.12 2.43
HAM test 3.15 0.00 1.16 4.31 0.23 0.12 4.67
LCR cytology 1.11 0.00 1.16 2.27 0.23 0.12 2.63
Hemoglobin electrophoresis 17.62 0.00 1.16 18.78 0.23 0.12 19.13
VHS 0.59 0.02 1.16 1.77 0.25 0.12 2.14
Note: AC: Average Cost; AILC: Average indirect laboratory cost; AIIC: Average indirect institutional cost.
Table 5 − Comparison of the National Health Insurance (FONASA) fee and total average cost, profitability, income and total cost of a selected group of examinations
Exam description
FONASA IAM fee and TAC
(USD)
Profitability (%)
Annual production of examinations
(number)
TC of examinations
(USD)
IT from examinations
performed
IAM TAC MAI – CMT n TC = n x TAC TI = n x IAM
MAI
Uric acid 1.86 1.13 39.21 2,711 3,068 5,047
Albumin 1.71 1.07 37.32 18,508 19,810 31,606
Amikacin plasma level 6.62 4.32 34.76 791 3,414 5,233
Amylase 2.74 1.33 51.37 2,025 2,697 5,545
Ammonium 2.48 4.64 -87.37 1,241 5,759 3,074
Total bilirubin 1.54 1.08 29.52 32,247 34,966 49,611
C3 5.40 3.57 33.96 350 1,248 1,890
C4 5.40 3.59 33.49 350 1,257 1,890
Calcium 1.35 1.10 19.06 18,980 20,798 25,696
CK 4.25 1.33 68.67 815 1,084 3,461
CK MB 5.55 1.41 74.54 405 573 2,249
Cholesterol 1.62 1.05 34.92 19,573 20,578 31,618
Creatinine 1.57 1.10 29.99 24,900 27,354 39,074
Rheumatoid factor 5.57 4.01 27.96 150 602 835
Alkaline Phosphatase 1.58 1.08 31.88 18,175 19,617 28,800
Exam description
FONASA IAM fee and TAC
(USD)
Profitability (%)
Annual production of examinations
(number)
TC of examinations
(USD)
IT from examinations
performed
IAM TAC MAI – CMT n TC = n x TAC TI = n x IAM
MAI
Phosphorus 2.05 1.10 46.03 18,802 20,763 38,472
GGT 2.63 1.21 54.04 7,022 8,490 18,473
Glucose 1.57 1.07 31.72 19,944 21,369 31,297
Insulin 6.14 6.29 -2.39 600 3,771 3,683
Methotrexate Plasma Level 6.62 13.17 -99.01 1,000 13,165 6,615
T4 5.37 4.16 22.46 1,000 4,163 5,369
Free T4 6.14 3.69 39.90 1,700 6,272 10,435
TSH 5.37 3.94 26.64 2,500 9,847 13,423
Vancomycin Plasma Level 6.62 7.71 -16.57 1,800 13,881 11,908
Fibrinogen 2.48 4.71 -90.24 1,048 4,938 2,596
TP 2.12 2.73 -28.54 5,756 15,708 12,220
TTPA 2.71 2.82 -4.14 4,668 13,163 12,640
Karyogram blood test with lymphocyte culture 54.11 128.09 -136.73 500 64,044 27,054 Karyogram with special techniques 57.86 134.16 -131.86 351 47,090 20,309 Karyogram in fibroblast with tissue culture 57.86 156.28 -170.09 55 8,595 3,182
Full urine 2.22 1.38 37.49 12,100 16,757 26,806
Hemogram (includes VHS) 3.55 4.81 -35.29 36,000 173,094 127,938
Totals 256,067 607,936 608,050
Note: FONASA: National Health Insurance System; IAM – Institutional attention modality, TAC – Total Average Cost, TC – Total Cost, TI – Total Income
DISCUSSION
In this work all the factors suggested by the literature for a suit-able estimation of costs were considered. These were to identify the consumption of resources associated with the services, to quantify the physical consumption of resources and to assess the consump-tion of resources(5). The quantification of the performance and
re-sources used was done retrospectively and one calendar year was the analysis time; therefore, the unit costs obtained for each service include all the costs involved in the production of a unit.
The 10 groups of examinations analyzed, which included a total 92 examinations performed in the CL of the HCM, are more than 50% of the total portfolio of the CL. The examina-tions included correspond to several specialties and analysis methodologies (manual, semi-automated and automated).
The clinical chemistry group presents the examinations with the lowest CMT. In this group the concept of scale economy “the greater the production the lower the cost”(3) is fulfilled, as is the
“80-20” rule(3), which classifies the examinations of highest production
in terms of volume (80%) as carrying the lowest cost (20%). This is because this group of examinations are produced in the great-est volume and the labor factor is less relevant. It should be noted that labor is a difficult factor to manage in public centers, because the seniority of the human resources involves higher costs, which is not always associated with greater productivity. In addition, the tenure of the personnel must be considered, which prevents hu-man resources from being transferred to areas of greater production depending on each worker’s degree of specialization.
In the cytogenetic examinations more than 50% of the ex-amination cost is direct labor, which is consistent with what has been reported in the literature(4); in addition, it seems important
to increase productivity to obtain lower unit production costs(5).
However, this is not always possible since such examinations are specialized and require highly qualified labor. They are also very specific examinations and in low demand.
It was noted that the total average costs of the examina-tions and their respective F-IAM value differed in all cases for the group of 32 examinations selected. The same occurred with the sample of 92 examinations included in this study, where in 44 cases (47%) the CMT was higher than the F-IAM fee, whereas in 48 cases (53%) the opposite was true. This means the F-IAM fee is not aligned with the CMT of each examination performed in the HCM. Therefore, even though the total cost is similar to the total income for examination services, it seems essential to update the F-IAM fee for labora-tory costs and services. These results are consistent with those reported by the literature in terms of aligning the variables F-IAM fee and cost in order to facilitate the financial evaluation processes and the application of financial policies and prices in health centers(13). With respect to the costs reported by the
literature(12) it is difficult to make comparisons if the costs are
not previously adjusted by variables like complexity and num-ber of services in each laboratory(13).
At the aggregate level, this means that the F-IAM fee must reflect the true production cost of each examination, and to do this it is essential that the LC constantly update the CMT. It is also very important for FONASA to keep the F-IAM updated in terms of the production costs of hospital clinical laboratories in Chile. Thus, the main implication of this work is that the value returned to the public institutions who render labora-tory services does not reflect the true total average production costs of examinations.
Limitations of the study
The first limitation of the study is considered to be not having a measure of dispersion with respect to the cost of each type of examination within each group. This is because the procedure used was to estimate the total cost of producing each type of ex-amination and then to divide it by the number of exex-aminations of each type. Therefore, our cost estimations represent the aver-age cost of producing a type of examination, with the possibility of a certain level of dispersion. We cannot know this dispersion because we did not record the cost of producing each examina-tion of the same type in order to calculate the average (and the dispersion) of all the examinations of each type.
The second limitation of the study is the difficulty in valu-ing the assets, such as main equipment, laboratory support equipment, infrastructure and furniture. This is because in Chile procedures have been implemented to improve, among others aspects, the accounting and presentation of fixed assets in the financial statements of State organizations in general, and of public hospitals in particular. This means that hospitals
must have a methodology to review their procedures on mov-able and immovmov-able property, facilitating convergence to-wards the International Public Sector Accounting Standards (IPSAS) that came into force in 2016.
Contributions of the study
It is estimated that the main contribution of the study refers to the scope of public health policy. This means that the financ-ing of health systems and services must be based on the correct estimation of the production costs of these systems and servic-es, so as to converge towards an optimal (or better) allocation of the limited resources available in the health sector.
CONCLUSION
The main conclusion of this work is that the value, or ser-vice fee, returned to public institutions who perform labora-tory services does not adequately reflect the true total average production costs of examinations.
REFERENCES
1. Barral M. La gestión integrada y la dinámica de sistemas: criterios a aplicar en los laboratorios clínicos. Acta Bioquím Clín Latinoam [Internet]. 2007 [cited 2017 Feb 13];41(3):407-18. Available from: http://www.scielo.org.ar/pdf/abcl/v41n3/v41n3a16.pdf
2. Young DS, Sachais BS, Jefferies LC. Laboratory cost in the context of disease. Clin Chem. 2000;46(7)967-75.
3. Caballé M. La necesidad de asignar costes en el laboratorio clínico. Quím Clín. 2004[cited 2017 Feb 23];23(6)423-8. Available from: http://www.seqc.es/download/revista/63/305/182414725/1024/cms/QC_2004_423-428.pdf/
4. Gutiérrez CG, Medina A. Comparación de los costos reales anuales asociados al manejo ambulatorio de pacientes hipertensos del programa cardiovascular en el hospital comunitario de Bulnes con el pago de prestaciones Fonasa. Rev Chil Cardiol [Internet]. 2011[cited 2017 Feb 13];30(3):207-11. Available from: http://dx.doi.org/10.4067/S0718-85602011000300003
5. Lenz-Alcayaga R. Análisis de costos en evaluaciones económicas en salud: aspectos introductorios. Rev Med Chile [Internet]. 2010[cited 2017 Feb 13];138(Suppl-2):88-92. Available from: http://dx.doi.org/10.4067/S0034-98872010001000006
6. Pérez JA, Fernández E. El sistema de costes y el laboratorio clínico. Ed Cont Lab Clín. 2005;8:33-8.
7. Travers EM, Delahunty DC, Hunter LL, McClatchey KD, Rudar JM. Basic cost accounting for clinical services, approved guideline. NCCLS document GP11-A. ISBN 1-56238-356-6. Wayne, Pennsylvania: NCCLS; 1998.
8. Ávila L, Hernández P, Cruz A, Zurita B, Terres AM, Cruz C. Análisis de productividad, calidad y costos en laboratorios del primer nivel: la biometría hemática. Rev Saúde Pública [Internet]. 1999[cited 2017 Feb 14];33(2):163-70. Available from: http://dx.doi. org/10.1590/S0034-89101999000200008
9. Alvear S, Canteros J, Jara J, Rodríguez P. Costos reales de tratamientos intensivos por paciente y día cama. Rev Med Chile [Internet]. 2013[cited 2017 Feb 13];141(2):202-8. Available from: http://dx.doi.org/10.4067/S0034-98872013000200009 10. Alvear S, Canteros J, Jara J, Rodríguez P. Costeo basado en actividades: una metodología de gestión en tratamientos
intensivos. Rev Med Chile [Internet]. 2013[cited 2017 Feb 13];141(11):1371-81. Available from: http://dx.doi.org/10.4067/ S0034-98872013001100002
11. Santelices E, Ormeño H, Delgado M, Lui C, Valdés R, Durán L. Análisis de los determinantes de la eficiencia hospitalaria: el caso de Chile. Rev Méd Chile [Internet]. 2013[cited 2017 Apr 04];141(4):457-63. Available from: http://dx.doi.org/10.4067/ S0034-98872013000400006
12. Brealey RA, Myers SC, Marcus AJ. Fundamentos de finanzas corporativas. Cuarta Edición. Colombia: McGraw-Hill; 2004. 13. FONASA. Fondo Nacional de Salud. Informe final estudio de costos prestaciones de salud, laboratorio e imagenología. Versión
1.1 del 28 de Diciembre año 2016[Internet]. Sub-departamento de Plan de Beneficios. 2016 [cited 2017 Apr 04]. Available from: https://www.fonasa.cl/sites/fonasa/adjuntos/Informe_Final_Estudio_Costos_1