Artigo
Brazilian Journal of Pharmacognosy18(3): 360-366, Jul./Set. 2008 Received 16 March 2008; Accepted 22 August 2008
A proposal for the quality control of
Tanacetum parthenium
(feverfew) and its hydroalcoholic extract
Juliana Siqueira Chaves, Fernando Batista Da Costa*
Universidade de São Paulo, Faculdade de Ciências Farmacêuticas de Ribeirão Preto, Departamento de Ciências Farmacêuticas, Laboratório de Farmacognosia, 14040-903
Ribeirão Preto-SP, Brazil
RESUMO. “Uma proposta para o controle de qualidade de Tanacetum parthenium (tanaceto) e seu extrato hidroalcoólico”. Neste trabalho, é apresentada uma proposta para o controle de qualidade físico e químico do pó de T. parthenium (tanaceto) e do seu extrato hidroalcoólico obtido por percolação. A lactona sesquiterpênica partenolídeo, o principal componente ativo da espécie, foi quantifi cada por CLAE e seu teor foi de 0,49% no pó e 1,06% no extrato. O teor de
fl avonóides totais foi determinado por espectroscopia no UV e foi de 0,54% no pó e 1,05% no extrato hidroalcoólico. A santina, principal fl avonóide da espécie, foi isolada e posteriormente identifi cada no extrato por CLAE. Uma vez que o partenolídeo também pode ser encontrado em outras espécies de Asteraceae, a análise da santina é importante para certifi car a autenticidade do material vegetal. Os resultados obtidos neste trabalho confi rmam a autenticidade do material e a efi ciência do processo extrativo.
Unitermos:Tanacetum parthenium, Asteraceae, controle de qualidade, quantifi cação por CLAE, extrato hidroalcoólico, fl avonóides, partenolídeo.
ABSTRACT: In this study, we present a proposal for the physical and chemical quality control of the powder of the species T. parthenium (feverfew) and its hydroalcoholic extract obtained by percolation. The sesquiterpene lactone parthenolide, the main active compound of this plant, was quantifi ed by HPLC and its content was found to be 0.49% in the powder and 1.06% in the extract. The total content of fl avonoids, determined by UV spectroscopy, was found to be 0.54% in the powder and 1.05% in the hydroalcoholic extract. Santin, the main fl avonoid of this species, was isolated and further identifi ed in the extract by HPLC. Since parthenolide can also be found in other Asteraceae species, the analysis of santin is important to certify the authenticity of the plant material. The results confi rmed the authenticity of the plant material and the effi ciency of the extraction procedure.
Keywords: Tanacetum parthenium, Asteraceae, quality control, HPLC quantifi cation, hydroalcoholic extract, fl avonoids, parthenolide.
INTRODUCTION
Tanacetum parthenium (L.) Schultz Bip.
(Asteraceae) is known in folk medicine as feverfew. This species has been recognized since ancient times as a medicine against a wide range of diseases such as rheumatism, asthma, toothache, and for the alleviation of the “holy fi re”, fever and mainly migraine (Knight, 1995; Oliveira et al., 2007; Carvalho et al., 2008). Since the time of Dioscorides (50 B.C.), feverfew has been used in the prevention of migraine, through the Middle Ages up to the present (Palevitch et al., 1997).
Phytochemical studies carried out with this species have shown the presence of many constituents, mainly sesquiterpene lactones, and also some fl avonoids. The sesquiterpene lactone parthenolide is the major compound and the chemical marker of T. parthenium
(Knight, 1995).
The commonly used feverfew extracts trigger the release of serotonin (5-HT) from platelets, thus inducing a wide variety of aggregation agents (Pfaffenrath et al.,2002). The effi cacy of the extract in migraine prophylaxis was also assessed in randomized, placebo-controlled, double-blind and cross-over clinical studies (Gruenwald et al., 2000).
Pharmacological investigations of feverfew and parthenolide have demonstrated that both present anti-inflammatory effect through the inhibition of eicosanoids and the transcription factor nuclear factor kappa-B (NF-NB) (Gruenwald et al., 2000; Garcia-Piñeres et al., 2001; 2004). Further studies revealed that fl avonoids such as santin are also important anti-infl ammatory constituents of the species (Long et al., 2003; Williams et al., 1999).
361 Rev. Bras. Farmacogn.
investigations, a study describing the standardization of its hydroalcoholic extract including fl avonoid analysis and parthenolide quantifi cation is still lacking. Therefore we propose herein a methodology for the quality control of the powder and the hydroalcoholic extract of T. parthenium taking into account the parthenolide and fl avonoid contents.
MATERIAL AND METHODS
Chemicals
Organic solvents for HPLC analyses (Mallinckrodt Baker, Phillipsburg, NJ, USA) were fi ltered through 0.45 ȝm cellulose membranes prior to use. Water was processed in a Millipore, Milli-Q purifi er (Millipore, Bedford, MA, USA). Organic solvents for the other analyses were of analytical grade (Merck or Synth, Brazil). The reagents H2SO4, HCl, AlCl3, AcOH and fructose were obtained from Merck (Brazil). Parthenolide was purchased from Sigma-Aldrich (Steihem, Germany).
General experimental procedures
The identity of santin was established by
1H NMR (Bruker DRX 400 spectrometer, 400 MHz,
Germany). Flavonoids were quantifi ed in a Hewlett Packard UV-Vis Spectrophotometer, (Kayak, XA, USA), and IR spectra obtained in a Nicolet Protégé 460 spectrophotometer (France).
The HPLC equipment used in the parthenolide quantification consisted of a SLC 10Avp liquid chromatograph (Shimadzu Corp., Japan) with a SPD-M10A diode array detector (DAD), three pumps (LC-10AD), an integration software (Class vp, v. 5.02) and an analytical column Nucleosil 100-5 RP-18, 4.6 x 250 mm, 5 m, 100 Å (Macherey & Nagel, Durin, Germany). The HPLC system employed in the analysis of santin was identical to the above, but equipped with two pumps only (LC-6AD), a column oven (CTO-10ASVP) and an analytical column Nucleosil 300-5 RP 18, 4.6 x 250 mm, 5 m, 300 Å (Macherey & Nagel, Durin, Germany).
Plant material
The powder from the aerial parts of T. parthenium
was purchased from Galilee Herbal Remedies (Kibbutz Kfar Hanassi, Israel).
Characterization of theT. parthenium powder
Powderfi neness, total ash, acid insoluble ash, swelling index and moisture content: these assays were performed according to the standard methods described in the WHO guidance (Word Health Organization,
1988).
Extraction, isolation and identifi cation of santin
Extraction of the T. parthenium powder (200 g) using Me2CO was proceeded through sonication for 15 min. This procedure was repeated two more times and the resulting solvent was evaporated at reduced pressure. The crude extract (8 g) obtained was submitted to vacuum liquid chromatography (VLC) with silica gel 60H (100-200 mesh ASTM, Merck, Brazil), using n -hexane and increasing amounts of EtOAc and MeOH as eluents, yielding seven fractions. Fraction 3 (0.98 g) was chromatographed again by VLC using the same solvent system described above. Fraction 1 (0.74 g) was purifi ed by “fl ash” chromatography using silica gel 60 (230-400 mesh ASTM, Merck, Brazil) as adsorbent. Elution (isocratic) was made with n-hexane:CH2Cl2:2-propanol 8.0:1.5:0.5 and yielded 28 fractions. Fractions 19-28 (88 mg) were combined and purifi ed by crystallization from
n-hexane:MeOH, resulting in 18 mg of pure santin. The structure of the fl avonoid (Figure 1) was established by comparison of its 1H NMR spectral data with those
reported in the literature (Williams et al., 1999).
Quantifi cation of total fl avonoids by UV spectroscopy
The determination of total fl avonoids was carried out by UV spectroscopy according to the German Pharmacopoeia (Bundesvereinigung, 1986). The method is based on the use of reagents such as hexamethylenetetramine and AlCl3, which ionize phenolic groups and form acid complexes, thus changing the shapes and shifting the absorption peaks of the fl avonoids in the spectrum (Mabry et al., 1970).
Quantifi cation of parthenolide by HPLC
The parthenolide (Figure 2) content was assessed by an adaptation of the method described by Zhou et al. (1999) with the aid of a calibration curve.
Stock solutions: pure parthenolide (5.0 mg) was placed in a volumetric fl ask and the volume was completed to 5 mL with MeCN. Standard solutions with concentrations of 1, 2, 10, 50, 100, 250, 500, and 750 Pg/ mL were prepared from the parthenolide stock solution (1 mg/mL) by means of serial dilution with MeCN.
Preparation of sample for analysis: 150
were submitted to HPLC in triplicate. A mobile phase consisting of a mixture of MeCN-H2O 45:55 was used for the elution, run at a fl ow rate of 1.0 mL/min and UV detection at 210 nm.
Method validation. (a) Calibration curve and linearity: a calibration curve was constructed with standard parthenolide solutions in the concentration range of 1 to 750 Pg/mL. Injection volumes were 20 PL. Each sample was analyzed in triplicate and the average detector responses were used to construct the curve (Brasil, 2002). (b) Precision and accuracy: three standard solutions in three concentration levels (50, 250 and 750Pg/mL) in 10 replicates were employed to observe the standard deviation of the method in the same day (intra-assay precision). For inter-assay precision, a 250
Pg/mL standard solution was analyzed in 10 replicates during three days. The accuracy was obtained for those three nominal concentrations of parthenolide (50, 250 and 750 Pg/mL) performed in quintuplicate (Brasil, 2002). (c) Specifi city: the purity of the parthenolide samples was checked by analyzing the peaks from the chromatogram using DAD (Abourashed and Khan, 2000).(d) Detection limit (DL) and quantifi cation limit (QL): the standard solution (1 Pg/mL) was injected three times and the signal height and baseline noises were averaged as follows: DL = 3 x signal height x standard amount/baseline noise, and QL = 10 x signal height x standard amount/baseline noise (Brasil, 2002).
Preparation and characterization of the hydroalcoholic extract
The extract was obtained by percolation of the
T. parthenium powder in 70% ethanol according to the German Pharmacopoeia specifi cations, as described by Schmidt and List (1989). Two parts of the extract were obtained from one part of the powder. This process was performed in three steps: 1) pre-swelling, for 2 h with a 1:3 liquid to powder proportion; 2) intermediate maceration (24 h); 3) percolation (4-6 drops/min per 100 g of powder).
Characterization of the hydroalcoholic extract
Loss on drying: performed according to
the German Pharmacopoeia (Hartke and Mutschler, 1987). Density, pH, and alcohol determinations: performed according to the Brazilian Pharmacopoeia (Farmacopéia Brasileira, 1977). Total fl avonoids: the quantifi cation of total fl avonoids was carried out by UV spectroscopy according to the German Pharmacopoeia (Bundesvereinigung, 1986). TLC analysis: samples were eluted with C6H6-Me2CO 9:1 in glass plates coated with 0.25 mm of silica gel 60 GF254 (Merck, Brazil); the reagent used for the detection of spots was a 1% MeOH solution of fructose with 2% H2SO4 1:1; the plates were kept during 2-4 min at 110 oC until the appearance of
colored spots (Drozdz and Bloszyk, 1978); the retention times of the spots were compared to that of a parthenolide standard.Qualitative analysis of santin: the qualitative analysis of santin in the T. parthenium extract as well as the sample preparation were carried out according to a method described for HPLC analysis of fl avonoids in Passifl ora species (Pereira et al., 2004). Santin was suspended in 1 mL of MeOH 60% (1 mg/mL), fi ltered through a 0.45 m nylon membrane (Sartorius, Spain) and directly injected into the HPLC system. Injection volumes were 50 PL.Parthenolide content: see above. RESULTS AND DISCUSSION
Validation of the HPLC method
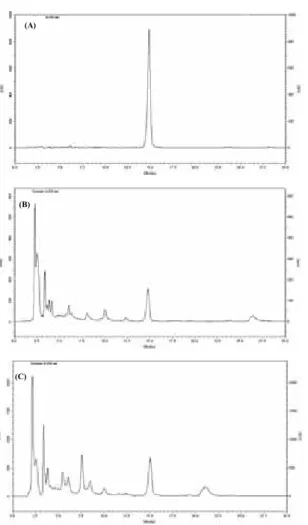
The adaptation of the HPLC method for parthenolide quantifi cation was made in order to improve the specifi city of the parthenolide peak. The method used is fast (run time = 15 min, Fig. 3) and simple (isocratic elution). The time of analysis is an important factor in analytical work since it optimizes equipment use and reduces solvent consumption.
A previous study (Zhou et al., 1999) showed that 30 min stirring in MeCN-H2O 9:1 is the best system for extracting parthenolide. The calibration curve showed good linearity (R2 = 0.9994) in the concentration range
tested. The regression equation was y = 2.10-5x - 5.8839.
The percentages of relative standard deviation (RSD) were 0.23 to 3.7 %.
Analyses of UV spectra collected at the beginning, in the middle and at the end of the parthenolide peak showed that the method presents specifi city.
The limit of quantifi cation was 0.07 Pg and the limit of detection was 0.02 Pg. The method resulted in acceptable intra and inter-assay precision (Tables 1 and 2) since the % RSD ranged from 0.34 to 4.1 % for the intra-assay and 0.34 to 2.19 % for the inter-assay tests. The accuracy ranged from 94.09 to 99.99% and is shown in Table 3. These results are in agreement with literature data (Brasil, 2002; Causon, 1997) and show that the method and sample extraction are reproducible. Characterization of the T. parthenium powder and hydroalcoholic extract
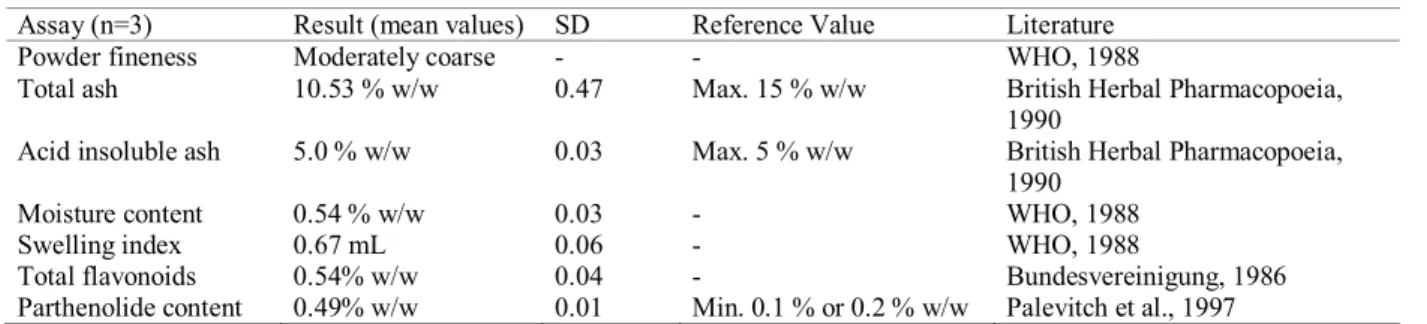
Several techniques used in this study have already been described in the guidelines of World Health Organization (WHO, 1998) and pharmacopoeias (Farmacopéia Brasileira, 1977) and are essential to ensure authenticity, safety and stability of the plant material and its preparations. Nevertheless, a publication containing a compilation of all these specifi cations for
T. parthenium (Table 4) was not yet available.
The low water content in the T. parthenium
363 Rev. Bras. Farmacogn.
Table 1. Intra-assay precision of standard parthenolide for three nominal concentrations (50.0, 250.0 and 750.0 ȝg/mL, n=10).
SD = standard deviation; % RSD = relative standard deviation.
Table 2. Inter-assay precision of standard parthenolide for one nominal concentration (250.0 ȝg/mL, n=10) during three days.
values are in accordance with literature specifi cations and indicate low content of inorganic and silicon contaminants (WHO, 1998). The presence of santin (Fig. 1), parthenolide (Table 4, Fig. 2) and total fl avonoids (Table 4) confi rm the authenticity of the plant material. All results are acceptable since RSD values were lower than 10%.
The effi ciency of the extraction process is infl uenced by the powder fi neness (Table 4), and the swelling index assay (Table 4) shows the extra-amount of solvent that should be added in the extraction (Schmidt
and List, 1989).
The hydroalcoholic extract was obtained by percolation since it is a dynamic and continuous method and is more effi cient than maceration (Prista and Alves, 1967). Losses on drying, density, IR and TLC analyses (Table 4) were used to control the extraction procedures.
The UV-visible absorption spectroscopy technique, which was based on the German Pharmacopoeia, allowed the quantifi cation of total fl avonoids in the powder and also in the hydroalcoholic extract (Tables 4 and 5).
The result of IR spectroscopic analysis (Table 5) also indicates that the extraction procedure was effi cient for parthenolide and fl avonoids, which are the most important active compounds of feverfew (Gruenwald et al., 2000).
Several studies suggest that parthenolide, which is thought to be the most active component of
T. parthenium, should be used as a chemical marker to characterize T. parthenium. However, parthenolide has also been reported in other Asteraceae species such as the German chamomile [Matricaria recutita (L.) Rausch.] and tansy (Tanacetum vulgare L.). Both drugs are sometimes incorrectly supplied as feverfew (Smith and Burford, 1993). Therefore, the identifi cation of santin by HPLC as well as quantifi cation of parthenolide as proposed herein are very useful parameters to characterizeT. parthenium unequivocally.
The results also showed that the use of hydroalcoholic extracts is more advantageous than the use of the crude powder in order to obtain plant-derived products or phytomedicines containing higher amounts of active compounds such as parthenolide and fl avonoids. As demonstrated in the present study, these compounds can be easily analyzed by different qualitative and/or quantitative methods. Although the use of hydroalcoholic extracts is strongly recommended, most of the T. parthenium-derived products sold by several pharmaceutical companies and pharmacies are in form of capsules that simply store the powder of the aerial parts of this plant.
In conclusion, a reliable methodology for the quality control of the powder and the hydroalcoholic extract of T. parthenium is now reported. It takes into
Replicates Standard Solution (μg/mL)
50.0 250.0 750.0
1 48.19 238.92 735.51
2 47.01 238.94 729.95
3 47.52 239.61 723.39
4 46.38 240.72 738.09
5 47.05 240.43 742.94
6 42.29 240.75 711.73
7 44.52 239.57 696.51
8 48.86 239.54 705.71
9 46.68 240.19 727.22
10 47.23 241.41 733.98
mean 46.57 240.01 724.50
SD 1.890 0.825 15.18
% RSD 4.06 0.34 2.10
Replicates Standard Solution (μg/mL)
Day 1 Day 2 Day 3
1 238.92 249.39 256.55
2 238.94 252.73 252.89
3 239.61 250.81 252.02
4 240.72 250.05 251.46
5 240.43 250.95 251.05
6 240.75 256.38 239.72
7 239.57 247.75 240.29
8 239.54 249.83 249.98
9 240.19 249.60 251.63
10 241.41 250.77 252.79
Mean 240.01 250.62 249.84
SD 0.825 2.336 5.463
% RSD 0.34 0.96 2.19
O O O
Figure 2. Chemical structure of the sesquiterpene lactone parthenolide.
M e O
O M e
O M e O
H O
O H O
(A)
(B)
(C)
(A)
(B)
Table 3. Determination of accuracy for three nominal concentrations (50.0, 250.0 and 750.0 ȝg/mL, n=5) of standard parthenolide.
Figure 3. HPLC/DAD traces of parthenolide, mAU x time (min): (A) parthenolide; (B) T. parthenium powder; (C) hydroalcoholic extract of T. parthenium. Mobile phase: MeCN-H2O 45: 55; fl ow-rate 1 mL/min; UV detection at 210 nm.
Figure 4. HPLC/DAD traces of santin, mAU x time (min): (A) santin; (B) hydroalcoholic extract of T. parthenium. Mobile phase: solvent A (2% formic acid in H2O), solvent B (MeCN); gradient elution 0-10 min 15% B in A, 10-40 min 15-30% B in A, and 40-50 min 30-15% B in A; fl ow-rate 0.8 mL/min; UV detection at 241 nm.
Nominal Values (μg/mL)
True values (μg/mL)
Accuracy Statistic Analysis for the HPLC Accuracy
Mean SD % RSD
50.0
49.61 99.21
97.71 1.399 1.43
47.93 95.87 49.27 98.54 49.15 98.31 48.32 96.64
250.0
249.83 99.93
99.99 0.529 0.53
247.75 99.10 250.62 100.25 250.77 100.31 250.95 100.38
750.0
696.18 92.82
94.09 1.034 1.10
365 Rev. Bras. Farmacogn.
Assay (n=3) Result (mean values) SD Reference Value Literature
Powder fineness Moderately coarse - - WHO, 1988
Total ash 10.53 % w/w 0.47 Max. 15 % w/w British Herbal Pharmacopoeia,
1990
Acid insoluble ash 5.0 % w/w 0.03 Max. 5 % w/w British Herbal Pharmacopoeia,
1990
Moisture content 0.54 % w/w 0.03 - WHO, 1988
Swelling index 0.67 mL 0.06 - WHO, 1988
Total flavonoids 0.54% w/w 0.04 - Bundesvereinigung, 1986
Parthenolide content 0.49% w/w 0.01 Min. 0.1 % or 0.2 % w/w Palevitch et al., 1997
Assay (n=3) Result (mean values) SD Reference
Value
Literature
pH 5.91 0.02 - Farmacopéia Brasileira, 1977
Density 0.9331 g/mL 0.002 - Farmacopéia Brasileira, 1977
Alcohol content 51 % v/v 0.04 - Farmacopéia Brasileira, 1977
Loss on drying 10.82%.w/w 0.15 - Hartke and Mutschler, 1987
Total flavonoids 1.05 %. w/w 0.10 - Bundesvereinigung, 1986
IR spectroscopy -OH stretch (3378 cm-1), -CH (2929
- 2862 cm-1), C=O of γ-lactone ring
(1762 cm-1), C=C (1654 - 1606 cm
-1
) and C=C of aromatic rings (1509 -
1447 cm-1)
- - Silverstein et al., 2005
TLC analysis for parthenolide
Rfa = 0.49 cm - Rf= 0.49 cm Drozdz and Bloszyk, 1978
Parthenolide content 1.06 % w/w 0.006 minimum
0.1 % or 0.2 % w/w
Palevitch et al., 1997
Table 4. Physical and chemical properties of the T. parthenium powder.
Table 5. Characterization of the hydroalcoholic extract of T. parthenium.
aR
f: resolution factor = height of mobile phase/height of sample. account published data, international regulatory demands and governmental guidelines. This methodology may be used as a model by academic researchers as well as pharmaceutical companies for quality control purposes. Once it is properly adapted, it may be applied to other medicinal plants and their extracts.
ACKNOWLEDGMENTS
This work was supported by FAPESP. The authors are grateful to Prof. I. Merfort (Institut für Pharmazeutische Wissenschaften, Lehrstuhl für Pharmazeutische Biologie und Biotechnologie, Albert-Ludwigs-Universität Freiburg, Freiburg i.Br., Germany) for kindly providing a sample of parthenolide. We also thank Mrs. Paula C. P. Bueno (Universidade de São Paulo, Faculdade de Ciências Farmacêuticas de Ribeirão Preto) for discussions and valuable suggestions. REFERENCES
Abourashed EA, Khan IA 2000. Determination of
parthenolide in selected feverfew products by liquid chromatography. J AOAC 4: 789-792.
Brasil 2002. Agência Nacional de Vigilância Sanitária. Guia para validação de métodos analíticos. DOU 20/03/2002: Resolução - RE no 475, 19 de março de
2002: Brasília.
British Herbal Pharmacopoeia 1990. 1st ed. Vol 1. British Herbal
Medicine Association. Bournemouth: Dorset.
Bundesvereinigung Deutscher Apothekervebände (Hgrs) 1986. .Deutscher Arzneimittel-Codex 2. Frankfurt, Govi, Stuttgart, p.1-3.
Carvalho ACB, Balbino EE, Maciel A, Perfeito JPS 2008. Situação do registro de medicamentos fi toterápicos no Brasil. Rev Bras Farmacogn 18: 314-319. Causon R 1997. Validation of chromatographic methods in
biomedical analysis: viewpoint and discussion. J Chrom B: Biom Applic 689: 175-180.
Drozdz B, Bloszyk E 1978. Selective detection of sesquiterpene lactones by TLC. Planta Med 33: 379-384.
Farmacopéia Brasileira 1977. 3rd ed. Andrei: São Paulo.
39713-39720.
Garcia-Piñeres AJ, Lindenmeyer, MT, Merfort, I 2004. Role of cysteine residues of p65/ NF-NB on the inhibition by the sesquiterpene lactone parthenolide and N-ethyl maleimide, and on its transactiving potential. Life Sci 75: 841-856.
Gruenwald J, Brendler T, Jaenicke C 2000. PDR for Herbal Medicines, 2nd ed. Medical Economics Company:
Montvale, New Jersey; 306-309.
Hartke K, Mutschler E 1987. Deutsches Arzneibuch - 9. Augabe 1986, Kommentar, 305-306: Stuttgart: Wissenschaftliche.
Knight DW 1995. Feverfew: chemistry and biological activity.
Nat Prod Rep 12: 271-276.
Long C, Sauleau P, David B, Lavaud C, Cassabois V, Ausseil F, Massiot G 2003. Bioactive fl avonoids of Tanacetum partheniumrevisited.Phytochemistry 64: 567-569. Mabry TJ, Markham KR, Thomas MB 1970. The Systematics
Identifi cation of Flavonoids, 1st ed. Springer-Verlag:
New York.
Oliveira FQ, Gobira B, Guimarães C, Batista J, Barreto M, Souza M 2007. Espécies vegetais indicadas na odontologia.Rev Bras Farmacogn 17: 466-476. Palevitch D, Earon G, Carasso R 1997. Feverfew (Tanacetum
parthenium) as a prophylactic treatment for migraine: a double-blind placebo-controlled study. Phytother Res 11: 508-511.
Pereira CAM, Yariwake JH, Lanças FM, Wauters J, Tits M, Angenot LA 2004. HPTLC densitometric determination of fl avonoids from Passifl ora alata,P. edulis,P. incarnata andP. caerulea and comparison with HPLC method. Phytochem Anal 15: 241-248. Pfaffenrath V, Diener HC, Fischer M, Friede M, Zepelin
HHH 2002. The effi cacy and safety of Tanacetum parthenium (feverfew) in migraine prophylaxis - a double-blind, multicentre, randomized placebo-controlled dose-response study. Cephalalgia 22: 523-532.
Prista LN, Alves AC 1967. Técnica Farmacêutica e Farmácia Galênica, 1st ed. Fundação Calouste Gulbenkian:
Lisboa.
Silverstein RM, Webster FX, Kiemle D 2005. Spectrometric Identifi cation of Organic Compounds, 7th ed. John
Wiley & Sons Inc: New York.
Schmidt PC, List PH 1989. Phytopharmaceutical Technology, 1st ed. Boca Raton: CRC Press, Boston.
Smith R, Burford MD 1993. Comparison of fl avonoids in feverfew varieties and related species by principal components analysis. Chemometr Intell Lab Syst 18: 285 - 291.
Williams CA, Harbone JB, Geiger H, Hoult JRS 1999. The fl avonoids of Tanacetum parthenium and T. vulgare and their anti-infl ammatory properties.
Phytochemistry 51: 417-423.
World Health Organization 1998. Quality Control for Medicinal Plants Material. Geneva: 53-61.
Zhou JZ, Kou X, Stevenson D 1999. Rapid extractions and high-performance liquid chromatographic determination of parthenolide in feverfew (Tanacetum parthenium).