337
Evaluation of abdominal fat in rats under hyperlipidic diet
Radiol Bras 2007;40(5):337–340
Original Article
COMPUTED TOMOGRAPHY IN THE EVALUATION OF ABDOMINAL
FAT DISTRIBUTION ASSOCIATED WITH A HYPERLIPIDIC DIET
IN PREVIOUSLY UNDERNOURISHED RATS*
Carlos Alberto Soares da Costa1
, Erika Gomes Alves2
, Gabriele Paula Gonzalez2
, Thais Barcellos Côrtez Barbosa2
, Veronica Demarco Lima2
, Renata Nascimento2
, Alexandra Maria Vieira Monteiro3
, Egberto Gaspar de Moura4
, Celly Cristina Alves do Nascimento Saba5
OBJECTIVE: To study, by means of computed tomography, the repercussion of post-weaning dietary supple-mentation with soy oil or canola oil on the abdominal fat distribution in previously undernourished rats. MA-TERIALS AND METHODS: Dams submitted to 50% food restriction (FR) compared with dams receiving a standard diet (C). After weaning, undernourished rats received a diet supplemented with 19% soy oil (19% FR-soy) or 19% canola oil (19% FR-canola). Rats in the control group received a diet with 7% soy oil (7% C-soy) until the end of the experimental period. At the age of 60 days old, the rats were submitted to com-puted tomography for evaluation of total abdominal and visceral fat area. The rats’ length and body mass were evaluated and, after their sacrifice, the abdominal fat depots were excised weighted. The data are reported as mean ± mean standard error, with p < 0.05 considered as significance level. RESULTS: Rats in the group 19% FR presented similar length, body weight and visceral fat mass. As a whole, the evalua-tions have shower results significantly lower in relation to the control group (7% C-soy). However, com-puted tomography has found significant differences in abdominal fat distribution for the groups 19% FR-soy and 19% FR-canola. CONCLUSION: Computed tomography has demonstrated that the abdominal fat distri-bution may be dependent on the type of vegetable oil included in the diet.
Keywords: Computed tomography; Abdominal fat tissue; Malnutrition; Soy oil; Canola oil; Rats.
Tomografia computadorizada na avaliação da distribuição do tecido adiposo abdominal de ratos alimentados com rações hiperlipídicas após desnutrição neonatal.
OBJETIVO: Descrever repercussões da ração suplementada com óleo de soja ou óleo de canola, por meio da tomografia computadorizada, na distribuição do tecido adiposo abdominal, após desmame de ratos desnutri-dos durante a lactação. MATERIAIS E MÉTODOS: Ratas lactantes submetidas a restrição alimentar (RA) em 50%, de acordo com o consumo das lactantes controles (C). Após o desmame, filhotes desnutridos receberam ração contendo 19% de óleo de soja (RA-soja 19%) ou óleo de canola (RA-canola 19%). Os filhotes do grupo controle receberam ração contendo 7% de óleo de soja (C-soja 7%). Aos 60 dias de idade, foram realizadas medidas corporais e das áreas de tecido adiposo abdominal por meio de tomografia computadorizada. Após sacrifício, tecido adiposo abdominal foi excisado e pesado. Os dados foram expressos como média ± erro-padrão da média, considerando o nível de significância de p < 0,05. RESULTADOS: Os grupos RA 19% de-senvolveram similares comprimento, massa corporal e depósito de tecido adiposo visceral. Todas as avalia-ções realizadas foram significantemente menores em relação ao grupo C-soja 7%. Entretanto, na tomografia computadorizada, os grupos RA-soja 19% e RA-canola 19% apresentaram diferenças significativas da dis-tribuição do tecido adiposo abdominal. CONCLUSÃO: A tomografia computadorizada mostrou que a distri-buição de tecido adiposo, na cavidade abdominal, pode ser dependente do tipo de óleo vegetal na dieta. Unitermos: Tomografia computadorizada; Tecido adiposo abdominal; Desnutrição; Óleo de soja; Óleo de canola; Ratos.
Abstract
Resumo
* Study developed in the Department of Physiological Scien-ces of Instituto de Biologia Roberto Alcântara Gomes (Ibrag), Centro Universitário de Controle do Câncer (CUCC), Hospital Universitário Pedro Ernesto da Universidade do Estado do Rio de Janeiro (UERJ), Rio de Janeiro, RJ, Brazil.
1. Fellow PhD degree, Program of Post-graduation in Clinical and Experimental Physiopathology at Faculdade de Ciências Médicas da Universidade do Estado do Rio de Janeiro (UERJ), Rio de Janeiro, RJ, Brazil.
2. Graduate Students, Course of Nutrition, Trainees of Scien-tific Initiation, Department of Physiological Sciences – Instituto de Biologia Roberto Alcântara Gomes (Ibrag) da Universidade do Estado do Rio de Janeiro (UERJ), Rio de Janeiro, RJ, Brazil.
3. PhD of Medicine, Associate Professor of Radiology, Cour-ses of Graduation and Post-graduation – Faculdade de Ciências
INTRODUCTION
The intra-abdominal fat tissue (bodily fat surrounding visceral organs) is associ-ated with adverse effects to the health, in-dependently from the amount of bodily fat(1,2). The high accumulation of fat tissue
in the intra-abdominal cavity is associated Médicas da Universidade do Estado do Rio de Janeiro (UERJ),
Rio de Janeiro, RJ, Brazil.
4. Post-doctorate, Titular Professor, Department of Physiolo-gical Sciences of Instituto de Biologia Roberto Alcântara Gomes (Ibrag) - Universidade do Estado do Rio de Janeiro (UERJ), Rio de Janeiro, RJ, Brazil.
5. PhD, Associate Professor, Department of Physiological Sciences of Instituto de Biologia Roberto Alcântara Gomes (Ibrag) - Universidade do Estado do Rio de Janeiro (UERJ), Rio de Ja-neiro, RJ, Brazil.
Mailing address: Profa. Dra. Celly Cristina Alves do Nascimento Saba. Departamento de Ciências Fisiológicas, 5º andar, Insti-tuto de Biologia, Universidade do Estado do Rio de Janeiro. Ave-nida 28 de Setembro, 87. Rio de Janeiro, RJ, 20551-030, Bra-zil. E-mail: [email protected].
338
Costa CAS et al.
Radiol Bras 2007;40(5):337–340 with hypertension, as reported by the
Afri-can AmeriAfri-can Ethnicity Study(3), and with
the risk for arteriosclerosis in non-obese Japanese individuals, i.e., with a normal body mass index (BMI)(4).
Obesity is a condition recognized as a public health issue affecting the adult population in the United States and world-wide, increasing the risk for chronic dis-eases and decrease in the life expect-ancy(5,6). Although obesity has an influence
on insulin resistance and diabetes mellitus, the rate of these metabolic alterations is high in the urban population in India where the individuals BMI is lower, and the waist/ hip ratio is higher than in the European population(1), demonstrating that the fat
tissue distribution within the abdominal region is as significant as is the BMI for the risk for metabolic disorders(4,7).
The presence of intra-abdominal fat tis-sue also has been observed in non-obese children and adolescents(2). Computed
to-mography (CT) studies have demonstrated that, independently from the abdominal, subcutaneous fat tissue deposition, the 1 cm²-annual increase in the area of visceral fat tissue is associated with an increase of approximately 5% in the blood levels of in-sulin at fasting in North American chil-dren(8).
The availability of in vivo imaging tech-niques has brought significant advantages for the study of the intra-abdominal fat tis-sue physiology(9). Abdominal CT is
consid-ered as the gold standard in the evaluation of the amount of subcutaneous and visceral fat tissue in this region(1,10). However, up
to the present moment, there is no scientific report on CT in the evaluation of abdomi-nal fat tissue following treatment for mal-nutrition in children. More than 50% of the mortality in children between 0 and 4 years of age is associated with malnutrition(11). In
the treatment for this condition, the avail-ability of a highly dense diet is frequently achieved with an increase in the dietary lipid content, especially with the addition of vegetal oils(12,13).
The present study was aimed at describ-ing, by means of CT, the repercussion of experimental post-weaning dietary supple-mentation with soy or canola oil on the ab-dominal fat distribution in previously un-dernourished rats.
MATERIALS AND METHODS
The sample of the present study in-cluded female Wistar rats. At three months of age, the animals were mated and, after that, were kept in cages with free access to water and food up to the litter birth.
On the litter birth date (day 0), the dams were divided into two groups: a) control (C; n = 2), fed with a commercial standard diet, ad libitum; b) group submitted to 50% food restriction (FR; n = 6), in comparison with the previous day´s diet given to the dams in group C. On the litter birth date, the lit-ters were reduced to six male rat pups/lit-ter to improve the lactation performance(14),
until the end of the lactation period (day 21). The utilization of male rat pups was aimed at avoiding the influence of female steroids cycle that may represent an addi-tional variable.
After the weaning, the undernourished animals received an AIN-93G-type puri-fied, hyperlipidic diet(15), supplemented
with 19 g of soy oil (FR-soy 19%; n = 12) or canola oil (FR-canola 19%; n = 12) and 49 g of saccharose / 100 g chow, while the animals in the control group received the same purified diet supplemented with 7 g of soy oil and 60 g of saccharose / 100 g chow (C-soy 7%; n = 12). The three diets included 20 g of casein as a major protein source / /100 g chow.
At 60 days of age, the rats were submit-ted to analysis of the fat tissue distribution by CT, with a GE HiSpeed helical model of the Unidade Docente-Assistencial de Radiologia, Centro Universitário de Con-trole do Câncer (CUCC/HUPE/UERJ), based on the protocol of helical acquisition, with axial 3 mm-thick slices, and 1.5 mm collimation. Measurements of intra-ab-dominal and intraperitoneal fat tissue thick-ness were performed, according to Yoshi-zumi et al.(10).
For the purpose of this procedure, the rats received anesthesia with sodic pento-barbital (Thiopentax®, Cristália) and
posi-tioned in ventral decubitus on the appara-tus table, according to the technique vali-dated for rats(16).
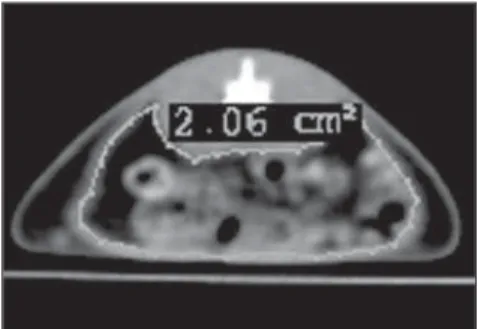
The images analysis was performed with the software DicomWorks v1.3.5(17),
by means of automatic calculation of the area in cm² of intra-abdominal and
intrap-eritoneal fat tissue, always in the same axial plane.The abdominal circumference (total area including visceral and subcutaneous fat tissues) and the intraperitoneal (vis-ceral) area were delineated with the cursor aiming at obtaining the area of intra-ab-dominal and intraperitoneal fat tissue(18)
(Figures 1 and 2).
Immediately after CT examination, with the rats still under the effect anesthesia, measurements of their bodily length (cm) and mass (g) were performed before their sacrifice by decapitation. The rat’s visceral fat was excised and weighted (absolute mass expressed in grams). Later, the abso-lute mass was adjusted in relation to the bodily mass (relative mass expressed in percentage of the absolute mass, divided by the bodily mass).
The present study was developed in compliance with the ethical principles for animal experimentations adopted by the Colégio Brasileiro de Experimentação Ani-mal (Cobea) (Brazilian College of AniAni-mal Experimentation), and approved by the ethical committee for care and use of ex-perimental animals of Instituto de Biologia
Figure 2. Measurement of the area of visceral fat tissue. CT of abdominal section of rats in ventral decubitus for measurement of the area of visceral fat tissue.
339
Evaluation of abdominal fat in rats under hyperlipidic diet
Radiol Bras 2007;40(5):337–340 Roberto Alcântara Gomes (Ibrag) – Univer-sidade do Estado do Rio de Janeiro (UERJ). The data collected were analyzed with the variance analysis method (Anova), and a post-test Newman-Keuls pairwise com-parison. All the results were expressed as mean ± mean standard error (MSE), con-sidering the significance level p < 0.05.
RESULTS
The animals’ evaluation following the experimental treatment demonstrated that both groups (FR-soy 19% and FR-canola 19%) achieved similar length and bodily mass recovery. As regards the absolute and relative mass of visceral fat tissue, none of the groups presented a significant differ-ence. As it may be observed on Table 1, all of the evaluations performed in groups FR-soy 19% and FR-canola 19% demonstrated significantly lower results in comparison with group C-soy 7%.
The analysis of CT images demonstrates that total and visceral areas of group FR-canola 19% were respectively 17% and 27% smaller as compared with group FR-soy 19% (Table 1).
DISCUSSION
During the experimental treatment for malnutrition, the reconstitution of the bodily fat tissue is influenced by the type of vegetal oil present in the hyperlipidic diet, the development of adipocytes in the different bodily compartments depend on the lipid source ingested(27,28). However, no
previous study has demonstrated by means of CT that, despite the similar amount of visceral fat tissue mass, the lipid sources utilized — soy e canola oil — resulted in a difference in the fat tissue distribution within the abdominal cavity. Additional researches are necessary to understand how the abdominal fat tissue distribution during the early physical development will affect the individual’s adult life.
With the undernourishment during the lactation, the animals, after the weaning, have not developed hyperfagia and, conse-quently, have not presented nutritional re-covery during the experimental treatment with the hyperlipidic diet. These results may supplement our previous results
dem-onstrating that, during neonatal undernour-ishment, there is a decrease in the total volume of mother’s milk, affecting the pro-cess of nutrients selection of the litter af-ter weaning(24–26). However, other studies
involving rats have shown that, in case of malnutrition during the gestation or after the lactation period, the animal can recover their bodily mass(19–23).
Several techniques for evaluating the abdominal fat tissue have been developed. Anthropometric measurements, like evalu-ation of cutaneous folds, circumference of several bodily segments and the waist/hip ratio constitute simple and useful indicators for evaluation of abdominal fat tissue depo-sition. However, not always these indices are accurate. The CT, as a method for mea-suring the fat tissue distribution, allows an appropriate differentiation between subcu-taneous and visceral fat tissues, which is unfeasible with conventional anthropomet-ric techniques(7). This technique has been
adopted for evaluation of the visceral fat tissue in adults(1) and in obese children(2).
CONCLUSION
The visceral fat tissue evaluation by CT is more accurate than anatomic measure-ments, allowing the distinction of the fat tissue distribution within the abdominal cavity, as a function of the type of vegetal oil utilized — soy or canola — following experimental treatment of undernourished rats during lactation
Acknowledgements
Dr. Rodolfo Acatauassu Nunes, Coor-dinator for the CUCC Implementation Commision; Professor Dr. Gilson Telles
Boa-Ventura, Coordinator for the Experi-mental Nutrition Laboratory at Faculdade de Nutrição – Universidade Federal Flumi-nense; Professor Dr. Eliete Bouskela, Head of the Ibrag Laboratory of Microcirculati-on – Universidade do Estado do Rio de Ja-neiro.
REFERENCES
1. Anjana M, Sandeep S, Deepa R, Vimaleswaran KS, Farooq S, Mohan V. Visceral and central abdominal fat and anthropometry in relation to diabetes in Asian Indians. Diabetes Care 2004;27: 2948–2953.
2. Goran MI. Measurement issues related to stud-ies of childhood obesity: assessment of body com-position, body fat distribution, physical activity, and food intake. Pediatrics 1998;101:505–518. 3. Ding J, Visser M, Kritchevsky SB, et al. The
as-sociation of regional fat depots with hypertension in older persons of white and African American ethnicity. Am J Hypertens 2004;17:971–976. 4. Miyawaki T, Abe M, Yahata K, Kajiyama N,
Katsuma H, Saito N. Contribution of visceral fat accumulation to the risk factors for atherosclero-sis in non-obese Japanese. Intern Med 2004;43: 1138–1144.
5. Pi-Sunyer FX. The obesity epidemic: pathophysi-ology and consequences of obesity. Obes Res 2002;10 Suppl 2:97–104.
6. James PT, Leach R, Kalamara E, Shayeghi M. The worldwide obesity epidemic. Obes Res 2001;9 (Suppl 4):S228–S233.
7. Yucel A, Degirmenci B, Acar M, Albayrak R, Haktanir A. The effect of fasting month of Rama-dan on the abdominal fat distribution: assessment by computed tomography. Tohoku J Exp Med 2004;204:179–187.
8. Huang TTK, Johnson MS, Gower BA, Goran MI. Effect of changes in fat distribution on the rates of change of insulin response in children. Obes Res 2002;10:978–984.
9. Goran MI, Kaskoun M, Shuman WP. Intra-ab-dominal adipose tissue in young children. Int J Obes 1995;19:279–283.
10. Yoshizumi T, Nakamura T, Yamane M, et al. Abdominal fat: standardized technique for mea-surement at CT. Radiology 1999;211:283–286. 11. Ashworth A. Treatment of severe malnutrition. J
Pediatr Gastroenterol Nutr 2001;32:526–518. 12. Bhan MK, Bhandari N, Bahl R. Management of
Table 1 Bodily composition and evaluation of abdominal fat tissue by computed tomography following treatment of neonatal malnutrition in rats..
Parameters evaluated
Bodily length (cm) Bodily mass (g)
Absolute mass of visceral fat tissue (g) Relative mass of visceral fat tissue (%) Total area of fat tissue (cm²) Area of visceral fat tissue (cm²)
C-soy 7%
39.13 ± 0.40* 242.30 ± 7.69* 9.21 ± 0.80* 3.45 ± 0.19* 4.07 ± 0.21* 1.99 ± 0.11*
RA-soy 19%
35.00 ± 0.31†
167.10 ± 4.74†
4.19 ± 0.43†
2.17 ± 0.25†
3.06 ± 0.09†
1.48 ± 0.06†
RA-canola 19%
33.75 ± 0.30†
148.70 ± 6.74†
3.14 ± 0.70†
1.76 ± 0.33†
2.52 ± 0.11‡
1.08 ± 0.03‡
340
Costa CAS et al.
Radiol Bras 2007;40(5):337–340 the severely malnourished child: perspective from
developing countries. BMJ 2003;326:146–151. 13. Lacerda EMA, Faria IG. Desnutrição energético-protéica na infância. In: Accioly E, Saunders C, Lacerda EMA. Nutrição em obstetrícia e pedia-tria. 1ª ed. Rio de Janeiro, RJ: Cultura Médica, 2002;444.
14. Fishbeck KL, Rasmussen K. Effect of repeated cycles on maternal nutritional status, lactational performance and litter growth in ad libitum-fed and chronically food-restricted rats. J Nutr 1987; 117:1967–1975.
15. Reeves PG. Components of the AIN-93 diets as improvements in the AIN-76A diet. J Nutr 1997; 127:838–841.
16. Ross R, Léger L, Guardo R, Guise JD, Pike BG. Adipose tissue volume measured by magnetic resonance imaging and computerized tomogra-phy in rats. J Appl Physiol 1991;70:2164–2172. 17. Pellegrinetti B, Magna LA. Sobre uma metodo-logia de apresentação de imagem médica. Radiol Bras 2004;37:211–213.
18. Spina LDC, Soares DV, Conceição FL, et al. Ava-liação do metabolismo glicídico e da gordura vis-ceral em adultos deficientes de hormônio de cres-cimento. Arq Bras Endocrinol Metab 2002;46: 536–543.
19. Dullo AG, Mensi N, Seydoux J, Girardier L. Dif-ferential effects of high-fat diets varying in fatty acid composition o the efficiency of lean and fat tissue deposition during weight recovery after low food intake. Metabolism 1995;44:273–279. 20. Shillabeer G, Lau DCW. Regulation of new fat cell
formation in rats: the role of dietary fats. J Lipid Res 1994;35:592–600.
21. Vicente LL, Moura EG, Lisboa PC, et al. Malnu-trition during lactation in rats is associated with higher expression of leptin receptor in the pitu-itary of adult offspring. Nutrition 2004;20:924– 928.
22. Passos MCF, Ramos CF, Dutra SCP, Mouço T, Moura EG. Long-term effects of malnutrition during lactation on the thyroid function of off-spring. Horm Metab Res 2002;34:40–43.
23. Passos MCF, Ramos CF, Teixeira CV, Moura EG. Comportamento alimentar de ratos adultos sub-metidos à restrição protéica cujas mães sofreram desnutrição durante a lactação. Rev Nutr Campi-nas 2001;14:7–11.
24. Langley-Evans SC, Bellinger L, McMullen S. Animal models of programming: early life influ-ences on appetite and feeding behaviour. Matern Child Nutr 2005;1:142–148.
25. Bellinger L, Lilley C, Langley-Evans SC. Prena-tal exposure to a maternal low-protein diet programmes a preference for high-fat foods in the young adult rat. Br J Nutr 2004;92:513–520. 26. Hales CN, Ozanne SE. The dangerous road of
catch-up growth. J Physiol 2003;547:5–10. 27. Havel PJ. Role of adipose tissue in body-weight
regulation: mechanisms regulating leptin produc-tion and energy balance. Proceedings of the Nu-trition Society 2000;59:359–371.