Bolm Inst. oceanogr., S Paulo, 26:273-283, 1977
A STUDY OF THE UNDERSAMPLING PROBLEM OF FISH LARVAE OBSERVED AT
THE FIXED STATIONS IN SOUTH BRAZIL*
YASUNOBU MATSUURA
Instituto
Oceanográ~coda Universidade de
são
Paulo
SYNOPSIS
The prob1em of daytime undersamp1ing of 1arvae observed at two fixed stations made in the spawning ground of the Brazi1ian sardine
is discussed. The size frequency composition of sardine is a1so
discussed.
The predominant species on the stations was the 1arvae of
Sardi-nella brasiliensis.
The 1arvae ofHarengula spp.,
Scombridae,Breg-macerotidae, Ophidiidae were a1so co11ected, but not so abundant1y.
When compared to other 1arvae, the undersamp1ing of sardine
1arvae during daytime was extreme1y high. Because the samp1ing was done both vertica11y and horizonta11y at one fixed station and marked
undersamp1ing was observed at both stations, it was conc1uded that
the undersamp1ing was caused by avoidance. It was necessary to take
this prob1em into carefu1 consideration for computation of 1arva1
abundance.
INTRODUCTION
One of the purposes of study on ear1y 1ife history of fish is to c1arify
a re1ation between the mortality rate during larval stage and the recruitment
of fish stock in succeeding years. A prerequisite for a computation of 1arval
abundance is a knowledge of the rate of daytime avoidance of 1arvae.
*
This paper was presented at the CICAR Ichthyop1ankton Workshop (UNESCO)1974, Mexico City.
In calculating the larval abundance and survival rate of the California
sardine
(Sardinops caeruZea)
larvae, Ahlstrom (1954) revealed that there was a correlation between the undersampling rate and the s~ze of sardine larvae. The regression line fitted to this correlation was used for adjustment of daytime undersampling.In this pape r the daytime undersampling problem of the larvae observed at the two fixed stations made in the spawning ground of the Brazilian sar-dine,
SardineZZa brasiZiensis
(Steindachner, 1879), ~s discussed and recom-mendations are given for handling this problem.MATERIAL AND METHODS
Twel ve ser~es of vertical hauls were made during 24 hours at the fixed station No. 752, labelIed A, on November 23-24, 1969 (Fig. 1). The station depth was 78 m and hauls were taken at two hours interval during a 24-hour period at latitude 23032'S and longitude 44004'W. The w~re length was 70 m
and the average towing velocity was 0.8 m per second.
Twenty four ser~es of vertical hauls and 23 ser~es of horizontal hauls were made during a 24-hour period at the fixed s tation No. 1323, or B, on January 19-20, 1971 (Fig. 1). The station depth was 65 m. AlI hauls were spaced at one hour intervals at lati tude 24°l8'S and longitude 45028'W. The
wire length of vertical hauls was 60 m and the average towing velocity was 0.8 m per second. The horizontal hauls were made with a towing velocity of 1.5-2.0 knots, or from 0.8 m to 1.0 m per second in the surface layer.
The net used in sampling was the conical-cylinder plankton n e t a s re com-mended by UNESCO (1968), which had a mouth diameter of 113 cm and made o f a nylon monofilarnent gauze of mesh aperture about 420 micra after u s e . A small flow meter was attached 25 cm inside of the hoop and three bridles of 150 cm length were used in front of i t. The samples were preserved with a sol ution of 10% formalin. Fish eggs and larvae were sorted from plankton samples and for comparati ve purpose the relati ve abundance of eggs and larvae per 100 cubic meters of water strained wa s calculated.
MATSUURA: Undersamp 1 i ng
~
"'"
• ,.1 0
>.~ ''''5'' .
, ~ '., -'
--8
•
1)2)".
lO'
u·
275
Fig.
1 - Location of fixed stationsA a nd B.
only to order leveI. The predominant groups were identified to spec~ es and
the percentage contribution of each determined.
At station A, alI specimens except disintegrated larvae were measured and grouped by 0.5 nnn intervals. At station B, because the collections
con-tained so many larvae which showed rnonomodal distribution, we measured circa 100 specimens picked up at random from each sample. The number of larvae at each size class was calculated and shown in percent. Since only few specimens were collected during daytime, a comparison of the size composition of night and day haul series ~s less important. Therefore only the size frequency of night-caught larvae was shown in Figure 5.
Fixed station data was taken by the R/V "Prof. W. Besnard" of the
Insti-tuto Oceanográfico da Universidade de são Paulo. I wish to thank Captain Adilson Gama and the crew of the vessel for collection of material at sea and the staff members of the Instituto Oceanográfico for laboratory works. Special thanks are due to Dr. E. H. Ahls trom of the National Marine Fisheries Service and Dr. S. A. Antunes of the Instituto Oceanográfico for criticaI reading and revision of the manuscript.
RESULTS
- OCCURRENCE OF FISH LARVAE AT THE FIXED STATIONS
TABLE 1- Occurrence offish larvae at station A in November 1969 (vertical hauls)
~
Samp1 e number 257 258 259 260 261 262 263 264 265 266 267 268~
TotalFamily Time 18 : 40 20 : 40 22:40 00:40 02:40 04:40 06 : 40 08 : 40 10 : 40 12:40 14:40 16 : 40
C1upeidae 319 74 437 522 53 137 49 2 O 2 O O 1595
Engraulidae 1 O O 3 O O O O O O O O 4
Scombridae 1 O O 1 O O O O O O O O 2
Bregmacerotidae 5 13 36 55 26 12 21 21 24 40 40 8 301
Sphyraenidae O O O O O O O O O O O O O
Ophidiidae 3 3 6 15 10 O 4 3 2 2 6 1 55
P1euronectiformes 1 1 3 4 2 1 O 1 O 1 1 O 15
Gerridae 1 O O O O O O O O O O O 1
Synodontidae 1 1 3 2 4 2 1 4 2 O 2 2 24
Balistidae O O O O O O O O O O O O O
Leptocepha1us O O O O O O O O O O O O O
Gonos tomatidae O O O O O O O O O O O O O
Carangidae 5 O O 2 1 O 1 O O O 1 O 10
Gobiidae 1 1 4 3 1 1 O O O O O O 11
Exocoetidae O O O O O O O O O O O O O
Serranidae O O O 1 1 O O 1 O O O O 3
Triglidae O O O O O O O O O O O O O
Mugilidae O 1 O O O O O O O O O O 1
Lophiidae O O 1 O 1 O O O O O O O 2
Others 17 11 22 22 11 4 13 11 O O 3 2 116
Total 355 105 512 630 110 157 89 43 28 45 53 13 2140
TABLE 11 - Occurrenceof fish larvae at station B in January 1971 (vertical hauls)
~ Samp le number 555 557 559 56 1 563 565 567 56' 5 71 573 574 576 578 580 582 584 586 588 590 592 594 596 598 600
Fami l y ~ Time 08:4509:45 10 :50 11 :5012 :5013:45 14:451 5:45 16: 4517:45 18:45 19:45 20:58 21 :48 22:50 24:000 1 :1502 : 3503:4504 :5005:4006:4507: 4508:3 5 To t al
Cl upeidae O 1 2 2 3 O 2 4 6 14 11 1308 336 280 286 467 210 793 513 262 102 2 3 1 4558
Engrauli dae 3 2 O 1 O O 1 O 1 O 3 2 2 20 22 17
,
16 2 3 15 1 O 1 121Scomb ridae O O O 1 1 3 1 O O
,
4 280 27 28 19 40 10 30 7 5 O O O O 465Br e gmacerotida e O O O 1 O O 1 O O O O 2 2 1 O 1 O 1 O O O O O O
,
S ph yraen i dae 1 O O O O 1 O 1 2 O O 8 2 2 2 1 O 3 O 1 O 1 O O 25
Oph i diidu 1 O 1 2 2 O 1 2 1 O 1 3 5 3 2 O 4 4 7 2 1 3 O O 45
Pl euronecti formes 2 2 4 6 1 2 6 1 2 O O 44
,
6 17 14 7,
6 12 2 7 6 1 154Cenidae O O O O O O O O O O O 1 3 2 1 2 5 O O O O O O O 14
Synodo nti da e 1 O 1 O 1 O O 1 1 1 1 2 2 1 1 5 3 2 1 O O O O 1 25
Balistidae O O O O O O 1 O 1 O 1 O O O O O O 1 O C O O O O 4
Le p tocepha l UI O O O O O O 1 O O O O O O O 1 O 1 1 1 1 O O O O 6
Gonos t o lllat id ae O O O O O O O O O O O 2 O O O O O O O O O O O O 2
Cara ng id ae 2 O O O O O 1 O O O O 2 O O O O O O O O O O O O 5
Gob i idae O 2 O O O O O O O O O O O 1 O O O O O O O O O O 3
Exocoe t idae O O O O O O O O O O O O O O O O O O O O O O O O O
Serrani dae O O 1 O O O O O O O O O O O O O O O O O O O O O 1
Triglid ae 1 O O O O 1 O O O O O O O O O O O O O O 1 O O O .. 3
~g i lidae O O O O O O O O O O O O O O O O O O O O O O O O O
Lophii dae O O O O O O O O O O O O O O O O O O O O O O O O O
Others 12 17 14 19 15 15
,
7 13 16 14 93 22 17 17 18 12 12 13 21 3 4 14 6 403Total 23 24 23 32 23 22 24 16 27 40 35 1760 407 360 370 565 257 824 555 307 124 18 23
,
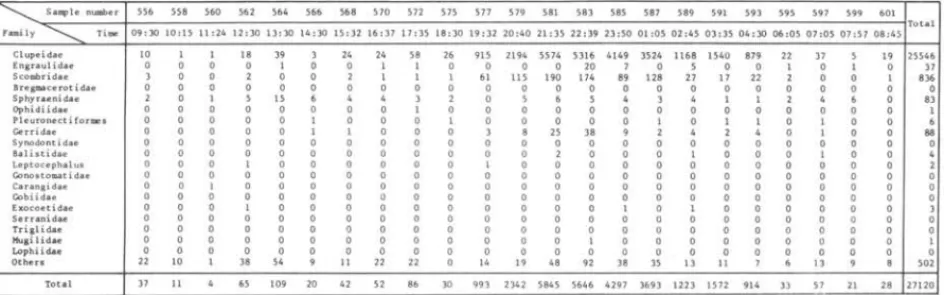
5869TABLE III-Occu rrence of fi sh la rvae at stat i on B n January 1971 (hori zonta 1 haul s)
~ Sample number 556 558 560 562 564 566 568 570 572 575 577 579 581 583 585 58 7 58' SOl 593 595 597 599 601
To t al Fami ly -... Time 09 : 30 10:15 11:24 12:30 13:30 14:30 15 : )2 16:37 17:35 18:3019:32 20:40 21:35 22 : 39 23:50 01:05 02 : 45 03:35 04 : 30 06 :05 07:05 07:57 08:45
Clupeida e 10 1 1 18 39 3 24 24 58 26 915 2194 5574 5316 4149 3524 116 8 1540 879 22 37 5 19 25546
Engr aulidae O O O O 1 O O 1 1 O O O O 20 7 O 5 O O 1 O 1 O 37
Scombridae 3 O O 2 O O 2 1 1 1 61 115 190 174 89 128 27 17 22 2 O O 1 836
BregtllOlce ro t i dae O O O O O O O O O O O O O O O O O O O O O O O O
S phy rae n idae 2 O 1 5 15 6 4 4 3 2 O 5 6 5 4 3 4 1 1 2 4 6 O 83
Ophi diidae O O O O O O O O 1 O O O O O O O O O O O O O O 1
P l eu rone ct i for me s O O O O O 1 O O O 1 O O O O O 1 O 1 1 O 1 O O 6
Gerridae O O O O O 1 1 O O O 3 8 25 38 9 2 4 2 4 O 1 O O 88
Synodon tidae O O O O O O O O O O O O O O O O O O O O O O O O
Balistidae O O O O O O O O O O O O 2 O O O 1 O O O 1 O O 4
Leptocephalus O O O 1 O O O O O O 1 O O O O O O O O O O O O 2
Gonostomatidae O O O O O O O O O O O O O O O O O O O O O O O O
Carangidae O O 1 O O O O O O O O O O O O O O O O O O O O O
Gobiidae O O O O O O O O O O O O O O O O O O O O O O O O
Exocoet i dae O O O 1 O O O O O O O O O O 1 O 1 O O O O O O 3
Serranidae O O O O O O O O O O O O O O O O O O O O O O O O
Tr i gl idae O O O O O O O O O O O O O O O O O O O O O O O O
Mulí lidae O O O O O O O O O O O O O 1 O O O O O O O O O 1
Loph iídae O O O O O O O O O O O O O O O O O O O O O O O O
Others 22 10 1 38 54
,
11 22 22 O 14 19 48 92 38 35 13 11 7•
13 9 8 502Total 37 11 4 65 10' 20 42 52 86 30 993 2342 5845 5646 4297 3693 1223 1572 914 33
MATSUURA: Undersampling
277
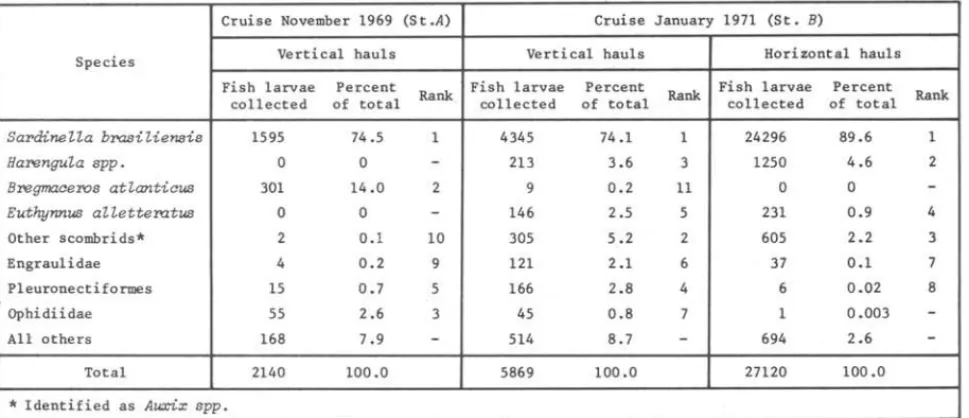
TABLE IV - Compari son of abundance of fi sh larvae collected at the fi xed stations
Cruise November 1969 (S t .A) Cruise January 1971 (St. B)
Species Vertical hau1s Vertical hau1s Horizontal hau1s Fish 1arvae Percent
Rank Fish 1arvae Percent Rank Fish 1arvae Percent Rank co11ected of total co11ected of total co11ected of total
SardineLLa brasiLiensis 1595 74.5 1 4345 74.1 1 24296 89.6 1
HarenguLa spp. O O - 213 3.6 3 1250 4.6 2
Bregmaceros atLanticus 301 14.0 2 9 0.2 11 O O
-Euthynnus aLLetteratus O O
-
146 2.5 5 231 0.9 4Other scombrids* 2 0.1 10 305 5.2 2 605 2.2 3 Engrau1idae 4 0.2 9 121 2.1 6 37 0.1 7 P1euronectiformes 15 0.7 5 166 2.8 4 6 0.02 8 Ophidiidae 55 2.6 3 45 0.8 7 1 0.003
-All others 168 7.9-
514 8.7-
694 2.6-Total 2140 100.0 5869 100.0 27120 100.0
* Identified as Auxix spp.
SardineZZa brasiZiensis
larvae were predominant and contributed 74.5% oftotal larvae collected at station A and 74.1% and 89.6%, respectively for vertical and horizontal hauls at station
B.
Concerning other species, the occurrence patterns at the two stations were somewhat different. At s tation A the second predominant species was
Bregmaceros atZanticus
(Goode & Bean, 1886) larvae, followed by the groups ofOphidiidae, Synodontidae and Pleuronectiformes in this sequence. At s tation
B the second predominant species in vertical hauls was the group of Scom-bridae, followed by
HarenguZa spp. 1
and Pleuronectiformes. In horizontal haulsHarenguZa spp.
ranked second and then Scombridae, Gerreidae, Sphyraenidae andEngraulidae followed in order of abundance.
Comparing the occurrence of fish larvae ~n vertical and horizontal hauls
at station B, we can notice that sardine larvae were collected more abundantly in surface horizontal hauls. On the other hand the larvae of
HarenguZa
species were collected more abundantly in vertical hauls (4.6%) than in horizontal hauls (3.6%).1 Two
HarenguZa
species occur in south Brazilian waters, i.e.H. jaguana
and- UNDERSAMPLING PROBlEM
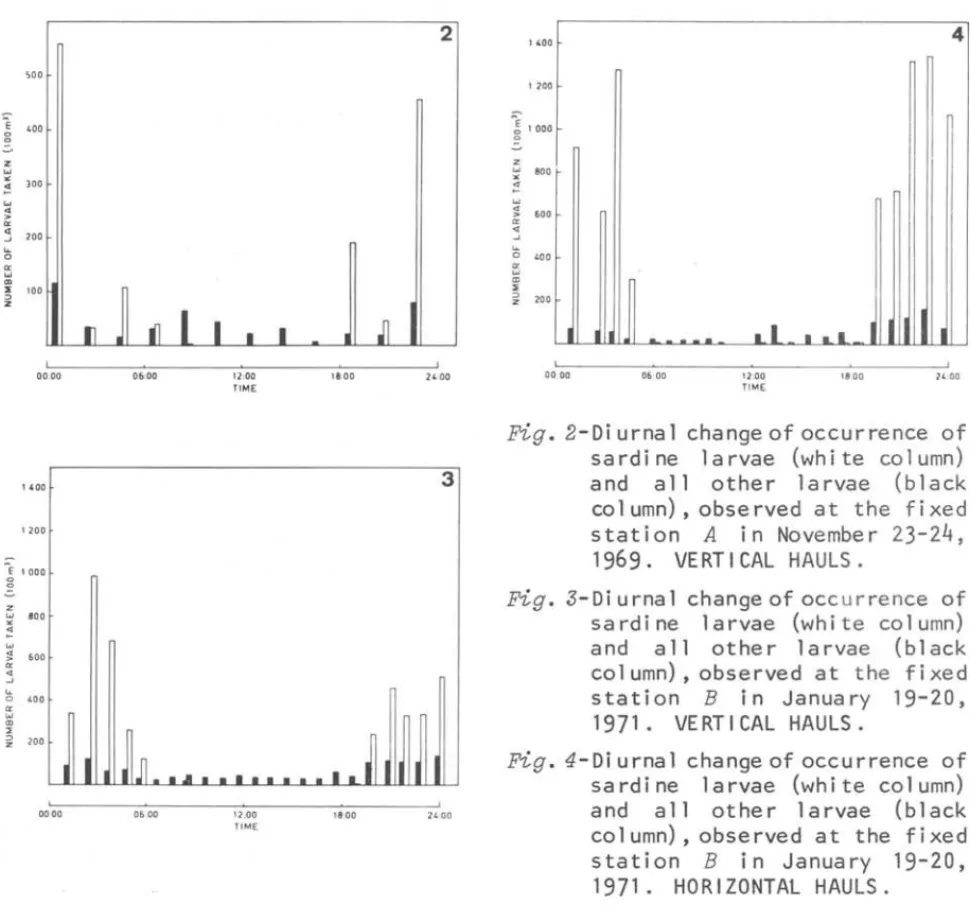
The occurrence of sardine larvae and others are shown in Figures
2,
3 and 4. Almost alI sardine were collected from night hauls at both stations. The difference between night and day catches was so great that we could not compare the distribution of sardine larvae caught by day and by night. The night/day catch ratio of larvae is presented in Table V.The night/day catch ratio at station A was 32.4 for sardine larvae and 2.3 for others. Second ranked species, Bregmace~s
atZanticus,
showed little difference between day and night catches inasmuch as the night /day catch ratio was only 1.03.'00
E 400
o
:o-z
'" " )00
~
w
~
:l 200
..
o
~
"
100" z
00.00
140 o
120 o
~ 1000
~ aoo
:!
'" ~ 600
:l
..
o 400cr
W '"
:>:
~ 200
0000
I
06:00 12:00
TIME
18:00
~~
.A • • • • • • • • • •~I
0600 12.00
TIME 18.00 11 2 24 :00 3 2400 1400 1200
~ 10,00
z
w 800
"
~
w ;! '00 cr
" ~
..
o 4005 '"
~ 200
I
0000
.
0600
Ll •
LL1200 TIME 1800 4
~
I 2L '00Fig.
2-Di urna I change of occurrence of sardine larvae (white column) and all other larvae (black co 1 umn) , obse rved a t the f i xedstation
A
in November23-24,
1969. VERTICAL HAULS.
Fig. 3-Di urnal change of occ urrence of sardine larvae (white column)
and all other larvae (black
column), observed at the fixed
station B in January 19-20,
1971. VERTI CAL HAULS.
Fig. 4-Di urnal change of occurrence of sardi ne larvae (whi te col umn)
and all other larvae (black
co 1 umn) , obse rved a t the f i xed
station B in January 19-20,
MATSUURA: Undersampling
S t a ti o n A S t a t io n 8
(Nov e1lber 1969) (Jan ua r y 1971) Speci es
Ve rt ical h a uI Ver t icd ha u I Horizonta l hauI
Da, Ni lht N/D l Da, Night N/D Da, Night N/D
Sal'dineZZa bn::wiliensis 7.2 233 . 5 32.4 D. ' 392.5 615.2 1.7 826.3 486.1
Hanmgula spp.
,
..
14.7 '.8 10.6 34.3 '.2EWthy71nUB allettel"atus D.5 7.1 l'Ll D 7.7
8'1'egmaceT08 aHantiCW8 2 2. 4 21.8 1.03 D.2 0.7 3.1 o
AlI o the rs 11.6 26 .4 2.' 29 . 4 68 .2 2 . ' 17 . 1 35.8 2.1
Al I l a r v ae 41.2 281 .7 '.8 34.6 483 .2 14.0 29.4 904.1 30.8
Number of h a u I. 1 13 11 13 10
No t e: FOl" cOlllpar a üve purpose , lhe aver a ge num ero l l a rva" per 100 . 1 of va te r strained
wa s ~e d
I Nigh t / da y catch neio
2 Becauae t he s Bmpling 101'8' na t co n du c ted e • • c c l )' in o ne ho u r in te rval at station B,
th e r e 101' • • • d iffere n ce i n numb e r o f h.uh du ri n g da)' and n ight times .
279
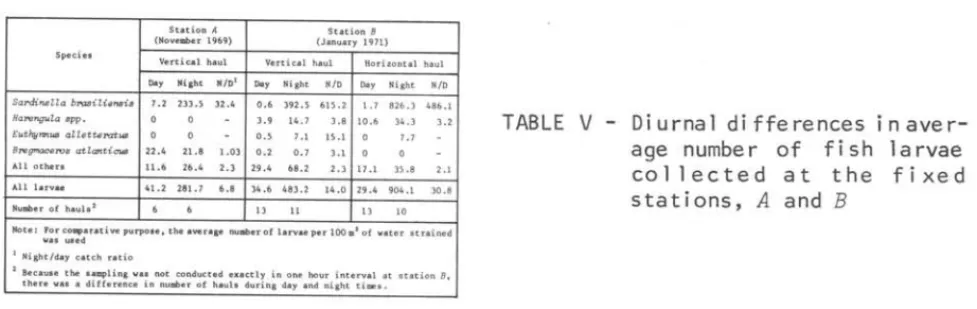
TABLE
V-
Di urna I di ffe re nces i nave
r-age number of fish I a rvae
col lected at the f i xed
stations,
Aand
BAt station B the night/day catch ratio was 615.2 for sardine larvae in vertical hauls and 486.1 in horizontal hauls.
Harengula spp.
showed the night/day catch ratio of 3.8 and 3.2, respectively in vertical and horizontalhauls.
Euthynnus alletteratus
(Rafinesque, 1810) showed the night/day catch ratio of 15.1 in vertical hauls, whereas in horizontal hauls i t was not col-lected in daytime hauls. The ratio obtained for other species were 2.3 and 2.1, respectively in vertical and horizontal hauls.Comparing the night/day catch ratio of sardine larvae with those given by other authors (generally less than la) our values were extremely high. Since only sardine larvae showed such elevated values at fixed stations, we
cannot assume that the sampling method was inadequate.
- SIZE FREQUENCY DF SARDINE LARVAE
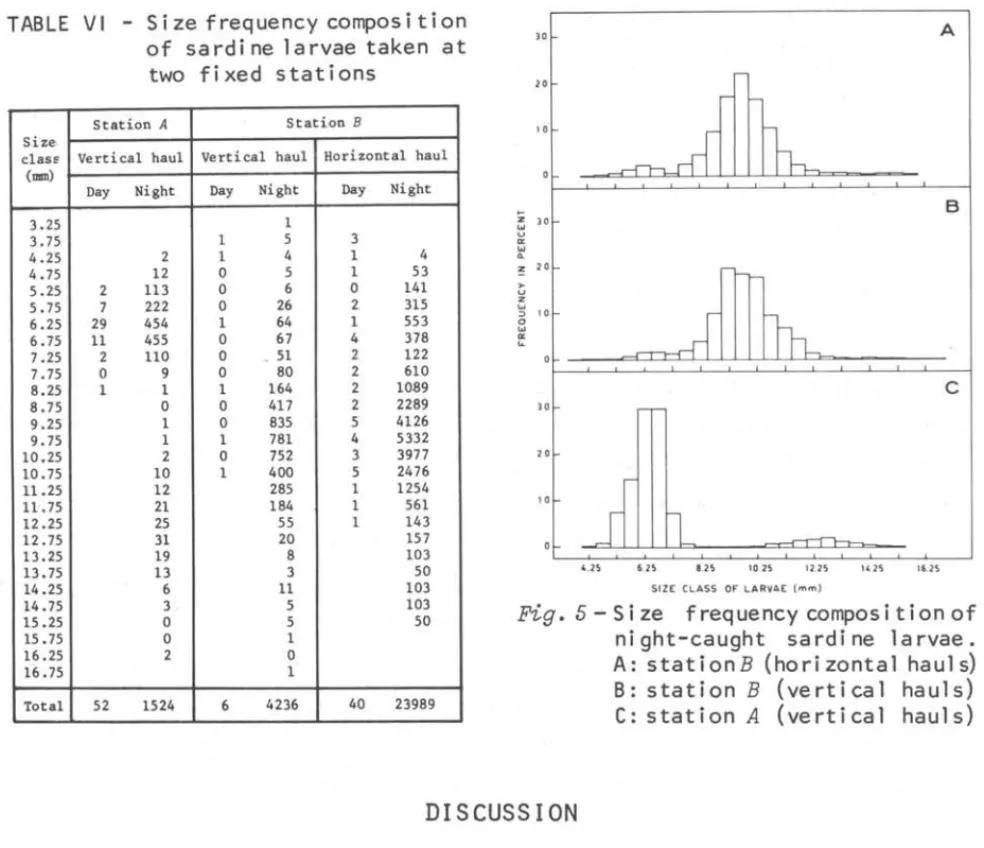
Table VI shows a comparison of the s~ze frequency composition betwe en day and night catches at two stations. The size frequency of night-caught sardine larvae collected at the fixed stations is shown in Figure 5.
At station A a bimodal size frequency was observed, i.e. a small - size group with average length 6.3 mm, rangi ng from 4.0 to 8.5 mm and a large-size group wi th average 1ength 12.5 mm, ranging from 9.0 to 16.5 nnIl. The number of
larvae was 1378 for the former and 146 for the latter. We may assume that these two groups were derived from different spawning periods.
TABLE VI - Size frequency composition
of sa rdi ne 1 a rvae taken at
two fixed stations
Station A Station B Size
class Vertical hau1 Vertical hau1 Horizontal hau1
<II1II1)
Day Night Day Night Day Night
3.25 1
3.75 1 5 3
4.25 2 1 4 1 4 4.75 12 O 5 1 53 5.25 2 113 O 6 O 141 5.75 7 222 O 26 2 315 6.25 29 454 1 64 1 553 6.75 11 455 O 67 4 378 7.25 2 110 O - 51 2 122
7.75 O 9 O 80 2 610 8.25 1 1 1 164 2 1089 8 . 75 O O 417 2 2289 9 . 25 1 O 835 5 4126 9.75 1 1 781 4 5332 10 . 25 2 O 752 3 3977 10.75 la 1 400 5 2476 11.25 12 285 1 1254 11.75 21 184 1 561 12.25 25 55 1 143 12.75 31 20 157
13.25 19 8 103
13.75 13 3 50
14.25 6 11 103
14.75 3 5 103
15.25 O 5 50
15.75 O 1
16.25 2 O
16.75 1
Total 52 1524 6 4236 40 23989
lO A
"
~
o
o
B
o
o
~
o
o
c
o~J~rl~~~~
' .2!> 6 .2S a .2S la 25 12.2S 14 2S 16 25 51ZE CLASS OF LAR'VAE ( rn", )Fig. 5 - Si ze f requency compos i ti on of ni ght-caught sardi ne larvae. A: stationB (horizontal hauls)
B: station B (vertical hauls)
C: station A (vertical hauls)
DISCUSSION
The undersampling problem of fish larvae during daytime, especially when
used small size and low speed sampling gear, is well known. Clutter
&
Anraku(1968) summarized the undersampling of zooplankton by avoidance.
Concerning clupeid larvae, the undersampling problem has been discussed
by many workers, as summarized in Table VII. From this Table we can notice
that the night/day catch ratio of the Brazilian sardine larvae at the fixed
stations was extremely ligh. What factors might cause such marked
under-sampling during daytime? We can reject an hypothesis of diurnal vertical
migration of sardine larvae, since the undersampling was observed both in
vertical and horizontal hauls. There remains a possibility that the sampling
was not made in the same water mass during daytime and the clumping of
MATSUURA: Undersampling 281
1ess probab1e inasmuch as similar undersampling was observed at both fixed
stations and these were occupied in different p1aces and times. Futhermore the occurrence of fish eggs at two fixed stations showed that there were no distinct difference between day and night time samp1es2 •
Avoidance may be the main cause of this phenomenon. C1utter & Anraku (1968) considered various factors which cou1d cause avo i dance of zoop1ankton,
i.e. pressure acce1eration, visual, acoustic and 1ight effects. l t is very
difficu1t to know which factors affected the avoidance of the Brazilian sar-dine 1arvae.
TABLE VII - Comparisonof the night/day catch ratioof clupeid larvae observed by various authors
Authors Sampling gears Species N/DI Period of observations
Wallace (1924) Peterson young fish traw1 cz.upea harengu.!' 3.2 1921-23 Russe1 (1926 & 28) 2 m stramin ring traw1 Sardina piZchardue 5.7-13.9 1924-26 Si11iman (1943)2 C10sing net Sardinops caeruZea 4.1 1931 & 41
Ah1strom (1954) 1 m standard net Sardinops caeruZea 6.5 1940, 41, 50 & 51 Bridger (1956) He1go1and larva net cz.upea harengus 6.3 1952-53
Bridger (1956) He1go1and larva net Sardina piZchardus 4.1 1952-53 Bridger (1958) Gulf-IlI net cz.upea harengus 0.7-1.1 1955-56 Ah1strom (1959)2 C10sing net Sardinops caeruZea 3.9 1941, 50 & 51 Ah1strom (1965) 1 m standard net Sardinops caeruZea 6.4 1950-58
Present author 2 1.13 m conica1-cy1inder net SardineZZa b~iZiensis 32.4 1969 (station A) Present author 2 1.13 m conica1-cy1inder net SardineZZa b~iZiensis 615.2 1971 (station B)
Present author3 1.13 m conica1-cy1inder net SardineZZa brasiZiensis 3.3 1969-71 (in preparation)
I Night/day catch ratio 2 Observation at fixed station
3 Night/day catch ratio was ca1cu1ated using the average number of sardine 1arvae (per 100 m3 of water strained) taken at positive stations on the cruises of 1969 through 1971.
Analysing the plankton samples from the CalCOFI investigations, Isaacs (1964) concluded that the abundance of sardine larvae taken during daytime coincided with that ofthe mortality of night time samples. He suggested that
the daytime sampler might act as predator for sardine larvae which caught only weaker or less alert larvae.
Because an occurrence of only few sardine larvae during daytime was ob-served at the fixed stations, it is not adequate to adjust the daytime samp les with the ratio of night/day catches. Therefore the samples collected dur ing daytime should not be used for computation of larval abundance, at least whe n
used the same sampling gear.
RESUMO
Um dos objetivos do estudo quantitativo do ictioplâncton e esclarece r a relação entre a lOOrtalidade de larvas e o recrutamento do estoque nos anos
sucess~ vos.
Para computar a abundância de larvas e necessário obter as informações sobre a eficiência da captura. Dois fatores tem que ser considerados: um, o escape de larvas pequenas através da malha da rede e, outro, a "avoidance" de larvas maiores durante o dia.
Este trabalho apresenta as observações feitas sobre a variaçao di u rna de ocorrência de larvas de peixes, realizadas em 1969 e 1971 em duas estaçõ e s fixas localizadas no sul do Brasil.
As larvas mais abundantes pertenciam a
SardineZZa bras i Ziensis
.
Outras que predominaram foram: Bregmace~satZanticus, Euthynnus aZZetteratus
eHa-renguZa
spp. Foram observadas coletas mais abundantes de larvas de sardinha na camada superior.As larvas de sardinha foram coletadas principalmente durante a noite. O " undersampling" foi considerado devido a "avoidance" . A razão entre cap-turas medias durante a noite e o dia foi tão grande que e prec~so uma cons~
MATSUURA: Undersampling
283
REFERENCES
AHLSTROM, E. H. 1954. Distribution and abundance of egg and larva1
popu1ations of the Pacific s ardine. Fishery Bu11. Fish Wild1. Serv. U.S., 56(93) :83.,..140.
1959. Vertical distribution of pe1agic fish eggs and
1arvae off Ca1ifornia and Baja California. Fishery Bu11. Fish Wi1d1. Serv.
U.S.,
60(161) :107-146.
1965. A review of the effects of the environment of
the Pacific sardine. Spec. Pub1s int. Comn. NW. At1ant. Fish., (6) :53-74.
BRIDGER, J. P. 1956. On day and night variation in catches of fish
1arvae. J. Cons. perm. int. Exp1or. Mer, 22(1) :42-57.
1958. On efficiency tests made with a modified Gulf
111 high-speed tow neto J. Cons. perm. int. Exp1or. Mer, 23(3) :357-365.
CLUTTER, R. I.
&
ANRAKU, M. 1968. Avo i dance of samp1ers.In:
Zoo-p1ankton samp1ing. Mbnogr. oceanogr. Methodo1., (2) :57-76.
ISAACS, J. D. 1964. Night-caught and day-caught 1arvae of the
Ca1i-fornia sardine. Science, N.Y., 144(3622):1132-1133.
RUSSEL, F. S. 1926. The vertical distribution of marine macrop1ankton.
3. Diurna1 observations on the pe1agic young of te1eostean fishes in the P1ymouth area. J. mar. bio1. Ass. U. K., 14:387-414.
1928. The vertical distribution of marine macrop1ankton.
8. Further observations on the diurna1 behaviour of the pe1agic young of te1eostean fishes in the P1ymouth area. J. mar. bio1. Ass. U. K., 15: 829-850.
SILLlMAN, R. P. 1943. Studies on the Pacific pi1chard or sardine
(Sardinops caeruZea).
6. Therma1 and diurna1 changes in the verticaldistribution of eggs and 1arvae. Spec. Scient. Rep., U. S. Fish Wi1d1.
Serv., (22) :1-17.
UNESCO. 1968. Reports of ICES SCOR-UNESCO Symposium of hydrodynamics
of p1ankton samp1ers and the meeting of working party 3.
In:
Zoop1anktonsamp1ing. Mbnogr. oceanogr. Methodo1., (2) :160-163.
WALLACE, W. 1924. First report on young herringin the southern North
sea and Eng1ish channe1. Part 1. Distribution and growth of 1arva1 and post-1arva1 stages. Fishery Invest., Lond., Ser. 11, 7(4).
WHlTEHEAD, P. J. P. 1973. The c1upeid fishes of the Guianas. BulI.
Br. Mus. nato Hist., Zool., 25(supp1. 5) :1-227.