Bolm Inst. oceanogr., S Paulo,
26:219-247, 1977
A
STUDY OF THE LIFE HISTORY OF BRAZILIAN SARI'INE,
SARDINELLA
BRASILIENSIS.
IV. DISTRIBUTION AND ABUNDANCE OF SARDINE LARVAE*
YASUNOBU MATSUURA
Instituto Oceanográfico da Universidade de são Paulo
SYNOPSIS
Data on distribution and abundance of larvae of the Brazilian sardine,
Sardinella brasiliensis,
are presented based on samples collected in waters off southern Brazil during 1969 to 1971. The distribution pattern and relative abundance of sardine larvae during three spawning seasons are discussed. Relative abundance, using regional census estimates, was calculated each year. In general, larval abundance in each subarea coincided with that of eggs, al-though the area of distribution of larvae was larger than the spawn-ing area. Estimates of larval abundance showed that the 1970-71 spawning season was the poorest, both in larval and egg abundance, despite the enlarged size of the area surveyed. The average tempera-ture at stations where sardine larvae occurred was 23.40C, r anging from 14.6 to 27.40C, and the average salinity was 35.60 /00, ranging from 35.0 to 36.70 /00. Distribution of the larvae in different depth zones was analysed. Larvae usually were most abundant in the 51-100 m depth zone . No tendency for a unidirectional transport of larvae was observed; apparently they move from the spawning ground in alI possible directions, spreading over the continental shelf. An estimate of survival rate of larvae, based on length frequency data pooled from the three years, was calculated. Undersampling of larvae during daytime was observed. The mean night-day catch ratio, based on larvae from alI length classes sampled, was 3.93.*
This study was partially financed by Fundação de Amparoã
Pesquisa do Es-t ado de são Paulo (Proc.: Biológicas 70/578 and 71/322).INTRODUCTION
The ichthyoplanktonsurvey of Brazilian sardine began in 1968 and S1nce then information on the early life history has been gathered. The main purpose of this paper is to compare the relative abundance of the larvae from three spawning seasons and to study the relationship between larval distribution and environmental conditions. Results described here on distri-bution of sardine larvae were obtained from survey cruises of the project SOL with the research vessels "Prof. W. Besnard" and "Emília" of the Insti-tuto Oceanográfico da Universidade de são Paulo.
MATERIAL AND METHODS
ZOOPLANKTON COLLECTION
During the survey cruises, a conical-cylinder plankton net (mesh = 420 micra) was used, according to the recommendations of UNESCO (1968). A small flow meter was attached to the mouth of the net to measure the volume of water strained. The net was towed vertically from a depth of 80 m to the surface at a velocity of 0.8-1.0 m per second. During the crU1se of December 1971, vertical and horizontal hauls were conducted at each station. The horizontal hauls were made on the surface layer during 5 minutes by towing velocity of about 1.5 knots. Because no flow meter was used in this cruise, catches of larvae were quantified by calculating the estimated volume filtered:
Estimated water volume = (mouth area) x (towing distance) x (filtration coefficient).
A filtration coefficient was measured in experimental tank and it was 0.9 for our conical-cylinder neto
MATSUURA:
SardineZZa brasiZiensis 221IDENTIFICATION OF THE LARVAE
The 1arvae of SardineZZa brasiZiensis, Opisthonema ogZinum, and
Haren-guZa jaguana (= H. pensacoZae) are very similar and their identification
is puzz1ing. However, recent papers by Houde
&
Fore (1973), Houde et aZo(1974), Richards et aZo (1974), and Matsuura (1975b) enab1ed an accurate separation.
SURVEY AREA
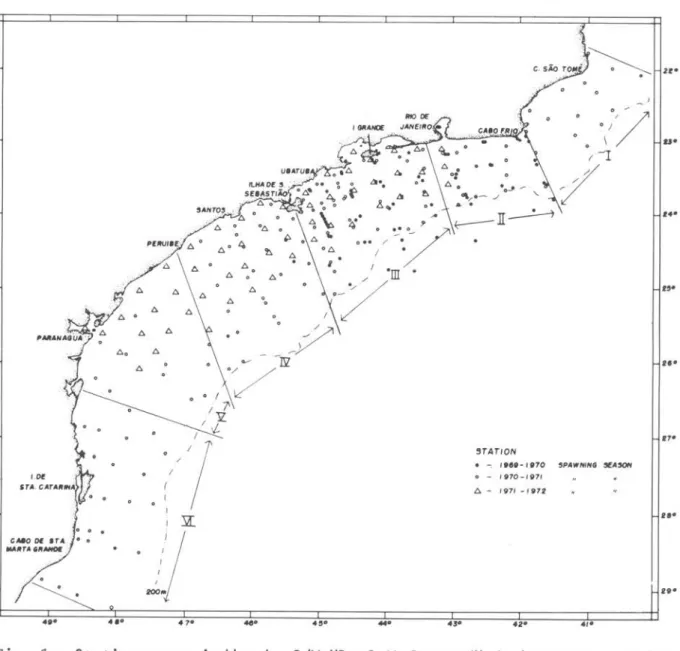
The station p1an of the three spawning seasons is presented in Figure 1. The stations represented are on1y those actua11y occupied by the R/V IIprof. W. Besnardl l • The fu11 area was divided into six subareas: I - region of Cabo
de são Tome; 11 - region of Rio de Janeiro; 111 - region of Ilha Grande; IV - region of Santos; V - region of paranaguá; and VI - region of Santa Cata-rina.
During the 1969-70 spawning season, four crU1ses were made in the region of Ilha Grande and Rio de Janeiro. The crU1ses of September 1969 and March 1970 were made 1n the region of Ilha Grande and samp1es were taken on1y during day-time. The cruises of November 1969 and January 1970 were made 1n the region from Cabo Frio to são Sebastião (Figs 2-3).
During the 1970-71 spawning season, four cruises were made. The crU1se of October 1970 covered the entire region of Ilha Grande. The crU1ses of No-vember-December 1970 and February-March 1970 covered a 1arger are a which ex-tends from Cabo de são Tome (220s) to beyond Cabo de Santa Marta Grande (29020'S). The cruise of January 1971 covered the region from Rio de Janeiro to Peruibe (470W). Resu1ts of three of these crU1ses are presented in Figures 4, 5, and 6.
During the 1971-72 spawning season, a single crU1se was conducted in De-cember 1971, in the region which extends from Rio de Janeiro to Paranaguá
(4S030'W). Vertical and horizontal hau1s were made at each station (Figs 7-S) •
, o o • eMO DE arA. • o
*"TA .,,1tIfOE
.'0
..,0
.'0
. . o".
,..
5PAWNfNG !lfASON
~ - /97/ - 1872
.,.
Fig. 1 - Stations occupiedby the R/V "Prof.W. Besnard" during survey cruises
made in 1969 through 1971.
REGIONAL CENSUS ESTIMATE OF THE LARVAE
Total numbers of larvae were not estimated because of the great influ-ence of gear avoidance by Brazilian sardine larvae observed at the fixed stations, which would make estimation of larval abundance inaccurate. Furthermore, the survey area differed each year making it difficult to com-pare annual variations in abundance for the whole area.
MATSUURA:
Sardinella brasiliensis
223and anchovy larvae. He determined abundance of larvae ln a glven area "r" from the following formula:
m
where
(c.d.a.-1b.- 1)
1 1 1 1
Ck4 estimate of abundance of larvae in region "r" ln each quarter. A
=
are a of region "r" in number of 10 m2 areas.r
m
=
number of stations occupied during a three month period.a.
=
are a ln square meters of mouth of the net used at the "ith"1
station.
b. 1ength of tow in meters estimated from a ca1ibrated f10w meter at
1
station "i".
c.
=
number of 1arvae at "ith" station.1
d. tow depth ln meters estímated from the wire ang1e at maximum wire
1
out at the station
"i".
The area of each subarea was measured with a p1animeter. At first, the mean number of 1arvae per unit of sea area (1 m2 ) in each subarea was calcu-1ated and then it was mu1tip1ied by the area of the region in square meters.
RESULTS
1969-70 SPAWNING SEASON
..
'o o.l _ ~
o II - ,DO o lO, - tOOC!
o
.
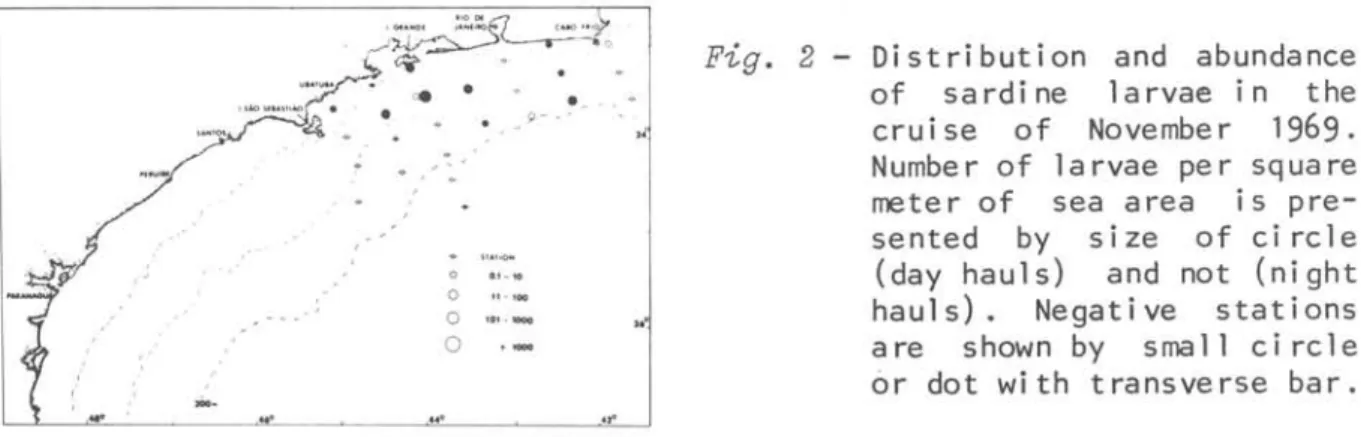
,.Fig. 2 - Distribution and abundance
of sardine larvae in the cru i se of Novembe r 1969. Number of larvae per square meter of sea area is pre-sented by size of ci rcle (day hauls) and not (night hauls). Negative stations are shown by small ci rcle or dot with transverse bar .
During the 1969-70 season the area sampled on the station line off Rio de Janeiro produced only few sardine larvae. Two concentrations could be visualized: one large group off Ilha Grande and a small one off Cabo Frio-Saquarema. Comparison of areas of distribution of eggs and larvae revealed that the area of the latter was considerably larger than the former.
1970-71 SPAWNING SEASON
Four cruises were carried out in this season. Only in October 1970 no sardine larvae were collected. Figure 4 shows the occurrence of larvae from the cruise of November-December 1970. Two heavy concentrations were observed in the region of Santos-São Sebastião and of Rio de Janeiro. In the region of Cabo de são Tome larvae were scarce and enly a few occurred near Para-nagua.. It is surprising that the main spawning ground off Ilha Grande, in which a large concentration of eggs and larvae was observed in the previous season (Matsuura, 1975a), had neither larvae nor eggs in this cruise.
MATSUURA:
Sardinetta
b~8itiensi8.,.
Fig. :3 - Distribution and abundance
of sardine larvae in the cruise of January 1970.
Fig. 4 - Distribution and abundance
of sardine larvae in the crui se of November-December 1970.
Fig. 5 - Distribution and abundance
of sardine larvae in the cruise of January 1971.
4
5
.
-0,_ ' - _ .~. -
---
,..
,-,-'
.'
"
.
o
o
o
.-o 0.1 . " o li - IDO
o 101 - 1000
o
225
.,'
During the February-March 1971 cruise (Fig. 6), 1arvae occurred in three regions: Cabo de são Tome, Santos-são Sebastião and Cabo de Santa Marta Grande.
Summing up resu1ts of the three cruises, we can assume that there is a heavy concentration of 1arvae in the region of Santos-São Sebastião-Ubatuba and sma11er concentrations in the regions of Cabo de são Tome and Cabo de Santa Marta Grande.
1971-72 SPAWNING SEASON
6
8
---
0_-•
o OI . !O o 11 - 100
o o
'
r-...
7
• "
~: !'
o"... .
.
~ '.
• ..,. -,~- ~ o ~ .... ,//'
..,. ,./ / 0 o ,~' ... ,;
.
. / e/ e
•
•
o o.l _ tO
o H - lOO
o
O
..
"Fig. 6 - Distribution and abundance
of sardine larvae in the cruise of February-March 1971 .
Fig.
? - Distribution and abundance of sardine larvae collected in vertical hauls in the cruise of December 1971.Fig. 8 - Distribution and abundance
of sardine larvae collected in horizontal hauls in the cruise of December 1971.
Larvae occurred at alI stations in the surveyed area, with the exception of nearshore stations off Paranaguã-Santos and off são Sebastião-Ilha Gran-de. A heavy concentration was observed in the region of Peruíbe-Santos-são Sebastião in the 51-100 m depth zone. The distribution of larvae in this cruise coincided almost exactly with that of the eggs (Matsuura, 1975a) and no significant differences were found on distribution patterns determined by either vertical or horizontal hauls.
RELATlVE ABUNDANCE OF TIlE LARVAE
MATSUURA:
Sardinella brasiliensis
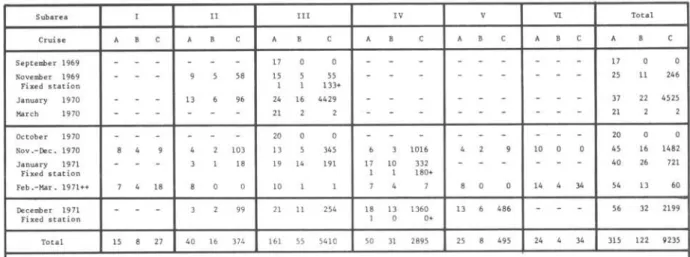
227TABLE I
-
Abundance of sardi ne 1 a rvae, by cruise and subarea, in1969-1971
(Ve rt i ca 1 hauls)
Subarea I l III IV V VI Total
Cruise A A A A A
Septerober 1969 17 17
November 1969 58 15 55 25 II 246
Fixed statioo 1 133+
January 1970 13 96 24 16 4429 37 22 4525
Harch 1970 21 21
October 1970 20 20
Nev .-Dec. 1970 8 4 103 13 345 1016 10 O 45 16 1482
January 1971 18 19 14 191 17 10 332 40 26 721
Fixed statioo 1 1 180+
Feb.-Mar.1971++ 7 4 18 10 8 O 14 4 34 54 13 60
Oecember 1971 99 21 II 254 18 13 1360 13 6 486 56 32 2199
Fixed statioo I O 0+
Total 15 27 40 16 374 161 55 5410 50 31 2895 25 8 495 24 34 315 122 9235
A - number .cf statioos occupied. B - number af statioos at which sardine larvae were collec t ed, C .. total number of sardine larvae collected
+ At the fixed station. total number of larvae were divided by number af hauls and mean number of larvae per haul i8 presented in the table ++ Collected with Hensen plankton net except 12 statioos in the subaTea VI
SubaTeas: I .. são Tome, 11 • Rio de Janeiro. III lO" Ilha Grande , IV .. Santos, V .. paraoaguá, VI .. Santa Catarina
The ratio of positive stations against a11 stations ranges from 43 to 68% (a11 subareas contributed, except the subarea VI in the region of Santa Catarina in which no 1arvae were taken during this period). The ratio of positive stations against a11 stations was 41% for daytime and67% for night-time, suggesting that daytime hau1s may not be effective to co11ect sardine 1arvae.
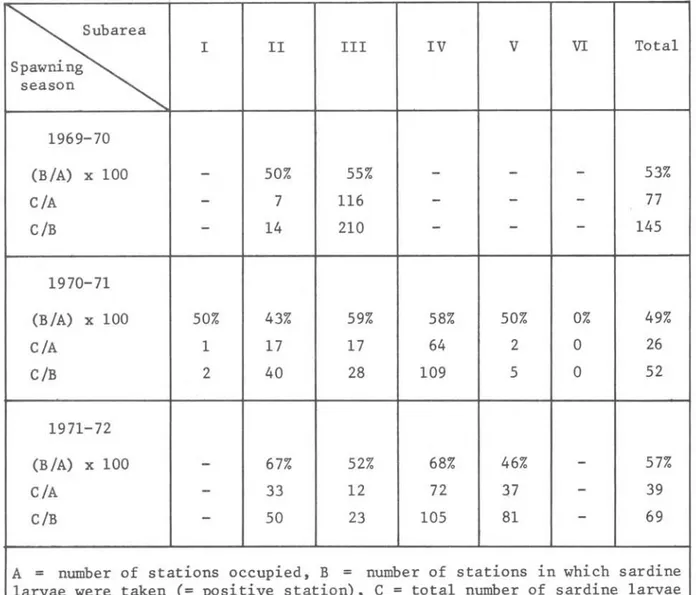
Tab1e 11 shows that 1arva1 density varies from year to year. In the 1969 -70 spawning season, the va1ues of 1arva1 density in subarea 111 (region of Ilha Grande) are higher than those of subarea 11 (region of Rio de Janeiro). This coincided with resu1ts obtained for egg abundance. In the 1970-71 spawning season, the subarea IV (region of Santos) had the highest va1ue fo11owed by subareas 11, 111, V, I, and VI in that sequence. In the 1971-72 spawning season, the highest va1ue again was obtained in subarea IV, the va1ues decreasing in subareas V, 11, and 111.
TABLE I I - Comparison of mean number of larvae per station
Subarea
I II III IV V VI Total
Spawning season
1969-70
(B/A) x 100
-
50% 55%-
-
-
53%C/A
-
7 116-
-
-
77C/B
-
14 210-
-
-
1451970-71
(B/A) x 100 50% 43% 59% 58% 50% 0% 49%
C/A 1 17 17 64 2 O 26
C/B 2 40 28 109 5 O 52
1971-72
(B/A) x 100
-
67% 52% 68% 46%-
57%C/A
-
33 12 72 37-
39C/B
-
50 23 105 81-
69A = number of stations occupied, B = number of stations in which sardine
larva~ we,re taken (= positive station), C = total number of sardine 1arvae
taken
Note: On1y data from cru~ses of November, December and January were used
for calculation of mean number of larvae
MATSUURA: Sard:ineUa brasiZiensis 229
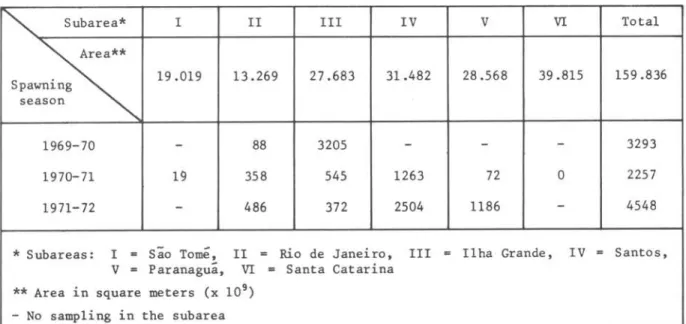
TABLE I I I - Regional census estimate of sardine larvae taken during main
5 pawn i ng pe r i od of Novembe r- Decembe r-Ja nua ry (i n b i 11 i ons)
'"
Subarea* I II III IV V VI Total~
Spawning 19.019 13.269 27.683 31.482 28.568 39.815 159.836 season
1969-70 - 88 3205
-
-
-
32931970-71 19 358 545 1263 72 O 2257
1971-72
-
486 372 2504 1186-
4548* Subareas: I
..
são Tomé, II = Rio de J anei ro , III = Ilha Grande, IV = Santos, V = paranaguã, VI..
Santa Catarina** Area in square meters (x 109 )
- No samp1ing in the subarea
The va1ues obtained for three spawning seasons in subarea 11 indicate that the highest re1ative abundance occurred in the 1971-72 spawning season, fo110wed by 1970-71 and then the 1969-70 season. In subarea 111 the opposite situation was observed, for the heaviest concentration of 1arvae occurred there in the 1969-70 season.
In subareas V and IV, the 1971-72 season had higher va1ues than those for 1970-71.
DISTRIBUTION OF LARVAE IN DIFFERENT DEPTH ZONES
The mean number of 1arvae per station in different depth zones is pre-sented in Tab1e IV.
The general tendency for a zona1 distribution of the 1arvae during three spawning season& can be summarized as fo110ws: heaviest concentration in the 51-100 m depth zone with decreasing va1ues for the 101-200, 15-50 m, and be-yond 200 m depth zones in this sequence.
pro-TABLE IV - Mean numberof sardine larvae per station in different depth zones
Depth zone
15-50 m 51-100 m 101-200 m + 200 m Spawning
season
1969-70 22.1 162.3 74.1 4.3
1970-71 12.8 51.7 17.1 9.8
1971-72 12.4 84.0 14.3
O
Total 13.8 91.7 40.3 5.6
On1y data from the cruises of November, December and January, were used for calculation of mean number of 1arvae
vided a total of 95 sardine 1arvae. It seems reasonab1e to assume then that at least part of the 1arvae that originated from spawning in she1f waters may be carried away to off-continenta1 she1f regions in which poor survival could be supposed.
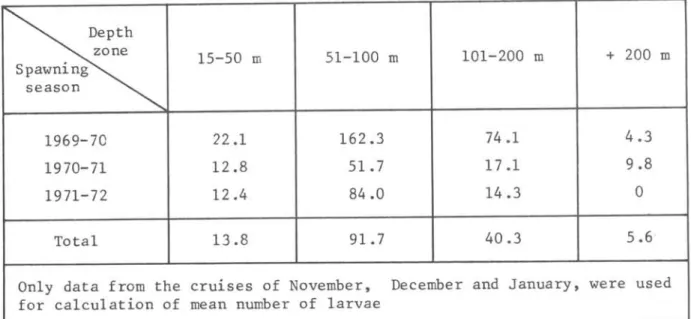
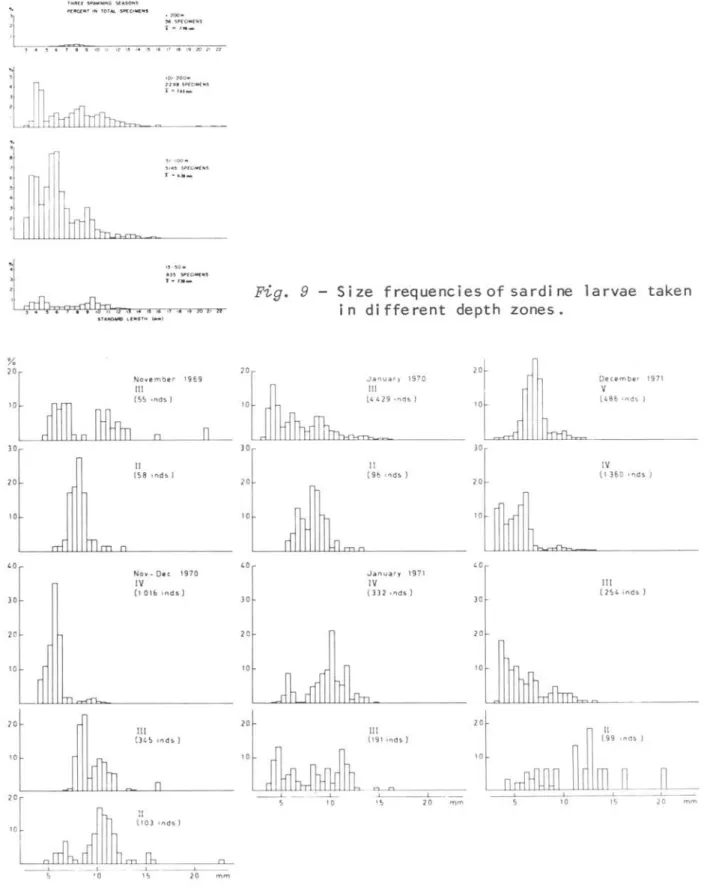
Before this investigation, it was genera11y accepted that sardine larvae, during their planktonic stage,wou1d be carried to the coas tal region by surface currents. This was mainly because of the occurrence of juveni1es 1n estuarine waters during the autumn and winter. To test this supposition, the size frequencies of 1arvae from different depth zones 1n different subareas were calculated and the results are shown in Figures 9 and 10.
Comparing the size frequencies of larvae from four depth zones (Fig. 9), we can see that individuaIs representing ear1y postlarval stages are
MATSUURA:
SardineZZa brasiZiensis
231Tlf ltEE SP,t"O . ~NG SlA50NS
P[ItCL " T'N TOTAl S P(C' M("'S
:,l-.-.~
.~ ~~~~-o",",~~~,~"",;'~'
i " ,,,,_·~'·~',"~
, 4 ~ 6 1 , ') 'O " '2 ,~ I. 'S '6 " " ,') <'O .. , n
~
.
% 20 10 lO 101 o
GO lO 20 10 10 10 '0'-100", 229151>(0" (015
i _ "., _
1 - .. . _
NO'l e mb e r 1SéS
111
N ov.- Ovc 1970
IV
(10 16 ,nd !; )
lI!
(H5 ",ds J
(103 ""lds) 20 f
ni
ll10 o
rtlh,
=
Q, 20o 10
20
1 o
GO
lO
20
10
20
Figo 9 - Size frequenciesof sardine larvae taken
in different depth zones.
Januar) 1970
111
(i. l. 29 ,,.,ds )
11 (9ó 'od' )
January 1971
IV
I III ,od, )
111 (\91 inds )
I 20 1 O lO 10 GO lO 10 10 20 10
Oecember 1971 V
(1.86 I " d~ )
IV (1 36 0 '''lds )
III
(21j1. il"\ds )
11
(99 I nds )
20
ground in alI directions over the continental shelf and occasionally to the off-continental shelf region.
Data on size frequencies of larvae from each subarea show a tendency of increase in mean length from south to north, but the relationship does not always hold.
Figure 10 indicates that there is a polymodal distribution of larvae in some reg10ns and this suggests that successive spawning may have occurred during the spawning season. Or we can also suppose that a schooling tendency of similar-sized larvae may have caused patches in the sea and this caused a polymodal size frequency in the subarea in which only few samplings were made.
NIGHT/DAY CATCH RATIO
With regard to the night/day catch ratio of larvae, results at the fixed stations gave a value of 32 in 1969 and 615 in 1971 (Matsuura, 1977). In this paper we compare those stations with routine station data for three spawning seasons.
The total number of sardine 1arvae collected during night time exceeded the daytime catch by 4.55 times. To calculate the N/D ratio, the mean numbers of 1arvae per positive station were used (Tab. V). The N/D ratio in the 1969-70 season was higher than that for the other two seasons. The mean N/D ratio for three spawning seasons was 3.93. If we had used the mean number of larvae from alI the stations occupied, the N/D ratio would have increased, because the proportion of positive stations relative to total stations was higher for night hau1s than for day hau1s (night: 67% and day: 41%) •
MATSUURA:
Sardinella brasiliensis
233
TABLE V - Night-Oay catch ratio of the sardine larvae
Day hau1s Night hau1s
Spawning season N/D*
A B C A B C
1969-70 13 347 26.7 19 4291 225.8 8.46
1970-71 14 485 34.6 27 1538 56.9 1.64
1971-72 14 764 54.6 18 1435 79.7 1.46
Total 41 1596 38.9 64 7264 113.5 3.93
A
=
numbers of stations, B=
numbers of 1arvae, C=
mean numbers of 1arvae N/D*=
Night-Day catch ratio of sardine 1arvaeNote: The data from the fixed stations were not inc1uded
Tab1e VI and Figure 11 show the N/D ratio for different 1ength classes of 1arvae co11ected from alI routine stations. Figure 11 shows that the N/D ratio increases exponentia11y with size. A fitted regression, using the 1east squares method, was obtained.
y
=
0.34177 e 0.45196xwhere y
=
N /D ratio and x=
1ength in mm. The N/D ratio for 1arge 1arvae is higher than that observed for Pacific sardine 1arvae (Ah1strom, 1965) and others. Furthermore, the sma11 1ength classes in which 1itt1e avoidance shou1d occur, a1so show va1ues two times higher at night than during the day. Because no 1arge 1arvae (larger than 14 mm) were taken in daytime, a 10w towing speed in vertical hau1s (0.8-1.0 m/sec.) cou1d be the reason for low catches in day hauls, but this does not explain the undersampling of smal1 size 1arvae.TEMPERATURE AND SALINITY ON THE NURSERY GROUND
Spawning of the Brazi1ian sardine occurs ~n she1f waters when water temperature ranges from 16.8 to 27.20
c
and sa1inity ranges from 35.3 too
TABLE VI - Night-Day catch ratio for different size classes of larvae
C1ass Day Night N/D ratio
3.5 237 610 2.57
4.5 461 1160 2.52
5.5 454 865 1.91
6.5 175 1071 6.12
7.5 43 519 12.07
8.5 53 734 13.91
9.5 19 735 38.68
10.5 11 430 39.09
11.5 3 244 81.33
12.5 2 161 80.50
13.5 1 133 133.00
14.5 34
-15.5 29
-16.5 19
-17 .5 1
-18.5 O
-19.5 O
-20.5 6
-21.5 2
-22.5 2
-Total 1459 6755
Note: On1y routine station data were used
Larvae occurred in waters with slight1y higher temperatures and sa1ini-ties (Tab. VII). The mean temperature in the three spawning seasons was
e
23.4 C, but 1arvae were present in the range frem 14.6 to 27.4 C. e In approximate1y 84% of the positive stations the temperature ranged from 21.0 to 26.90C. The highest temperature at positive stations was observed in the 1970-71 spawning season. As recently shown (Matsuura, 1975a) , a warm water mass remained over the continental she1f during this season and spawning was poor compared with the other two seasons. Larva1 abundance was a1so poor in 1970-71.
o
The mean sa1inity at positive stations was 35.6 /00, ranging from 35.0
o
MATSUURA:
SardineZZa brasiZiensis
235
TABLE VI I -
Mean temperature and salinity at10
m deep positive stationsTemperature Sa1inity
(O C) (O /00)
November 1969 20.9 35.8
January 1970 21.8 35.6
1969-70 spawn~ng season 21.5 35.7
Nov.-Dec. 1970 22.9
-January 1971 25.8
-Feb.-Mar. 1971 25.5
-1970-71 spawning season 24.8
-December 1971 22.5 35.6
1971-72 spawning season 22.5 \
35.6
CATCH FREQUENCY
In order to ca1cu1ate a surviva1 curve, alI sardine 1arvae were grouped
~n classes of 2 mm. Factors that affect the size frequency are avoidance by 1arge 1arvae during daytime (C1utter
&
Anraku, 1968; Lenarz, 1973) and escapement of smal1 larvae through mesh apertures (Vannucci, 1968; Lenarz, 1972). The number of 1arvae ~n each 1ength class was plotted against standard length (Fig. 12). Data from the three spawning seasons were pooled to obtain the ploto The figure shows that the number of 1arvae 10nger than 6 mm decreases rapid1y with increase in length. The 4 mm c1ass was repre-sented by fewer 1arvae than the 6 mm class; therefore, the 4 mm c1ass was considered to be reduced by escapement and for this reason was omitted from the calculation of the reduction curve. The curve was fitted by the least squares method:y
=
91915 e -0.4962x2
.
/
- ---~.
'
..
SIZI { ... "' )
Fig. 11 - Night/day catch ratio of
sardine larvae for differ-ent size classes. (AlI samples collected from ro u tine s ta t i o n s) .
»OOr- ---~
"
Fig. 12 - Survival curve of sardine
la rvae.
Obvious1y, surviva1 obtained from this equation does not consider avoidance of 1arge 1arvae and efficiency of the sampling gear; hence the surviva1 in nature wi11 be higher than that implied by the morta1ity coefficient of the equation.
DI
SCUSS I ONMATSUURA: SardineUa brasiZiensis
237
One factor that cou1d affect recruitment is a change of environmenta1 conditions on the spawning and nursery grounds. The change of the environ-mental conditions cou1d direct1y affect surviva1 of eggs and 1arvae: a) through productivity of p1anktonic food in the nursery ground (Nakai, 1960); b) by direct physio10gica1 inf1uence on the morta1ity of eggs and 1arvae
(B1axter, 1969); c) by a change in transportation and/or distribution of the 1arvae (Nakai,
op. cit.);
d) by favoring spawning of a competing species that occupies the same trophic 1eve1 in the ecosystem (Ah1strom, 1965); and e) by favoring sma11 predators such as chaetognaths, carnivorous copepoda etc. (Murphy, 1961). The references cited above have not proved a re1ation-ship between these factors and recruitment, but they have pointed out the possib1e consequences of them.With this in mind, I hope in this paper to examine some critica1 prob1ems regarding the ear1y 1ife history of the Brazi1ian sardine.
The main fishing ground of the sardine extends from Cabo de são Tomé
o o
(22 S) to the south of Cabo de Santa Marta Grande (2920'S), a range of about 1,075 km (580 nm). The main habitat of the sardine is formed by a ha1f moon-shaped pocket of the continental she1f with its maximum width near
San-tos (220 km). Purse seiners in this region usua11y operate in the depth zone 1ess than 50 m, but sometimes they fish in 51-100 m depth zone. We have no re1iab1e information on the distribution of the sardine stock beyond the 100 m isobath, but the resu1t of acoustic surveys on the continental she1f revea1ed few pe1agic fish schoo1s in the offshore region.
Through ichtyop1ankton surveys the main spawning grounds have been 10cated in three areas: Ilha Grande; Santos-Santa Catarina; and Cabo de são Tomé-Cabo Frio. Most spawning takes p1ace a few hours prior to mid-night in the 51-100 m depth zone. Spawning occurs in she1f waters where water temper-ature ranges from 19 to 250C and sa1íníty from 35.0 to 36.00 /00, and where the direct inf1uence of the oceaníc Brazi1 current is sma11. Spawning apparent1y occurs in an area where there is coas tal upwe11íng of c01d water
(Matsuura, 1971).
larvae of
Sardinella anchovia
in the laboratory to 36.8 mm. The larvae re-quired 21 days after hatching to reach 22 mm standard length at a water temperature of 26°C (personal communication).The estimation of total larval abundance, in general, could not be done successfully because of: 1) avoidance of the larvae from the sampling gear and 2) escapement of small larvae through the mesh aperture. Furthermore, avoidance depends on the size of larvae, type of sampling gear, and time of day. The interaction of these factors makes calculation of larval abundance and mortality very difficult. Consequently, ~n this paper we calculated relative abundance of the larvae instead of total abundance and compared the relationship with environrnental conditions.
The size frequency of the larvae revealed that they tend to disperse from the spawning ground ~n alI directions over the continental shelf and show no tendency to be transported in one direction either from north to south or from the offshore to coas tal region. But it is well known that juveniles occur in estuarine regions during autumn and winter and remain there for 6 or 9 months.
In the light of the present results, some questions can be raised. "How do the larvae appear in the coas tal estuary region after dispersing alI over the continental shelf? What ~s the transportation system involved?" We might also ask "It is indispensable for juveniles to approach the coas tal region in which high productivity of food plankton is apparently present?" I f the approach to the coas tal region during the juvenile stage is indispensable to their life history, we could then ask "What would be the mortality rate of the larvae in offshore waters near the edge of the continental shelf (more than 200 km from the coast)?"
MATSUURA:
SardineZZa brasiZiensis
239his rearing experiments clupeids could tolerate a wide range of temperature and salinity.
As shown in the present results, 1arge 1arvae were co11ected not on1y in the coas tal region but a1so in offshore regions and they did not show any sign of starvation. lf there is no active movement of juveni1es to the coas tal region, then we can assume that juveni1es that appear in the estuary are on1y part of the total juveni1e popu1ation and that juveni1es can sur-vive in she1f waters as we11 as in coas tal waters. We observed a 1arge schoo1 of
Euthynnus aZZetteratus
(Scombridae) preying on sardine juveni1es 40-55 mm SL near Laje de Santos (52 km from the coast with 50 m sea depth). This observation supports the hypothesis proposed above.Hoping to obtain information on these prob1ems, we began the second phase of the ichtyop1ankton survey using the Bongos net samp1er which en-ab1es us to co11ect 1arge 1arvae and juveni1es. We hope thus to obtain information which wil1 he1p us to c1arify the prob1ems mentioned above and understand the influence of environmenta1 conditions on recruitment.
RESUMO
o
presente trabalho apresenta a distribuição e abundância de larvas de sardinha-verdadeira,SardineZZa brasiZiensis,
co1etadas nas águas do sul do Brasil no periodo de 1969 a 1971.A abundância relativa de larvas para tres epocas de desova foi calculada usando o metodo apresentado por Smith (1972). De um modo geral, a abundância de larvas de cada subárea coincidiu com a dos QVOS, mas sua distribuição abrangeu uma área um pouco maior do que a dos ovos.
A temperatura media nas estaçoes oceanográficas onde as larvas foram co-letadas, foi de 23,40C, variando de 14,6 a 27,40C. A salinidade media foi de 35,60/00, variando de 35,0 a 36,70 /00.
A razão de captura noite/dia de larvas foi de 3.93. Foi calculada curva de sobrevivência. Foram analisadas a distribuição da freqüência de compri-mentos das larvas e sua distribuição nas d~ferentes profundidades e sub-areas. O resultado mostrou que não há deslocamento de larvas em uma direção única, mas sim uma dispersão da are a de desova para toda plataforma conti-nental. são discutidos alguns problemas sobre a distribuição e migração de larvas e jovens de sardinha-verdadeira.
ACKNOWLEDGEMENTS
I would like to acknowledge the assistance given by various staff members of the Instituto Oceanográfico da Universidade de são Paulo during this study and in the preparation of the manuscript. Special thanks are extended to Dr. Naercio A. Menezes of the Museu de Zoologia da Universidade de são Paulo, for his valuable suggestions on the study and revision of the manuscript. Special thanks are also extended to Dr. E. D. Houde of the Uni-versity of Miami, for his criticaI reading of the manuscript.
REFERENCES
AHLSTROM, E. H. 1965. A review of the effects of the environment of the Pacific, sardine. Spec. Publs int. Commn NW. Atlant. Fish., (6) :53-74. BLAXTER, J. H. S. 1969. Development: eggs and larvae. In: Hoar, W. S. & Randa11, D. J., ed.- Fish physio10gy. New York, Academic Press, vo 1. 3: 178- 252 •
MATSUURA: SardineUa brasiliensis 241
GULLAND, J. A. 1965. Surviva1 of the youngest stages of fish, and its re1ation to year-c1ass strength. Spec. Pub1s int. Commn NW. At1ant. Fish., (6):363-371.
HEMPEL, G. 1963. The causes of changes in recruitment. Rapp. P.-v. Reun. Cons. perm. int. Exp1or. Mer, 154:17-22.
1965. On the importance of 1arva1 surviva1 for the popu-lation dynamics of marine food fish. Rep. Ca1if. coop. ocean1C Fish. Invest., 10:12-23.
HOUDE, E. D. & FORE, P. L. 1973. Guide to identity of eggs and 1arvae of some Gu1f of Mexico c1upeid fishes. Leaf1. Ser., FIa. Dep. Nat. Resour. Mar. Res. Lab., 4(23) :1-14.
- - - ; RICHARDS, W. J. & SAKSENA, V. P. 1974. Description of eggs and 1arvae of sca1ed sardine, Harengula jaguana. Fish. BulI., NOAA-NMFS, 72(4) :1106-1122.
KONDO, K. 1969. Eco1ogica1 studies of 1ife pattern of the Japanese anchovy, Engraulis japonica (Houttuyn) . Bull. Tokai reg. Fish. Res. Lab., (60) : 29-81 •
1974. Eco1ogica1 monograph of the Japanese anchovy,
En-graulis japonica (Houttuyn). The perspective, methodo1ogy, resu1ts and
prob1ems for the future. Proc. Indo-Pacif. Fish. Coun., 15(3) :195-211. LENARZ, W. H. 1972. Mesh retention of 1arvae of Sardinops caerulea
and Engraulis mordax by p1ankton nets. Fish. BulI., NOAA-NMFS, 70(3):
839-848.
1973. Dependence of catch rates on size of fish 1arvae. Rapp. P.-v. Reun. Cons. perm. int. Exp1or. Mer, 164:270-275. MARR, J. C. 1956. The "criticaI period" in the ear1y 1ife history of
marine fishes. J. Cons. perm. int. Exp1or. Mer, 21(2) :160-170.
MATSUURA, Y. 1971. A study of the 1ife history of Brazi1ian sardines,
SardineUa aurita. I. Distribution and abundance of sardine eggs in the
region of Ilha Grande, Rio de Janeiro. Bo1m Inst. oceanogr., S Paulo,
20:33-60.
1975a. A study of the 1ife history of Brazi1ian sardine,
SardineZZa brasiZiensis. 11. Spawning in 1970 and 1971. Bo1m Inst.
oceanogr., S Paulo, 23:1-16.
1975b. A study of the 1ife history of Brazi1ian sardine,
Sardinella brasiliensis. 111. Deve10pment of sardine 1arvae. Bo1m Inst.
oceanogr., S Paulo, 23:17-29.
MAY, R. C. 1974. Larva1 morta1ity in marine fishes and the criticaI period concept. In: B1axter, J. H. S., ed.- The ear1y 1ife history of fish. Ber1in, Springer-Ver1ag,:3-20.
MURPHY, G. I. 1961. Oceanography and variations in the Pacific sardine popu1ation. Rep. Ca1if. coop. oceanic Fish. Invest., 8:55-64.
NAKAl, Z. 1960. Changes in the popu1ation and catch of the Far East sardine area. Wor1d Sci. Meeting Bio1. Sardines and Re1at. Spec., 3, Stock & Area Paper, (5) :807-853.
O'CONNELL, C. P.
&
RAYMUND, L. P. on surviva1 and growth of ear1y anchovy(EngrauZis mordax
Girard) Eco1., 5:187-197.1970. The effect of food density post yo1k sac 1arvae of the northern in the 1aboratory. J. exp1 mar. Bio1.
RlCHARDS, W. J.; MILLER, R. V. & HOUIE, E. D. 1974. Egg and 1arva1
deve10pment of the At1antic thread herring,
Opisthonema ogZinum.
Fish. BulI., NOAA-NMFS, 72(4) :1123-1136.SMITH, P. E. 1972. The increase in spawning biomass of northern anchovy,
EngrauZis mordax.
Fish. BulI., NOAA-NMFS,70(3) :849-874.
UNESCO. 1968. Report of lCES-SCOR-UNESCO Symposium of hydrodynamics of p1ankton samp1ers and the meeting of working party 3. Monogr. oceanogr. methodo1., (2) :160-163.
VANNUCCl, M. 1968. Loss of organ1sms through the meshes. Monogr. oceanogr. methodo1., (2) :77-86.
MATSUURA:
SardineZZa brasiZiensis
243
APPENDI X - Occurrence of sardine larvae
Cruise of November 1969
Samp1e Time Position Ilepth No. of Volume of Towing No. of Date
number (h)
Lat. (S) Long. (W) (m) larvae water (1) depth (m) 1arvae /m2 • 232 21/11 12:10 23°00' 41°51' 64 3 292 60 0.6 236 21/11 21:45 23°36' 5 42°16' 313 49 102 80 38.4 238 22/11 00:35 23°18'5 42°24 ' 119 1 105 80 0.8 239 22/11 03:20 23°00 ' 42°33' 52 1 41 45 1.1 240 22/11 08:00 23°46' 42°46'5 224 4 185 80 1.7 244 22/11 19:10 23°28'5 43°29'5 105 23 116 80 15.9 245 23/11 00:00 23°51'5 43°19 ' l30 2 143 80 1.1 269 24/11 19:10 23°14' 44°12' 43 13 47 70 19.4 271 25/11 02:45 23°43' 44°30'5 74 15 59 70 17.8 279 25/11 23:00 23°39 ' 45°07' 31 2 38 30 1.6
Cruise of January 1970
282 06/01 14:05 23°15' 41°45' 120 45 107 80 33.6 283 06/01 16:40 23°34' 41 ° 36 , l36 3 23 80 10.4 288 07/01 15:20 23°57' 41°46' 1.000 2 78 90 2.3 291 08/01 03:00 23°19' 42°25 ' 112 30 59 80 40.7 292 08/01 07:00 23°00' 42°30' 56 15 52 55 15.9 296 10/01 14:45 23°26 ' 42°55 ' 114 1 82 80 1.0 309 12/01 03: 15 23°32' 43°27' 114 242 112 80 172.9 310 12/01 10:05 23°08' 43°38' 48 155 41 50 189.0 311 12/01 16: 30 23°16' 44°09' 50 5 50 50 5.0 312 12/01 23:00 23°35' 44°01' 86 92 62 80 118.7 313 l3/01 02:30 23°54 ' 43°56' l31 1.085 97 80 894.8 314 13/01 06: 20 24°10' 43°52' 210 1 83 80 1.0 326 15/01 05:00 24°03' 44°27' 125 243 111 80 175.1 328 15/01 09:40 23°44' 44°30' 70 8 48 60 10.0 330 15/01 15:55 23°25' 44°39' 42 2 32 40 2.5 333 15/01 22:45 23°58' 44°58' 72 6 68 70 6.2 334 16/01 00:45 24 ° 00 , 44 ° 57 , 72 109 64 70 119.2 335 16/01 01:10 24°01' 44°56' 72 880 121 70 509.1 336 16/01 01:25 24°03' 44°55' 72 956 39 70 1715.9 337 16/01 01:50 24°05' 44°54'5 72 267 56 50 238.4 338 16/01 02: 10 24 ° 07 , 44°54' 72 275 74 70 260.1 339 16/01 06 :15 24 ° 16 , 44 ° 49' 108 103 27 80 305.2
Cruise of November-Ilecember 1970
482 28/11 09:50 22°00' 40°35 ' 44 3 58 40 2.1 483 28/11 16:00 22°04' 40°09 ' 105 3 147 80 1.6 485 30/11 18: 35 22°22' 41 ° 07 , 42 1 39 35 0.9 486 30/11 22:15 22°16' 41°20' 22 2 12 20 3.3 49l 02/12 03:00 23°20' 42° 37' 105 97 48 80 161.7 492 02/12 08: 20 23°03' 42° 47' 56 6 43 50 7.0 495 02/12 22: 35 23°40' 43°25' 120 76 76 80 80.0 496 03/12 04:10 24°05' 43°25 ' 205 39 71 80 43.9 503 04/12 12:30 23°54' 44°54' 66 2 61 60 2.0 504 04/12 17:30 240l3' 44°51' 92 10 71 80 11.3
505 04/12 20: 25 24°38' 44°48' 140 218 63 80 276.8 508 05/12 14:05 24 ° 4 7' 45°34 ' 80 403 77 75 392.5 509 05/12 18: 30 24 ° 27 , 45° 46' 64 540 64 60 506.3 510 05/12 23:05 24 °07 , 46°51' 42 n 39 35 65.5 518 07/12 17:15 25°59' 47°15' 81 4 66 75 4.5 520 08/12 01:35 25°20' 47° 42' 75 5 20 20 5.0
Y • number of sardine larvae per square meter
* y d.x d - tOlo/ing depth
v x - number of 1arvae collected
APPENDIX - Occurrence of sardine larvae (cont.)
Cruise of January 1971
Sample Time Position Depth No. of Volume of Towing
Date No. of
number (h)
Lat. (S) Long. (W) (m) larvae water (1) depth (m) larvae/m2* 531 16/01 05:00 23°07' 43°09' 58 18 46 50 19.6 535 16/01 18:50 23°32' 43°32' 114 '3 65 80 3.7 536 16/01 21:40 23°14' 43°40' 57 19 42 50 22.6 537 17/01 04:55 23°13' 44°17' 43 19 27 38 26.7 538 17 /01 11 :10 23°32 ' 44°08' 69 12 62 70 13.5 542 17/01 22:15 24 ° 07 , 44°28' 133 4 82 80 3.9 543 18/01 01:00 23°44' 44°36' 70 21 59 65 23.1 544 18/01 03:10 23°35' 44°40' 51 47 41 42 48.1 545 18/01 06:30 23°26' 44°45' 40 3 25 35 4.2 546 18/01 09:15 23°33' 45°00' 36 2 27 30 2.2 548 18/01 13:35 23°46' 45°11 ' 35 7 49 30 4.3 549 18/01 18:25 23°57' 45°06' 58 5 45 55 6.1 550 18/01 19:40 24 ° 07 , 45°02 ' 74 15 56 70 18 . 8 551 18/01 22:30 24 ° 25 , 44°54' 112 33 73 80 36.2 552 19/01 01:00 24°44' 44°44' 154 1 69 80 1.2 554 19/01 05:50 24 ° 36 , 45°20' 86 49 70 80 56 .0 604 20/01 20:15 23°50' 45°40' 21 1 13 15 1.2 607 21/01 03:00 24°14 ' 46°10' 39 129 38 35 118.8 608 21/01 04:55 24°24 ' 46°05' 50 87 46 45 85.1 611 21/01 15:00 25°19' 45°41' 116 25 153 60 9.8 612 21/01 17:45 25°32 ' 46°10' 128 1 69 80 1.2 613 21/01 21 :10 25°14' 46°19' 81 2 89 80 1.8 614 22/01 00:40 24 ° 55 , 46°27 ' 62 7 73 55 5.3 615 22/01 03:30 24°37' 46°35' 45 27 62 39 17.0 616 22/01 09:00 24°18' 46°44' 22 4 27 15 2.2
Cruise of February-March 1971
617 27/02 08:45 28°49'5 49°07'5 34 4 39 30 3.1 618 28/02 01:15 28°56' 48°51' 60 23 64 55 19.8 622 28/02 22:25 28°25 ' 48°01' 105 4 107 80 3.0 623 01/03 01:40 28°20' 48°26' 79 3 73 75 3.1
641 05/03 10:05 24 ° 24 , 46°18' 45 4 - 40
-642 05/03 15:00 24 ° 49' 46°01' 66 1 - 60
-646 06/03 13:00 24°38' 45°05' 102 1 - 80
-647 06/03 16:50 24°20' 45°12' 78 1 - 75
-651 07/03 13:45 23°44' 44 ° 36 , 65 1
-
60 -666 10/03 15:30 22°31 ' 41°48' 32 8 - 25 -668 11/03 01:35 22°53' 41°08'5 87 7 - 80-670 11/03 15:30 22°30' 41°35' 120 1 - 80
-671 11/03 20:00 22°16' 40°50' 60 2 - 55
-Y - number af sardine larvae per square meter
* y .~ d • towing depth
v x - number af larvae collected
MATSUURA:
SardineUa brasiZiensis
245
APPENDIX I - Occurrence of sardine larvae (cont.)
Cruise of December 1971 (Vertical hau1)
Samp1e Time Position Depth No.of Towing No. of
number Date (h) (m) 1arvae depth (m) larvae/m2
Lat. (S) Long. (W)
680 11 /12 19:00 25°49' 47°58' 37 10 32 11.1
682 11 /12 20:00 26°02'5 47°41'5 58 237 50 263.3
684 11/12 22:15 25°49' 47°26' 61 137 56 152.2
686 12/12 00:45 25°35' 47°39' 45 16 40 17.8
696 12/12 19:15 25°18' 46°58' 60 59 55 65.6
698 12/12 21 :30 25°01' 47°08' 42 27 37 30.0
706 13/12 11 :00 25°04' 46°44' 60 6 60 6.7
708 13/12 14:15 25°32' 46°38' 100 206 95 228.9
710 13/12 17:25 25°09' 46°19' 76 136 80 151.1
712 13/12 20:05 24°49' 46°20' 62 436 55 484.4
714 13/12 22:30 24°29' 46°26' 47 31 42 34.4
718 14/12 06:30 24°02' 46°10' 17 3 12 3.3
722 14/12 12:15 24°41' 46°04' 63 14 60 15.6
724 14/12 14:50 25°00' 46°00' 82 65 80 72 .2
726 14/12 17:15 24°50' 45°41' 80 244 75 271.1
727 14/12 19:10 24°30' 45°45' 67 9 42 10.0
729 14/12 21:30 24°10' 45°48' 50 120 45 133.3
731 15/12 00:25 23°50' 45°52' 23 86 20 95.6
733 15/12 03:25 23°54' 45°31' 33 4 28 4.4
761 16/12 09:15 24°18' 45°05' 82 2 77 2.2
765 16/12 12:50 23°52' 45°10' 39 8 36 8.9
771 16/12 20: 30 23°46' 44°51' 55 65 50 72 .2
773 17/12 01:50 24°07' 44°49' 92 44 80 48.9
777 17/12 07:20 24°08' 44°31' 130 1 80 1.1
779 17/12 10: 25 23°42' 44°30' 72 4 70 4.4
783 17/12 15:40 23°08' 44°28' 31 6 26 6.7
787 17/12 20:55 23°33' 44 ° 11 , 72 45 65 50.0
789 18/12 01:05 23°53' 44°07' 56 10 115 11.1
793 18/12 06:50 23°26' 43°51' 82 45 77 50.0
797 18/12 12:50 23°06' 43°32' 37 24 35 26.7
803 18/12 20:30 23°35' 43°05 ' 122 77 115 85.6
805 18/12 22: 35 23°20' 43°08' 104 22 80 24.4
APPENDIX - Occurrence of sardine larvae (cont.)
Cruise of December 1971 (Horizontal hau1)
Samp1e Time Position Depth No. of Volume** No. of
Date of fi1tered
number (h)
Lat. (S) Long. (w) (m) larvae water (m') larvae /100 m'
681 11 /12 19:15 25°49' 47°58' 35 6 ( 232) 2.6
683 11 /12 20 :17 26°02'5 47°41'5 58 272 ( 232) 117.2
685 11 /12 22:45 25°49' 47°26 ' 61 248 ( 232) 106.9
687 12/12 01 :45 25°35 ' 47° 39' 45 48 ( 232) 20.7
693 12/12 13:54 25°16' 47°26 ' 38 30 ( 232) 12.9
697 12/12 19:32 25°18' 46°58' 60 1845 ( 232) 795.3
699 12/12 22:03 25°01' 47°08' 42 35 ( 232) 15.1
701 13/12 01:37 24°40' 47°16' 19 10 ( 232) 4.3
703 13/12 05:30 24°26' 46°54' 24 10 ( 232) 4.3
705 13/12 08:21 24°45' 46°50' 42 1 ( 232) 0.4
707 13/12 11: 10 25°04' 46°44' 60 2 ( 232) 0.9
711 13/12 17:45 25°09 ' 46°19' 76 292 ( 232) 125.9
713 13/12 20: 12 24°49' 46°20' 62 3186 ( 232) 1373.3
715 13/12 22:45 24 ° 29' 46°26' 47 649 ( 232) 279.7
717 14/12 03:55 24°10' 46°30' 22 7 (232) 3.0
721 14/12 09:37 24 ° 22 , 46°08' 45 41 ( 232) 17.7
723 14/12 12:40 24 ° 41' 46°04' 63 89 ( 232) 38.4
725 14/12 15:05 25°00' 46°00' 82 20 ( 232) 8.6
728 14/12 19:26 24 ° 30' 45°45' 67 149 (232) 64.2
730 14/12 21:40 24 ° 10 , 45° 48' 50 1784 ( 232) 769.0
732 15/12 00:34 23°50' 45°52' 23 402 ( 232) 173.3
734 15/12 03:41 23°54' 45°31' 33 24 ( 232) 10.3
760 16/12 07:02 24°33' 45°24' 77 127 ( 232) 54.7
766 16/12 13:00 23°52' 45°10' 39 23 ( 232) 9.9
770 16/12 17: 55 23°26 ' 44°55' 30 1 ( 232) 0.4
772 16/12 20:35 23°46' 44°51' 55 2982 ( 232) 1285.3
774 16/12 01:55 24 ° 07 , 44°49' 92 132 ( 232) 56.9
778 17/12 07: 35 24 °08' 44 ° 31 , 130 2 ( 232) 0 . 9
780 17/12 10:40 23° 42' 44°30' 72 3 ( 232) 1.3
782 17/12 13:15 23°24' 44 ° 34 ' 40 26 ( 232) 11 .2
784 17/12 15:50 23°08' 44°28' 31 55 ( 232) 23.7
786 17/12 18: 07 23°13' 44°15' 42 2 ( 232) 0.9
788 17/12 21: 05 23°33' 44 °11 ' 72 284 ( 232) 122.4
790 18/12 01:32 23°53' 44°07' 117 83 ( 232) 35.8
792 18/12 04: 25 23°46' 43° 47' 118 15 ( 232) 6.5
794 18/12 07: 16 23°26' 43°51 ' 82 13 ( 232) 5.6
796 18/12 10:26 23°06' 43°55 ' 30 2 ( 232) 0.9
798 18/12 13:02 23°06' 43° 32' 37 22 ( 232) 9.5
800 18/12 15:45 23°25' 43°28' 100 1 ( 232) 0.4
804 18/12 20: 52 23°35 ' 43°05 ' 122 21 (232) 9.1
806 18/12 23:02 23°20 ' 43°08' 104 187 (232) 80.6
808 19/12 00:39 23°06' 43°11' 56 14 ( 232) 6.0
MATSUURA: SardineZZa brasiUensis
247
APPENDIX II - Occurrence of sardine larvae at fixed stations (Vertical hauls)
Positio n
Dep t h Mean no. Df Towi ng
Cr uise Day Ti me Number Mean water Mean no. cf
Lat. (5) Lo n g . (W) (m) larv . /haul hauls vai. (m 3) dep th (m) larv./m'
23 . 24 Nigh t 257 6 137 70 134
Nov. ' 69 23°32 ' 44°04 ' 78
24 Day 9 6 115 70 5
19 . 20 Nigh t 392 11 116 60 203
Jan . ' 71 24°18 ' 45°28 ' 65