ISSN 1549-3636
© 2012 Science Publications
Corresponding Author: Mohammad Syuhaimi Ab-Rahman, Department of Electrical, Faculty of Engineering and Built Environmental, Electronics and System Engineering, University Kebangsaan Malaysia, 43600 UKM Bangi, Selangor, Malaysia
398
Risk Reduction in Operations, Maintenance
and Application for Customer Access Network
1,2
Mohammad Syuhaimi Ab-Rahman,
1Siti Asma Che Aziz,
1,2
Kasmiran Jumari and
1Nurain Izzati Shuhaimi
1Department of Electrical, Electronics and System Engineering,
Spectrum Technology Reseach Group (SPECTECH),
Faculty of Engineering and Built Environmental,
2Institute of Space Science (ANGKASA),
University Kebangsaan Malaysia,
43600 UKM Bangi, Selangor, Malaysia
Abstract: Problem statement: This study highlight on restoration scheme proposed against failure in working line at the drop region for Fiber-To-The Home (FTTH) with a Passive Optical Network (PON). Whereas PON is a system that brings optical fiber cable and signals all or most of the way to the end user. In this study we highlighted the issue on survivability scheme against failure which is focused scattered residence architectures. Approach: Two type of restoration scheme is proposed by means of linear protection (tree) and migrate protection (ring). Our proposal scheme is inexpensive and applicable to any residence architecture (ordered placement and scattered placement). The advantage of this scheme is the failure at fiber line can be recovered until two levels to make sure the optic signal flow continuously. FTTH based network design is simulated by using OptiSystem 7.0 in order to investigate the power output and BER performance at each node in the tree and ring protection scheme in scattered placement to prove the system feasibility. Results: The simulation analysis for output power in a linear protection path produced almost same output power for all optical nodes regardless of the position and situation of the node. In linear protection, signal is split by optical splitter and did not having loss of power at each node. Thus the percentage adjustment on the coupling is obtained where; the average output power measured at the receiver is at -28.4206 dBm. While the signal for ring path is optimized by adjusting the loss ratio (n%) and transmit it (1-n%) in the optical coupler. Also found that; an average output power is -23 dBm only. A simulation of distance accessibility is increased with the increasing of sensitivity that used for the linear path and ring path. Conclusion: This study suggests the migration of tree to ring topology to enable the signal flow continuously in the case of failure occurs specifically in random or scattered placement topology. Our proposal is the first reported up to this time in which the upstream signal flows in anticlockwise in ring topology when the restoration scheme activated.
Key words: Tree topology, ring topology, scattered placement, restoration
INTRODUCTION
Safety and Survivability in FTTH network is an important issue. It has been discussed in optical network by earlier studies. When a network transfers more data, the total interruptions due to network failure or attack become important issue for consideration (Rejeb et al., 2010). Therefore, many authors proposed the new technique and method to give the protection and restoration the fiber region area especially scattered placement to become a good signal transfer without failure. Most of the proposal chooses the alternative
path line to carry the optical signal when the failure is occur in the other line (Han et al., 2007).
399 Therefore in our proposal, the downstream signal will go through the main fiber in a linear path (tree line) and the signal goes through an optical splitter, to distribute power into multiple recipients. Hence, under normal conditions without failure, the optical signal flows through the working line, but if failure occurs in working line, protection line will be activated. Subsequently, the signal enters the optical coupler and a signal in here will be divided according to the percentage of 1-n% for the pass signal component; n% is the portion of drop signal component. The drop signal will be dropped directly to the recipient. Thus, the ratio of signal power will be small and it is enough to be accepted by receiver.
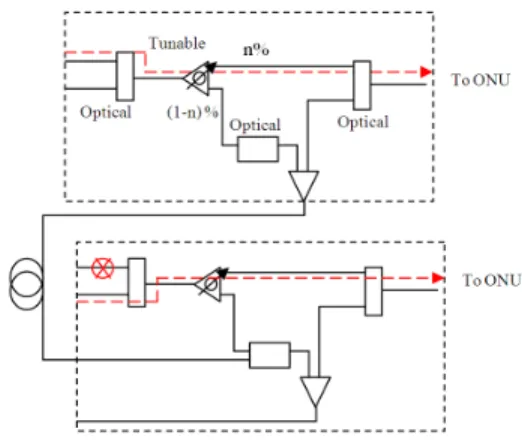
Elliot wave Prechter 1994, explained about zigzag theory that being used for mechanism protection with various fall-outs (multi drop) by connecting every working and protection line in Customer Access Protection Unit (CAPU) the authors group designed. According to Aziz et al. (2009), CAPU is a protection against fiber fault in fiber line that will also being placed in customer end-user in order to perform as the smart restoration if there is uncertainty of fiber cut occurring in distribution region. Figure 1 shows two restoration scheme proposed to cater the breakdown problem occurs in the FTTH-PON. In tree topology, each line connected to ONU is installed with pair fiber. If the working line fails, the traffic will be switch to the protection (stand by) fiber (Fig. 1a). If the major problem happens in the network such as cable cut, device dysfunction and others, the only way is to migrate the topology from tree to ring by means of migrated protection as shown in Fig. 1b.
Related research: For comparison, there are two options proposed in the study of Langer et al. (2004). First, by doubling the transceiver and installing new fiber to create a separate password associated with the user. Second, is by increasing the overall network access if customers demanded higher. However, by doubling the transceiver at both ends and has two separate fiber routes the center will provide a less economical for the network. So, for this research, simulation analysis for the linear protection path has produced the output power almost the same for all optical node, regardless the position of the node. The linear protection signal is separate by splitter and the power dropped it not occur at each optical node. Signal for ring path become optimum with adjusting drop signal (n%) and pass signal (1-n%) at optical coupler. From the observation, the average output power is -23dBm.
(a)
(b)
Fig. 1: Two restoration schemes are proposed and be activated according to the types of failure in FTTH-PON (a) Linear Protection (b) Migrate Protection
In a ring network topology, the protection scheme from Zhao et al. (2005) has a large conventional ring and backup transceiver which used to protect the damage at one point. Among the disadvantages in a ring topology is use a lot of fiber, attenuation of the signal is high and several other long-term problems. To solve this problem, authors used the feeder fiber coupling with a small ring hybrid which was introduced in the study (Hossain et al., 2005). This scheme minimizes the function of fiber and ensures that no data packets are lost with the components ready to standby. However, the ONU is more complex in this scheme and 1 +1 protection scheme has a low market performance due to high costs. In addition, the study (Hwang et al., 2009) proposed protection scheme through a close partnership with the PON-ONU to avoid over bridge device in the EPON network. In addition, the proposed network coverage provides network access to large-sized mesh and access networks capable of high accessibility and a fast recovery (Langer et al., 2004).
Generally for EPON FTTH network, it does involve relatively high data rates of 1.25 Gbps to obtain the minimum bit error rate of 10-9. So, according to standard IEEE 802.3ah EPON protocol budget authority, this architecture design of protection and restoration FTTH-PON is at 26dB by PX-20D for the fiber length of 20 km.
At present, the scheme of protection for future generations also aims to implement protection mechanisms 1: N because is more efficient that require the use of optical switches 1×N (Zalevsky and Appelman, 2004). The basic concept of switching is often used for opto-mechanical technology. The study of Han et al. (2007) also proposes hybrid architecture to protect the failure protection in WDM-PON multipoint and network design is by a full duplex configuration. In which all areas, including fiber module is equipped with redundant (duplicate full) and two working fibers and protection fibers are used during normal conditions. However, protection scheme of Chan et al. (2003) proposed network architecture based on WDM protection that will provide protection against damage to the fiber bidirectional 1:1 between the Remote Node (RN) and the ONU. If damage occurs online, which carry data signals are transferred via the adjacent ONU protection under the proposed scheme.
MATERIALS AND METHODS
Scattered protection design: The designed network protection scheme is a combination of the linear and ring protection. Then the simulation analysis is conducted from node to node and is divided into two main parts, namely linear and ring protection schemes. Each part of the protection scheme has been reviewed. The output power for each node has obtained in the normal state (without failure). The maximum distance that can be achieved with the sensitivity of every different protection schemes and also the maximum number of node is depending on the different of sensitivity. Sensitivity values are used for the node to node analysis which start at -25, -30,-32 and -35dBm.
Figure 1a shows design of the linear feeder route for tree topology or linear network. The wavelength 1550 and 1490 nm will be multiplexed to get through network protection. CAPU was designed with four alternative routes protection to transfer optical signal if line is breakdown. Two major lines are proposed in this network architecture for tree and ring topology. Both major lines are combined in this CAPU. According to Fig. 1a, the optical signal from feeder region will be split by 1×5 optical splitter where it used to reach the five number of ONU. Before reaching to the ONU, optical signal must passing and will be divided
according to percentage in every node optic. Optical node consists of optical switch, optical coupler, optical circulator and demultiplexer.
Figure 1b indicates optical node components which bring signal for linear path. If both of working and protection line are failure, ring line will be activated. The ring protection scheme can also be called Migrated Protection. Signal from ring line will flow through major fiber and optical coupler. Here, signal will be divided into 2% of power; 1-n% pass signal and n% drop signal. Drop signal enter to optical switch 2×1 and optical circulator. Drop signal will be dropped directly to the receiver and the ratio of signal power is small enough to be accepted on a receiver. The pass signal will transfer to the optical node (signal out). Optical signals out from the previous node will be the input signal to the optical node and the next optical node. According to Fig. 1b, drop signal from optical coupler with ratio n% will transfer through optical switch 2×1 and receiver using optical circulator. Pass signal flow into optical switch 2×2, where the optical switch control with ACS to choose which line will be activated. Signal flow from node to node (ring line) also has 2 line fibers. ACS controlled all the optical switch function to change path.
Two major fiber was placed on two lines; tree and ring line. Each linear path (tree line), working line will be duplicated with protection line. Protection line will be used in the event of any failure to the working line. Ring line is also equipped with two lines for each optical node which are protection and working line. Then the optical signal will have four alternative routes that will be selected to carry the optical signals to each receiver. Both linear and ring protection scheme used Optical Line Terminal for downstream and upstream signal transmission.
401 Fig. 3: The flow of optical signals under normal
conditions if no breakdown to the linear line
Therefore in normal condition, it indicates that linear line terminal would transfer downstream signal into linear line (as illustrated in Fig. 2 and 3, where it shows the flow of optical signals when there is no breakdown to the working and linear line). Thus, ring line terminal is static and not activated untill failure has passivate the connection through tree-based topology. In this case, the ring protection scheme or migrated protection has to be activated.
RESULTS
Output power for each node of linear protection scheme: Signal flows through linear protection and then joins into optical coupler. After that, it will be divided into two signals; one pass signal and the other drop signal. For the analysis of this case study, the first optical coupler is adjusted to a ratio of 50:50% which is 50% for drop signal and 50% for pass signal. The 50% pass signal will be combined with a new signal from the next optical node. Then, after observing the performance each optical node output power, the ratio of the optical coupler always make change to obtain optimum output power for each receiver at the optical node. The pass signal (1-n) % drop signal of n% is adjusted.
In the design of linear protection, signals through linear protection line would not have power dropped when they flow from optical node to other optical nodes until the last node. This is because the power of optical signal will be split to each node. It will be in effect when transmitted input power to the Optical Line Terminal (OLT) separate by optical splitter upon entering each optical node. In contrast to the ring network, the power output by each node is expected to shrink by follow the position of the optical node.
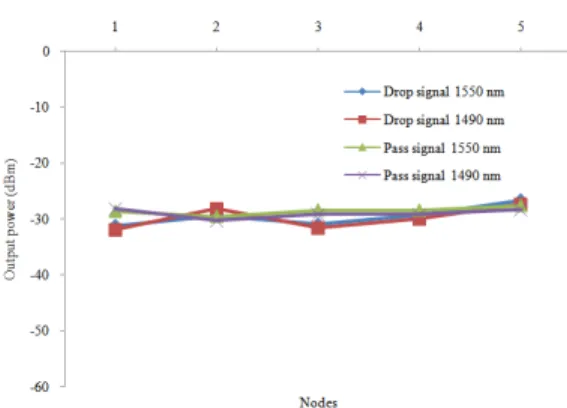
Fig. 4: Output power for the 5 nodes; drop signal and pass signal (1550 nm and 1490 nm)
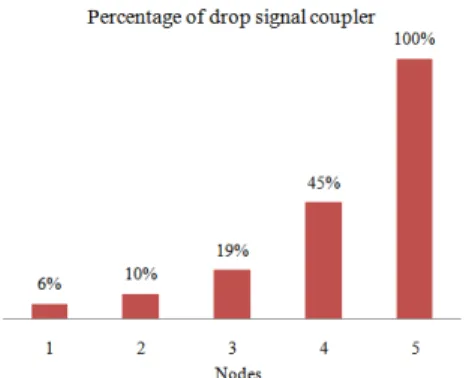
Fig. 5: Percentage of optical coupler ratio adjust for linear path protection scheme.
Figure 4 shows the output power of two wavelengths (1550 and 1490 nm) respectively at a signal pass and loss when the coupling ratio was adjusted to 50: 50%. Lower output power of drop signal is at the first node, -31.228 (1550) and -31.978 dBm (1490 nm). This may be due on the first node that does not have the power combination of the optical coupler on the previous node and make it the lowest power than the other optical nodes. The lower pass signal occur at second node is -29.593 (1550) and -30.343 dBm (1490 nm). From the present output power, the receiver sensitivity can be carried on -32 dBm for linear protection scheme when the optical coupler is adjusted to 50: 50% for the signal pass and drop.
Fig. 6: Power output for the 5 nodes; pass and drop signal (1550 nm and 1490 nm) when the ratio of the coupler is adjusted at randomly
Fig. 7: As both lines on the linear network is breakdown, then the ring protection line will be activated
When the pass signal goes high at the second optical node (pass signal 1490 nm) then, at the same time, signal goes high at the first optical node -34.656 dBm (1490 nm signal to go). From the drop signal output power, the sensitivity would be reduced to -31dBm. Therefore, by adjusting the ratio of the coupling, 1dBm sensitivity could be reduced.
Output power for each node ring protection scheme: Signals through linear protection line will join optical coupler and will be divided into two signals; pass and drop signal. For the ring protection schemes, the signal will be decreased when go through the optical nodes. Thus, research on the power divisions of the coupling was carried out to obtain the optimum power output. Signals in the coupler must be adjusted according to drop signal (n%) and the pass signal is (1-n%), as illustrated in Fig. 7.
Fig. 8: Output power for the 5 nodes; pass and drop signal (1550 nm and 1490 nm) when the ratio of the coupler is adjusted to 95:% (95% pass signal and 5% drop signal)
Fig. 9: Power output for the 5 nodes; pass and drop signal (1550 nm and 1490 nm) when the ratio of the coupler is adjusted to 90: 10 (90% pass signal) and (10% drop signal)
At the first, power division’s analysis is set at (n, 1-n) where ‘n’ is 5%. Therefore, the signal drop is 5% of the total power. Figure 8 shows the output power of each optical node for the pass signal (1490 nm and 1550 nm) and drop signal (1490 and 1550 nm). As expected, the lower power signal reveal at the last optical node is -32.53(1550) and -33.28dBm (1490 nm). It was found that the output power for both types of signals will decrease steadily when passing through the whole of optical nodes. This occurs when the signals flow through the optical node depends on the diminution of power.
403 Fig. 10: The percentage ratio of the optical coupler for
all optical nodes
Fig. 11: Output power for the 5 nodes; pass and drop signal (1550 nm and 1490 nm) when the coupler ratio adjust at various amounts
Simulation of the coupler by adjusted the ratio has been done. The aim is to obtain optimum output power and reducing the power depreciation especially at the last optical node. Setting coupling ratio parameter to be same ratio for all optical nodes is uneven because a different position of the optical nodes in the ring structure also contributed to the various amount of power loss and reduced the number of ONU (Yeh and Chi, 2008). Thus, the ratio for each coupler is changed randomly to make sure the output power obtained for all optical nodes is at the optimum level.
Optimization to obtain the ratio of the coupler on the power set could be done with the extraction method of parameters in the simulation. Extraction of parameters is using parameter optimization method in which the ratio of the optical coupler will be extracted to obtain the specific output power. Optimization will find the ratio of the optical coupler to achieve an output of the power meter as required. The Multiple Parameter Optimization has been carried out if the number of optical nodes exceeds one. At the result, the ratio of the optical nodes coupler will always change to obtain the specific output power by using OptiSystem.
Figure 10 shows the percentage ratio of an optical coupler when the output power constant at -23 dBm. In simulation, the ratio percentage can be defined by parameter extraction method. The value of -23 dBm is selected as the maximum output power would be achieved to reach the satisfactory operation of all optical nodes. If the power prescribed is less than -23 dBm, the power is not sufficient to meet all nodes requests because signals go through optical nodes had divided across the nodes. Due to adjustment, the outcome average output power was -23 dBm by inserting five nodes in the optical network.
Figure 11 shows the output power of each pass and drop signal nodes. Equal output power could be obtain from drop signal. It occur when the optical coupler is adjusted to reach optimum output power and for all each optical nodes. The last node pass signal is adjusted to -100dBm because there is no next node to transfer the optical signal.
Total distance of network scheme protection: Simulation is carried out to study the maximum distance that can be achieved to access linear protection and ring protection path. This analysis is to examine the maximum distance that can be achieved through the design of safety schemes with the combination of linear protection and ring protection. Further discussion ill be divided into two, which are linear protection and ring protection. Each section will evaluate the output power of distance (km) that can be achieved in each of the optical path and therefore, sensitivity can be determined by available output power.
The achieved maximum distance was evaluated as the receiver sensitivity is set at -25, -30, -32 and -35 dBm. The assessment of maximum distance that can be achieved at maximum Q factor of 6 is given by BER analyzer on OptiSystem software. If reading of minimum quality factor Q is equal to 6, then at a certain distance, there is where the maximum distance can be achieved by protection path. Specifications used for the simulation are as follows:
Network specification:
• Signal launch power = 0 dBm
• Data transmission rate = 1.25 Gps for directional decreased (EPON standard)
• Sensitivity of photosensitive = -25, -30, -32, -35 dBm
Fig. 12: Output power (dBm) versus fiber length (km) for all optical nodes (up to optical nodes of 5) for the signal loss
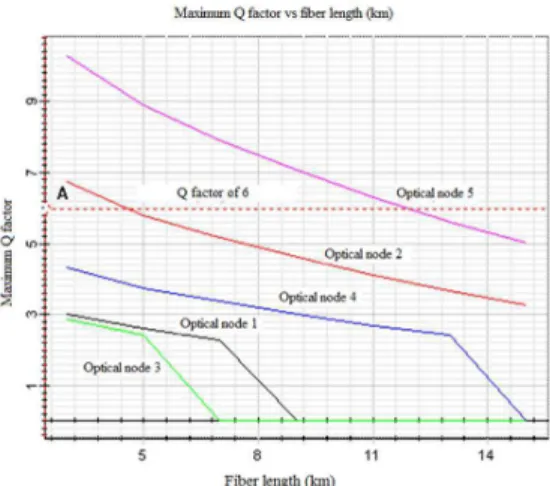
Fig. 13: The maximum value of Q factor for the signal loss at -25 dBm for all optical nodes
Fig. 14: Output power (dBm) versus fiber length (km) for signal loss
Linear path (tree topology): Maximum distance analysis is started by examining the distance on a linear path. This linear route will be divided into two main sections when the coupling ratio adjustment is set at 50: 50% and the ratio of variable coupling. Performance on these both conditions is compared according to the maximum distance that can be achieved.
Ratio of linear path optical coupling with ratio of signal path and signal loss at 50%: 50%: Adjusted distance varies from 10-120 km. Figure 12 shows the output power when the fiber length is given at that distance for the signal loss. Power output decrease linearly with the increase in fiber length (km). It is found that; the highest output power achieved at optical node 5 and the lowest output power at first optical node. There is a difference of 5.2324 dBm between the first optical node and optical node 5. Considering the optical node 5, the output power of 25, 30, 32 and -35 dBm are respectively with the fiber length at a distance of 11, 35, 46 and 61 km. By considering the first optical node, the output power at -30, -32 and -35 dBm obtain their fiber length at a distance of 9, 18.6 and 33.6 km, respectively. Thus to achieve high range on the network, a wide dynamic range required in the receiver. Figure 13 shows the maximum value of Q factor that has been achieved for each node as the percent ratio at the sensitivity of -25 dBm. Found that, the optical node 5 has the highest reach of distance compared to other nodes which is 12 km (at the sensitivity of -25 dBm) and 4.4 km maximum distance has been achieved for the second optical node. While other nodes severely decreased the value of Q factor and cannot reach the factor of 6. This is due to insufficient sensitivity of the receiver when power loss occurs in the following nodes is too high. Also found that, the values of Q factor decreases exponentially with the increasing of fiber length.
405 at -30, -32 and -35 dBm find their respective fiber length at a distance of 13.6, 23.75 and 39.1 km. From these results, only a total of 1 km can be improved from the adjustment of ratio on the optical coupler. The output power for optical node could be improved in slightly compared to case before.
Figure 15 shows the maximum value of Q factor that has been achieved for each node as the variable percent ratio being changed and that Q factor is obtained at -25 dBm sensitivity. Found that, the optical node of 5 has the longest distance compared to the other nodes which is 12 km (at the sensitivity of -25 dBm). The other nodes got decreased severe Q factor and cannot reach the value of Q factor at 6.
The simulation was continued by increasing the receiver sensitivity at -30 dBm; where it is done to determine the maximum distance that can be achieved for each optical node. This is important to predict the distance that can be achieved in different sensitivity in linear range. Figure 16 shows the distance that can be achieved at -30 dBm of sensitivity. As expected, the maximum distance can be increased for each of receiver. Based on the minimum line of Q factor for each optical node, the distance is found to be at 17.62, 24.375, 26.411 and 40.35 km respectively to the optical node 2, optical node 3, optical node 4, optical node 1 and optical node 5.
The sensitivity is then increased to -32 dBm for case of variable percent ratio on linear path optical coupling. Figure 17 shows the value of Q factor for each optical node. The distance that can be achieved is 27.61, 36.57, 37.97, 38 and 52.6 km respectively for the optical node 2, optical node 1, optical node 4, optical node 3 and optical node 5.
Finally, the sensitivity is set at -35 dBm and the maximum distance that can be achieved is steadily increasing. Figure 18 shows the Q factor at sensitivity of -35 dBm versus distance for each node. Optical node 2, optical node 3, optical node 4, optical node 1 and optical node 5 respectively achieved 43.6, 49.5, 50.4, 52.1 and 66.35 km.
Ring protection path: The analysis is then studied on the maximum distance that can be achieved for ring protection path on different values of sensitivity which are -25, -30, -32 and -35 dBm. In this ring path, the ratio at coupler is adjusted at each optical node to obtain the output power at optimum and same level. The output power was obtained when the distance is increased starting at 10 until 120 km. Figure 19 shows the output power when distance is increased until 120 km. Found that there is a small difference on output power for each optical nodes.
Fig. 15: Q factor versus fiber length (km) for signal loss in sensitivity of -25dBm
Fig. 16: Maximum Q factor versus fiber length (km) for signal loss in sensitivity of -30 dBm
Fig. 18: Minimum distance at 43.49 km and maximum distance at 68 km
Fig. 19: Output power (dBm) versus fiber length (km) of optical node 5
Fig. 20: Maximum Q factor for different distance at the sensitivity of -25 dBm
Fig. 21: Maximum Q factor versus fiber length at sensitivity of -30 dBm
The output power for optical node 4 at -25, -30, -32 and -35 dBm have their own fiber length at 32.4, 57.6, 67.6 and 82.4 km, respectively.
Figure 20 shows the maximum Q factor versus fiber length (km) of optical node 5 at sensitivity of -25 dBm. At this level of sensitivity, the maximum distance that can be achieved is at a distance of 35 km which is on optical node 4. While the lowest distance that can be achieved at optical node 5 is 28.6 km. Sensitivity is then increased at -30 dBm to obtain the distance that can be achieved at each optical node. Figure 21 shows the maximum Q factor against fiber length (km). Noted that, the available output power for optical node 5 (the lowest) and optical node 4 (highest) are respectively 54 and 62 km.
Next, the sensitivity is increased to -32 dBm where the maximum distance at this level of sensitivity is obtained. Figure 22 shows the fiber length (km) at sensitivity of -32 dBm. At a minimum Q factor of 6, the distance on optical node 5 and optical node 4 are 64.5 and 71 km, respectively. While at the sensitivity of -35 dBm, the maximum distance also being increased. Figure 23 shows the Q factor decreased exponentially when the distance is increased.
As expected, the maximum fiber length (km) has been increased to 88 km at optical node 4 and the minimum distance achieved in the optical node 5 is over 78 km.
407 Fig. 22: Maximum Q factor versus fiber length at
sensitivity of -32 dBm
Fig. 23: The maximum value of Q factor for different fiber lengths up to 88 km (maximum distance) at sensitivity of -35 dBm
Fig. 24: Percent of signal loss for coupler
Fig. 25: Output power (dBm) for optical node 9 when the coupling ratio is varied
By increasing the dynamic range in the network, then the number of optical nodes that can be achieved also increased. To study the maximum number of optical nodes, the coupler of ring path will be changed according to a specific value to get an equal power and that output power is the optimum value in accordance with all optical nodes in the network.
For the study to get the value of this maximum optical node, the parameter extraction method has been carried out. The ratio on the coupling parameter has been extracted with BER analyzer to obtain the Q factor of 6. In this case, optimization will find the ratio of the optical coupler to achieve a Q factor of 6 for all sensitivity that has been specified. As a result, the ratio of the optical coupler can be adjusted according to the sensitivity at the receiver. As the number of optical nodes is more than one, then the optimization of various parameters (Multiple Parameter Optimization, MPO) were conducted. Found that, all ratios on optical node coupler will be varied to achieve a Q factor of 6 as the noise power (sensitivity) may be prescribed.
Thus, the percentage ratio on the coupling parameters will be determined by the appropriate value to obtain the results from BER analyzer. As a result, the coupling ratio should be adjusted to achieve the optimal output power for all optical nodes.
A study to obtain the maximum number of optical nodes is performed on ring protection path only. Noted that, the overall length prescribed for this simulation is 15 km. Sensitivity values that have been used to study the maximum number of optical nodes in the network are -30 and -35 dBm.
Fig. 26: Adjustment percentage of signal loss in optical coupler for ten optical nodes (maximum node reached)
Fig. 27: Output power (dBm) for ten nodes for optical wavelength of 1550 nm and 1490 nm
At this level of sensitivity, the obtained output power for each optical node does not exceed -30 dBm for these eight optical nodes. Also, node 9 gives the declining output power and it determines that; at dynamic range of 30 dBm, a total of eight optical numbers of nodes can be loaded in the network.
However, the sensitivity can be improved so that the maximum number of optical nodes can be increased and the maximum nodes that can be use are different according to each level of sensitivity. This is because; when the sensitivity is increased, the maximum number of optical nodes could be improved.
The sensitivity is then set at -35 dBm to obtain the maximum number of optical nodes. From the results obtained, the maximum number of nodes increased to optical node 10 with a distance of 15 km overall. Figure 26 shows the percentage of the coupling ratio to obtain the maximum number of nodes on the sensitivity of -35 dBm where the distance is measured at 15 km as a result from parameter extraction method. Figure 27 shows the optical output on each node in the network. From this graph, the output power that has been obtained for each optical node is at sensitivity of -35 dBm.
DISCUSSION
As a summary, the design of protection for applications in scattered placement (proposal 1) has been developed and carried out by a simulation analysis. The design consists of optical nodes act as additional elements that used to carry out the protection scheme until it is able to troubleshoot three level of impairment in fiber line.
The combination of tree topology and ring topology were used in the design on this first proposal. In this protection design, there are two optical paths that can be used which are linear path and ring path, where it functioning as an alternative route in case of impairment on the fibers. The simulation analysis for output power in a linear protection path produced almost same output power for all optical nodes regardless of the position and situation of the node. In this linear protection, signal is split by optical splitter and did not having loss of power at each node. Thus the percentage adjustment on the coupling is obtained; the average output power measured at the receiver is at -28.4206 dBm. While the signal for ring path is optimized by adjusting the loss ratio (n%) and transmit it (1-n%) in the optical coupler. Found that; an average output power is -23 dBm only.
A simulation of distance accessibility is increased with the increasing of sensitivity that used for the linear path and ring path. The increasing in number of optical node (user) is analyzed by a simulation on ring path only. Noted that, at sensitivity of -35 dBm, the number of optical nodes capable of be added to 10 by adjusting the ratio percentage of the optical coupler.
CONCLUSION
As a conclusion, design protection for applications in scattered placements has been developed and analysis carried out by simulation. The design consists of an optical node as an additional element that is used to come out with the protection scheme in order to repair the three levels of failure in fiber line. The combination of the ring and tree topology has been used in this design to reach a better design protection. So, there are two ways that signal would pass which is linear and ring path as an alternative route in case of fiber failure.
ACKNOWLEDGEMENT
409 operating fund UKM-OUP-ICT-36-182/2010 and research university grant UKM-PTS-082-2010.
REFERENCES
Aziz, S.A.C., M.S. Ab-Rahman and K. Jumari, 2009. Customer access protection unit for survivable FTTH network. Proceedings of the International Conference on Space Science and Communication, Oct. 26-27, IEEE Xplore Press, Negeri Sembilan, pp: 71-73, DOI: 10.1109/ICONSPACE.2009.5352668 Chan, T.K., C.K. Chan, L.K. Chen and F. Tong, 2003.
A self-protected architecture for wavelength-division-multiplexed passive optical networks. IEEE Photonics Technol. Lett., 15: 1660-1662. DOI: 10.1109/LPT.2003.818657
Han, K.E., S.H. Shim, B.J. Oh, L.M. Peng and Y.C. Kim, 2007. Hybrid protection architecture against multipoint failure in WDM-PON. Proceedings of the 9th International Conference on Advanced Communication Technology, Feb. 12-14, IEEE Xplore Press, Gangwon-Do, pp: 1385-1390. DOI: 10.1109/ICACT.2007.358615
Hossain, D., H. Erkan, R. Dorsinville, M. Ali and S. Shami et al., 2005. Protection for a ring-based EPON architecture. Proceedings of 2nd International Conference on Broadband Networks, Oct. 7-7, IEEE Xplore Press, Boston, MA., pp: 1548-1553. DOI: 10.1109/ICBN.2005.1589790
Hwang, I.S., Z.D. Shyu and L.Y. Ke, 2009. A novel fault-tolerant multi-EPON system with sharing protection through bridge ONUs. Photonic Netw. Commun., 18: 24-38. DOI 10.1007/s11107-008-0167-5
Langer, K.D., J. Grubor and K. Habel, 2004. Promising evolution paths for passive optical access networks. Proceedings of 2004 6th International Conference on Transparent Optical Networks, Jul. 4-8, IEEE Xplore Press, pp: 202-207. DOI: 10.1109/ICTON.2004.1360276
Rejeb, R., M.S. Leeson, C.M. Machuca and I. Tomkos, 2010. Control and management issues in all-optical networks. J. Netw., 5: 132-139. DOI: 10.4304/jnw.5.2.132-139
Yeh, C.H. and S. Chi, 2008. Self-protection against fiber fault for ring-based power-splitting passive optical networks. J. Opt. Eng., 47: 020501-020501. DOI: 10.1117/1.2841702
Zalevsky, Z. and R. Appelman, 2004. All-optical switching technologies for protection applications. IEEE Commun. Mag., 42: S35-S40. DOI: 10.1109/MCOM.2004.1362548