A Work Project presented as part of the requirements for the award of a Master’s Degree in Finance from the NOVA – School of Business and Economics.
Stock Reactions to China Tweets:
Trump and the US-China Trade War
EMIL OHLSSON - 34454
A project carried out on the master’s in finance program, under the supervision of: Professor José Albuquerque Tavares
“I’m a tariff man” -President Donald J. Trump “The complicated part, is just what does this mean, to have a direct line to how he’s thinking in real time and to see that.”
-Jack Dorsey, Twitter CEO
Abstract
The aim of this paper is to examine what effect Donald Trump’s tweets concerning the US-China trade war have on the US Stock Market, and hereby exploring a topic which to our knowledge has not been investigated previously. Specifically, the analysis is broken down in two parts: first, it looks at whether his tweets cause market movements and secondly it determines whether movements correlate with the sentiment of the tweet. Our results show that Trump’s tweets regarding President Xi increases market returns and decreases volatility. Moreover, tweets regarding trade, tariffs, imports, or exports decrease market returns. Finally, the sentiment of Trump’s tweets is also relevant in this context; positive tweets about President Xi correlates to increases in the market return.
Keywords
Trade; Twitter; Trump; China
This work used infrastructure and resources funded by Fundação para a Ciência e a Tecnologia (UID/ECO/00124/2013, UID/ECO/00124/2019 and Social Sciences DataLab, Project 22209), POR Lisboa (LISBOA-01-0145-FEDER-007722 and Social Sciences DataLab, Project 22209) and POR Norte (Social Sciences DataLab, Project 22209).
I. Introduction
Donald Trump’s integral manner of using Twitter as a means of communication has
challenged received views as to how policy information spreads to the public and the markets. On the one hand, more information is made available, faster, to a larger audience. On the other hand, it is doubtful just how credible that information is, and whether and how market agents filter its content. First, the volume of Donald Trump’s tweets, and the associated number of followers have risen steadily, in tandem with tenure, reaching 63.7 million followers in August 2019. September 2019 was his busiest month thus far, with an average of 26 tweets per day, including retweets. In addition, the President’s impulsive nature has led to frequent and radical changes in apparent policy stance.
Second, according to The Economist (2019, July 17), tweets “have been declared by lawyers from America’s Justice Department to be “official statements” from the President”,
lending credence to tweets from the White House as a tool for policy communication. Additionally, an article from the New York Times states that “…he (Trump) has fully integrated Twitter into the very fabric of his administration, reshaping the nature of the presidency and presidential power”. However, one may find puzzling how, despite a consensus among economists and most policymakers that tariffs and protectionism are detrimental to growth, the S&P 500 has hit all-time highs no less than 19 times during the past calendar year, up to 10th of September 2019.
In summary, the intrinsic speed of the internet platform, together with the unusual frequency of tweets and the nature of the Donald Trump´s personality, have flooded markets with more information than ever before. A Bank of America Merrill Lynch study showed that, since 2016, when the President tweets more than 35 times a day, the S&P500 suffered from negative returns on average (Thomas Franck (2019, September 3)). Meanwhile, when the frequency fell to less than five tweets a day the opposite effect held, and market returns increased.
In this study, we want to assess whether, in the wake of Donald Trump´s presidency, Twitter has become a credible source of policy information. The goal of this paper is to assess whether there is a correlation between Trump’s tweets, organized into topics, and stock market
returns and volatility in the short run. Specifically, the topic of China and Trade, and his aggressive rhetoric on these matters, were central leading up to the President’s election. With regards to this, we isolate tweets whose topic relates to the US-China trade war and examine whether stock movements correlate to this. Our analysis is two-dimensional: we look at both the content and the sentiment of the tweets to better understand what impact these have on markets. Moreover, another important reason to why the sentiment is included is due to the ambiguous nature of Trump’s tweets, which often induce positive and negative takes
simultaneously. We collect a set of 307 of Trump’s tweets, between the period of the 1st of March 2018 and the 10th of September 2019, and use the Semi-Efficient Market Hypothesis,
originally presented by Malkiel and Fama (1970), to test for the effect publicly available information, in this case tweets, have on stock market returns.
The paper is organized as follows: section two highlights the existing literature on the topic; section three expounds the hypotheses; section four presents the methodology and data; section five presents the empirical findings, and section six discusses further research avenues.
II. Literature Review
The goal of this section is to highlight previous studies made within my field of research and relate them to the research question of this paper. Based on this, I organize this section as follows: the first sub-section highlights the importance of market perception and tweet sentiments in general. This is relevant since this paper’s research hypothesis is partly anchored
in the analysis of the consequence of returns and volatility based on the tone Donald Trump uses in his tweets. Moving on, the second sub-section explores previous studies on market reactions as a result of Donald Trump’s Twitter activity. It is further divided into two sub-sections; the first analyses studies made with regards to Trump’s tweets on the US-China trade
war, and the second tweets targeted at specific assets such as company stocks. Again, this is useful since it provides an idea of what reactions the President’s tweeting activity have
triggered in the past. This in turn will be compared to the findings of this paper.
Many studies conclude that the tweet sentiment in general is indeed an important factor that markets consider. Simpson, M. (2018) finds that “tweets with a negative sentiment were followed by an increase in uncertainty in the VIX and S&P 500 one and two minutes after the tweet. Similar results were found for positive tweets.”. Although the time span used in this paper incorporates longer time intervals, namely daily data, this information is relevant since it confirms the importance of sentiment in tweets. Building on this, Ranco, G., Aleksovski, D., Caldarelli, G., Grčar, M., & Mozetič, I. (2015) find a significant relationship between abnormal
returns and tweet sentiment. Additionally, the sentiment decides which direction cumulative abnormal returns takes. Finally, Gorodnichenko, Y., Pham, T., & Talavera, O. (2018) state that the role of twitter sentiments potentially impacted the US 2016 General Elections outcome.
2.2 Donald Trump’s Tweets and the Stock Market
Several studies have been made with regard to the effect Trump’s tweets have on the market.
This is important to examine since the tone in his message sets the expectation of where he
stands on matters at that point in time. Born, Myers, & Clark (2017) state that “… positive (negative) content tweets elicited positive (negative) abnormal returns on the event date and virtually all of this effect is from the opening stock price to the close.”. Moreover, they also conclude that Trump’s tweets increased trading volumes and Google Search activity.
Huang, Y., Lin, C., Liu, S., & Tang, H. (2018) concludes that “US firms that are more dependent on exports to and imports from China have lower stock and bond returns but higher default risks in the short time window around the announcement date”. Although this study is similar to this paper, it only looks at the first round of tariffs applied and does not base market reactions around tweets. Jadoon A. K. (2018) doesn’t support the thesis that market prices are strongly related to the tone of Trump’s tweets. However, the author concludes “... for Europe
and China… social sentiment tends to be a very short-term influence on market prices.” This is of relevance to this thesis since it looks specifically at tweets which often revolve around trade and sanctions.
2.2.1 Donald Trump’s Asset Specific Tweets
A number of papers examine the effect of asset specific tweets made by Donald Trump. A study by Malaver-Vojvodic (2017) finds that tweets made by Trump with negative sentiment indeed affected the daily volatility of the US/Peso exchange rate. Colonescu, C. (2018) concludes that there are both “…short term, as well as some persistent effects of twitter
announcements by the US president on some financial and foreign exchange aggregates, such as the Dow Jones Industrial Average”. Although the approaches of the papers above are similar to this paper, the content of the tweets are often not related to public policy and the American economy as a whole. They are still relevant, however, since they provide a general idea of how markets perceive Trump tweets.
Finally, Trump’s tweets have been considered important enough to generate coverage
from financial institutions. As previously mentioned, Bank of America Merrill Lynch showed that the volume of the President’s tweets matters in terms of the returns of the S&P500.
Additionally, in September 2019, JP Morgan created the Volfefe Index. The conclusion upon the release was that the index “explains a measurable fraction of the moves in implied rate volatility for 2-year and 5-year Treasuries”. When Trump’s tweet volume increases the stock market falls when looking at the following minutes after a tweet.
IV. Methodology and Data
This section begins by highlighting the statistical framework for this study. After this, it explains in detail how twitter and market data are retrieved, processed, and analyzed. Finally, it demonstrates the models used as a foundation for statistical analysis.
4.1 Event Studies
The analysis of tweets provides the setting for an event study. This paper’s empirical methodology is anchored in the paper by MacKinlay, A. C. (1997) which uses regressions of abnormal returns within a certain event window. The idea is to examine whether abnormal returns are triggered by the event in question. My analysis includes data that spans between March 2018 to mid-September 2019 and is considered on a daily basis. My choice of March 2018 is based on when Donald Trump intensified the volume of tweets about the US-China
Trade War, and when tariffs were first introduced. The period ends in mid-September when the trade war was put on halt. Finally, all regressions are made with robust standard errors; the robust option relaxes the assumption that the errors are identically distributed which is one method of dealing with heteroskedasticity. Additionally, the usage of lagged values for the control variables help mitigate autocorrelation, but also incorporates any previous information that might be contained in reactions to a tweet.
4.1.1 Abnormal Returns
Markets absorb information in different time spans; to incorporate this effect I look at abnormal returns for a six-day event window comprised of five days prior to the tweet in question, and the day of the event [-5,0]. The idea behind this is to look at the short-term effect and immediate response to the tweet in question. Previous studies show that market movements upon tweets are often short-lived (see for example Simpson, M. (2018)), hence the short event window is useful in this analysis. Moreover, the volume of tweets and information conveyed by President Trump is why this paper emphasizes the day of the tweet, rather than also looking at trading days after this point in time. For each tweet the prior 120-trading day period is used as estimation window. In this paper all variables are regressed on abnormal returns. As illustrated by MacKinlay, A. C. (1997) abnormal returns are calculated as per below:
𝜎2(𝐴𝑅)
𝑖𝑡 = 𝑉𝑎𝑟(𝜀𝑖𝑡)
where ARit, Rit, and E(Rit Xt) are abnormal, actual, and expected (or normal) returns. The variance of abnormal returns is estimated over the event window as the variance of residuals (disturbances).
4.1.2 Modelling Normal Returns: Market Model and Constant Mean Return Model
To model normal returns, I use the Market Model and a 120-day average of each stock market’s return as shown below.
𝑅𝑖𝑡 =∝𝑖+ 𝛽𝑖𝑅𝑚𝑡+ 𝜀𝑖𝑡
𝐸(𝜀𝑖𝑡) = 0 𝑣𝑎𝑟(𝜀𝑖𝑡) = 𝜎𝜀2𝑖 (II)
𝑅𝑖𝑡 = 𝜇𝑖+ 𝜁𝑖𝑡
𝐸(𝜁𝑖𝑡) = 0 𝑣𝑎𝑟(𝜁𝑖𝑡) = 𝜎𝜁𝑖
2 (III)
In this case, my choice of using the Market Model (II) rather than the Constant Mean Return Model (III) is based on the fact that it is more applicable when looking at daily data (MacKinlay, A. C. 1997). However, since this paper only incorporates market returns, using the Market Model yields the same returns as the Constant Mean Return Model. Additionally, both are statistical models based on the assumption that “asset returns are jointly multivariate
p.17). Due to the fact that I am looking at the market rather than firm-specific securities, beta is one and alpha is zero, which provides the expression of the second model (III). Looking at a 120-day average limits my sampling error which is crucial to mitigate serial correlation. Finally, I do not include the estimation period in the event window to avoid that the event influences the other normal performance model parameter estimates, as stated by MacKinlay, A. C. (1997). This would be problematic because my methodology revolves around the assumption that any potential event impact is captured by abnormal returns. Additionally, the exclusion of the estimation period enables the assumption that abnormal returns are independent across tweets, which limits the problem of clustering. Moreover, event studies in general draw inferences from Cumulative Average Abnormal Returns (CAAR), however since I only look at one asset, namely the market, this procedure is of less relevance.
4.2 Tweets
To obtain tweets related to the US-China trade war I use a ‘bag of words’ approach to isolate tweets deemed relevant for my analysis, an approach similar to that of Jadoon (2018). Tweets within my event period are extracted on the premise that they contain a certain keyword; the intuition is that this approach should capture as many tweets as possible related to the US-China Trade War. The following nine keywords are used: US-China, Chinese, Export, Import, Jinping, President Xi, Trade, Tariff, and Xi. However, these keywords alone do not ensure that the content of the tweet is attributable to the US-China trade war; to ensure the relevance of
tweets I construct three clusters which all include a portion of the keywords. First, I construct the China cluster where the keywords China and Chinese are included. Secondly, Xi includes Jingping, President Xi, and Xi. The final cluster is made up of Trade, Tariff, Import, and Exports (or “TTIE”). Moreover, all clusters contain keywords which aren’t necessarily contributable to the US-China Trade War. However, the line of reasoning is that when modelled together, they isolate as many tweets as possible related to this topic.
From each tweet, two pieces of information are compiled: the date of the tweet and the sentiment value. Each day inside my event period either contains a tweet or several tweets, or no tweets. To check whether tweets cause market movements, I assign binary values to each day inside my event period. Days when tweets occur are assigned 1; if there are no tweets on the date in question a value of 0 is assigned, hence the date of the tweet is of importance. Furthermore, tweets may occur on weekends. Since stock markets are closed at this point in time, I simply transfer these tweets to the following Monday; this is plausible since the immediate opening price on Mondays reflects the preceding Friday’s closing price. Movements
on Monday thus reflect the incorporation of the content of the weekend tweets plus whatever information is conveyed on the same Monday; the aggregate effect is shown on the evening when the market closes and the day-to-day total return is obtained. The intuition behind this method is to include all tweets deemed relevant for my analysis, also those occurring on weekends.
The sentiment of each tweet is included to better understand what impact tweets have on market fluctuations. Bollen et al. (2011) categorized 9,853,498 tweets according to people’s sentiments for 2.7 million Twitter users, between February 28, 2008 and December 19, 2008. The conclusion is that predictions of daily movements in the Dow Jow Industrial Average (DIJA) are accurate in 87.6% of the cases when measures such as people’s level of happiness and calmness is extracted from Twitter, proving that sentiments in tweets are an important factor that markets consider. In this case, a positive sentiment translates into a positive outlook for the trade war; for example, this can imply an exemption of tariffs. On the other hand, a negative sentiment value conveys more aggression in the Trade War. Sentiment values are computed based on AFINN, a sentiment analysis tool developed by Nielsen (2011). It is among the smallest lexicons, nevertheless amongst the most effective in determining sentiments; Ozdemir & Bergler (2015) state that AFINN dominates other lexicons used for tweets. The tool produces sentiment scores ranging from -5 (very negative) to 5 (very positive), where 0 is neutral. The usage of the code has been through https://darenr.github.io/afinn/. If tweets occur on the weekend or there are several tweets per day, I use the mean to reflect the sentiment value. Of the 307 tweets collected, 112 relate to China, 166 to TTIE, and finally 29 to Xi. The distribution is depicted below.
Graph 1: Donald Trump Tweet Sentiment
Graphical illustration of the sentiment of Donald Trump’s tweets related to China, TTIE, and Xi. The graph is constructed in Excel and based on the sentiment value assigned to each tweet for each of the three segments.
Finally, all tweets are retrieved from http://www.trumptwitterarchive.com/, a source used by several papers (see for example Kryger, M. (2017)). The website contains around 41000 tweets from the President dating back to 2009. Tweets posted by Donald Trump’s personal account (@realDonaldTrump) are used rather than Donald Trump’s presidential account (@POTUS)
as Trump simply retweets his personal account tweets on his presidential account, and hence activity on this account provides no new information.
4.3 Market Indices
Our market sample includes the S&P 500, NASDAQ Composite Index, Dow Jones Industrial Average (DJIA), and finally the VIX. All data is retrieved from Bloomberg and we look at day-to-day total returns net of dividends. The first three are broad market indices tracking the
27 40 5 71 113 23 14 13 1 C H I N A T T I E X I
US stock market. S&P 500 is a market capitalization weighted index of the 500 largest US listed firms. It constitutes around 70-80% of total American stock market value. The NASDAQ Composite is a market capitalization weighted index comprising around 3300 listings and include stocks from the NASDAQ exchange, the US’s second largest. DJIA is a price-weighted index which includes the 30 largest listed US stocks. Together, these three indices have the greatest investor and analyst coverage; moreover, the size and value of the firms included enable them to serve as a credible proxy for the market. VIX measures
volatility on S&P 500 options and is included to get an idea of what effect tweets have on the volatility of the market. An important remark with regards to this is the fact that I use day-to-day total net return: this measure simply looks at daily net effects, rather than the total size of market movements. As previously mentioned, tweets on weekends are transferred to
Monday; their effect is apparent immediately at the opening of the market, however it is hard to determine whether it contributes largely to the closing price at the end of the day, which is what my returns measure. For instance, if the market increases by 140 points at opening, to later decrease by 110 during the same day, the net return is displayed as a 30-point increase. Although this is correct in absolute terms, the implied volatility is not apparent. Hence, in an effort to correct for this, I also include the VIX to obtain a holistic idea about the effect of tweets. By looking at the daily volatility I can better determine if tweets cause movement.
The null hypothesis with regards to my research question is that coefficients are zero and insignificant; in other words, it investigates whether events in the form of tweets have no impact on the behavior of returns (variance or mean).
H0: Donald Trump’s tweets have no effect on market return and volatility
H1: Donald Trump’s tweets have effect on market return and volatility
Moreover, I use three models, displayed below, to look at the effect of a tweet occurring, the effect of the sentiment of the tweet, and finally the effect of the sentiment of the cluster of tweets. 𝑅𝑚𝑡 =∝𝑖+ 𝛽1𝑘𝑒𝑦𝑤𝑜𝑟𝑑 𝑡+ 𝛽2𝑅𝑚𝑡5+ 𝛽3𝑅𝐴𝑣𝑒𝑟𝑎𝑔𝑒𝑆𝑒𝑛𝑡𝑖𝑚𝑒𝑛𝑡𝑡+ 𝛽4𝑅𝑇𝑜𝑡𝑎𝑙𝑇𝑤𝑒𝑒𝑡𝑠+ 𝜀𝑖𝑡 𝑅𝑚𝑡 =∝𝑖+ 𝛽1𝑘𝑒𝑦𝑤𝑜𝑟𝑑𝑠𝑒𝑛𝑡𝑖𝑚𝑒𝑛𝑡 𝑡+ 𝛽2𝑅𝑚𝑡5+ 𝛽3𝑅𝐴𝑣𝑒𝑟𝑎𝑔𝑒𝑆𝑒𝑛𝑡𝑖𝑚𝑒𝑛𝑡𝑡+ 𝜀𝑖𝑡+ 𝛽4𝑅𝑇𝑜𝑡𝑎𝑙𝑇𝑤𝑒𝑒𝑡𝑠+ 𝜀𝑖𝑡 𝑅𝑚𝑡 =∝𝑖+ 𝛽1𝑘𝑒𝑦𝑤𝑜𝑟𝑑𝑡+ 𝛽2𝑘𝑒𝑦𝑤𝑜𝑟𝑑𝑠𝑒𝑛𝑡𝑖𝑚𝑒𝑛𝑡𝑡+ 𝛽3𝑅𝑚𝑡5+ 𝛽4𝑅𝐴𝑣𝑒𝑟𝑎𝑔𝑒𝑆𝑒𝑛𝑡𝑖𝑚𝑒𝑛𝑡𝑡+ 𝛽5𝑅𝑇𝑜𝑡𝑎𝑙𝑇𝑤𝑒𝑒𝑡𝑠𝑡 + 𝛽6𝑅𝑇𝑟𝑎𝑑𝑒𝑊𝑎𝑟𝑁𝑒𝑤𝑠𝑡+ 𝜀𝑖𝑡
The idea behind this is to distinguish the effect of tweets to that of the sentiment of the tweet. Additionally, the variable which pairs the sentiment of the clusters looks at whether the sentiment is isolated to one cluster alone or whether the combination of all keywords in one tweet causes additional market movements. My control variables comprise of a market index variable, the absolute number of tweets made per day by Donald Trump, and a daily average of each tweet’s sentiment value. Moreover, an additional variable which tracks positive or
negative news regarding the trade war is incorporated for robustness purposes. The first variable is lagged based on the five previous days. I include the total number of tweets to factor in the significance of volume of tweets as shown by Bank of America Merrill Lynch. Moreover, the average sentiment value increases the possibility to evaluate what effect sentiment scores have on tweets. The statistical tests are shown below and illustrate the impact the number of tweets have on both market returns (CCMP) and volatility (VIX).
SPX INDU CCMP VIX
Independent Variable
Lagged Average Market Return -0.007 (0.190) -0.000 (0.189) -0.062 (0.175) -0.139 (0.149) Number of Tweets 0.000 (0.000) -0.000 (0.000) -0.001* (0.000) 0.001*** (0.000) R2 0.42% 0.32% 0.95% 2.89% Observations 307 307 307 307 SPX INDU CCMP VIX Independent Variable
Lagged Average Market Return 0.181 (0.218) 0.151 (0.217) 0.141 (0.213) -0.071 (0.223) Number of Tweets -0.000 (0.000) -0.000 (0.000) -0.000 (0.000) 0.001** (0.000) Sentiment Average 0.000 (0.000) 0.000 (0.000) 0.000 (0.000) -0.003 (0.003) R2 1.68% 1.33% 2.03% 3.35% Observations 307 307 307 307
Table I: Benchmark Specification
Regression analysis where is displayed with p-values. * signifies p-value<10%, ** signifies p-value<5%, and finally *** signifies p-value<1%. Robust Standard Errors are displayed in brackets. Regressions are made in STATA with data from Bloomberg and personal data collection of tweets.
The final control variable is a dummy; with regards to the mapping of the trade war events based on Peterson Institute for International Economy’s, the variable assigns 1 if a positive
event occurs any day within the time period. Similarly, a -1 is assigned to the variable if news regarding the trade war are negative. If nothing occurs on a given date, 0 occurs. In line with previous reasoning, positive is defined as non-aggressive measures taken, such as tariff exemptions. Meanwhile, negative news implies more aggression in terms of for example tariff increases. The idea behind the control variables is to add explanatory power to my model in terms of trade war events and announcements besides those coming from tweets.
V. Empirical Findings
This section of the paper presents and analyses the main findings. First, we analyze the impact of a tweet occurring on a given day, secondly we look at the sentiment value specifically, and finally whether the two components together have significant impact on market returns and volatility.
5.1 Tweets
We find that when looking at abnormal returns, the appearance of a cluster of keywords has no significant effect on the three general market indices nor on volatility when modelled together.
This implies that investors shouldn’t base a trading strategy solely on the topics of Trump’s
tweets; the explanatory power is not strong enough.
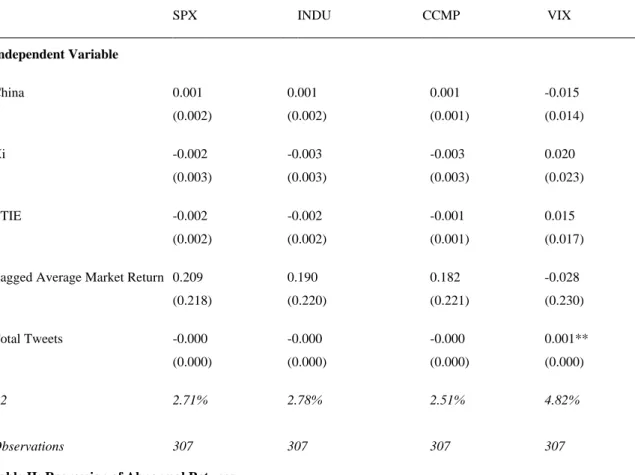
SPX INDU CCMP VIX Independent Variable China 0.001 (0.002) 0.001 (0.002) 0.001 (0.001) -0.015 (0.014) Xi -0.002 (0.003) -0.003 (0.003) -0.003 (0.003) 0.020 (0.023) TTIE -0.002 (0.002) -0.002 (0.002) -0.001 (0.001) 0.015 (0.017) Lagged Average Market Return 0.209
(0.218) 0.190 (0.220) 0.182 (0.221) -0.028 (0.230) Total Tweets -0.000 (0.000) -0.000 (0.000) -0.000 (0.000) 0.001** (0.000) R2 2.71% 2.78% 2.51% 4.82% Observations 307 307 307 307
Table II: Regression of Abnormal Returns
Regression analysis where is displayed with p-values. * signifies p-value<10%, ** signifies p-value<5%, and finally *** signifies p-value<1%. Robust Standard Errors are displayed in brackets. Regressions are made in STATA with data from Bloomberg and personal data collection of tweets.
5.2 Tweet Sentiments
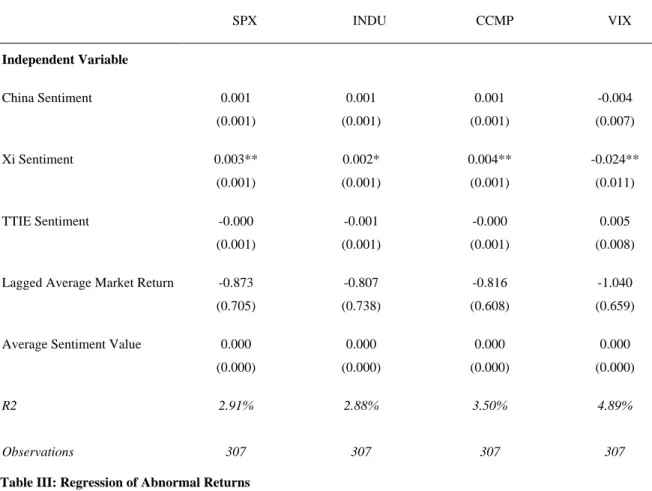
Table III shows that the sentiment of tweets related to President Xi is positively related to the market return of the three indices. Based on this, results show that when Trump tweets positively (negatively) about President Xi, markets react similarly, and returns are positive (negative). These results are in line with the findings of Born, Myers, & Clark (2017), which
state that positive tweets often yield short-term positive returns and vice versa. Accordingly, a positive (negative) sentiment in tweets regarding President Xi also decreases (increases) volatility as shown by the negative correlation with the VIX.
SPX INDU CCMP VIX Independent Variable China Sentiment 0.001 (0.001) 0.001 (0.001) 0.001 (0.001) -0.004 (0.007) Xi Sentiment 0.003** (0.001) 0.002* (0.001) 0.004** (0.001) -0.024** (0.011) TTIE Sentiment -0.000 (0.001) -0.001 (0.001) -0.000 (0.001) 0.005 (0.008) Lagged Average Market Return -0.873
(0.705) -0.807 (0.738) -0.816 (0.608) -1.040 (0.659) Average Sentiment Value 0.000
(0.000) 0.000 (0.000) 0.000 (0.000) 0.000 (0.000) R2 2.91% 2.88% 3.50% 4.89% Observations 307 307 307 307
Table III: Regression of Abnormal Returns
Regression analysis where is displayed with p-values. * signifies p-value<10%, ** signifies p-value<5%, and finally *** signifies p-value<1%. Robust Standard Errors are displayed in brackets. Regressions are made in STATA with data from Bloomberg and personal data collection of tweets.
5.3 Tweets and Tweet Sentiments
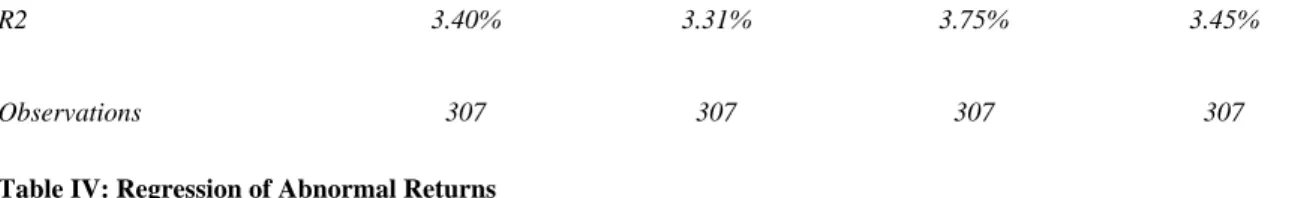
Finally, Table IV shows that market reactions to tweets are modelled to a greater extent when
both the topic of the tweet and the sentiment is taken into consideration simultaneously. In line
President Xi leads to positive (negative) returns. The results show that also when considering
average tweet sentiment, the Xi Sentiment is significant, and the impact is around one fifth of
the impact of the overall sentiment. Additionally, tweets regarding TTIE are perceived
negatively by the market. This is interesting since our sentiment analysis showed that a clear
majority of tweets regarding TTIE are positive and should thus induce the same response from
markets as previous literature finds. Finally, R-squared for the three market indices increases
which supports the fact that tweets are better modelled, in other words show stronger
explanatory power, when both the content and the sentiment are included.
SPX INDU CCMP VIX Independent Variable China 0.004 (0.009) 0.011 (0.008) 0.002 (0.009) -0.076 (0.100) Xi 0.012** (0.005) 0.011** (0.005) 0.011* (0.006) -0.031 (0.063) TTIE -0.026** (0.012) -0.032** (0.011) -0.025* (0.013) 0.173 (0.156) China Sentiment 0.000 (0.001) 0.001 (0.001) 0.000 (0.001) -0.006 (0.009) Xi Sentiment 0.003** (0.001) 0.003* (0.001) 0.004** (0.001) -0.023* (0.012) TTIE Sentiment -0.001 (0.001) -0.001 (0.001) -0.001 (0.001) 0.008 (0.010) Lagged Average Market Return -0.829
(0.848) -0.702 (0.835) -0.798 (0.710) -0.784 (0.977) Total Tweets -0.000 (0.000) -0.000 (0.000) -0.000 (0.000) 0.001 (0.001) Average Sentiment Value 0.021*
(0.003) 0.021* (0.003) 0.021* (0.003) -0.011 (0.003)
R2 3.40% 3.31% 3.75% 3.45%
Observations 307 307 307 307
Table IV: Regression of Abnormal Returns
Regression analysis where is displayed with p-values. * signifies p-value<10%, ** signifies p-value<5%, and finally *** signifies p-value<1%. Robust Standard Errors are displayed in brackets. Regressions are made in STATA with data from Bloomberg and personal data collection of tweets.
Finally, for robustness purposes, we also conduct regressions where we incorporate the Trade War Control Variable, shown in Table V. TTIE ceases to be significant, however the interpretation regarding tweets around President Xi remains the same. Moreover, R-squared adjusted is reported since the addition of variables decreases the R-squared. Hence, in line with what the results show, the Trade War variable does not improve the initial model.
SPX INDU CCMP VIX Independent Variable China 0.000 (0.008) 0.006 (0.008) -0.002 (0.008) -0.051 (0.129) Xi 0.011** (0.005) 0.011** (0.005) 0.010 (0.006) -0.020 (0.073) TTIE -0.017 (0.014) -0.022 (0.011) -0.015 (0.015) 0.131 (0.225) China Sentiment 0.000 (0.001) 0.001 (0.001) 0.000 (0.001) -0.005 (0.010) Xi Sentiment 0.002 (0.002) 0.002 (0.001) 0.003* (0.002) -0.021 (0.015) TTIE Sentiment -0.000 (0.001) -0.001 (0.001) -0.000 (0.001) 0.007 (0.012) Lagged Average Market Return -1.288
(0.790) -1.248 (0.756) -1.125 (0.666) -1.010 (1.223)
Total Tweets -0.000 (0.000) -0.000 (0.000) -0.000 (0.000) 0.001 (0.001) Average Sentiment Value 0.020*
(0.003) 0.020* (0.003) 0.020* (0.003) -0.011 (0.003) Trade War Indicator 0.010
(0.006) 0.011* (0.006) 0.011* (0.006) -0.029 (0.077) R2 Adjusted 3.06% 3.17% 3.45% 2.85% Observations 307 307 307 307
Table V: Regression of Abnormal Returns
Regression analysis where is displayed with p-values. * signifies p-value<10%, ** signifies p-value<5%, and finally *** signifies p-value<1%. Robust Standard Errors are displayed in brackets. Regressions are made in STATA with data from Bloomberg and personal data collection of tweets.
VI. Discussion of the Topic and Going Forward
In this paper, we asked ourselves what, if any, impact Donald Trump’s tweets have on market returns. The rationale for choosing this topic is the relevance of the on-going US-China Trade War and its effect on markets together with the President’s frequent usage of Twitter as a policy communication tool. Previous studies have shown that Trump’s tweets do cause disruption to markets (see for example Colonescu, C. (2018) or J.P. Morgan’s Volfefe Index). However, in this paper we have extended the analysis by looking at broader market movements in light of the US-China Trade War. Moreover, we have examined not only the content of the tweets, but also the sentiment to gain a more holistic idea of how Donald Trump’s tweets are perceived. Our results show that Donald Trump’s tweets are indeed correlated to market returns. Specifically, we have demonstrated that the content and sentiment of tweets regarding President Xi and TTIE are relevant for market returns; moreover, the sentiment of tweets related to President Xi also affects volatility. This conclusion provides an opportunity to investors to extend their scope of information analysis of market movements to also incorporate
Donald Trump’s tweets and the sentiment of his tweets. In other words, we have shown that his usage of Twitter is indeed legitimate and deemed important for markets to consider. Moreover, in broader terms, we have illustrated the fact that tweets are correlated to market returns and volatility, which strengthens the credibility of Twitter as a platform of information relevant to markets.
An important note to make to the sentiment analysis is the ambiguity of Trump’s tweets. At times, the President uses inflated words to glorify his actions whilst in fact the policy communicated could be perceived as negative for the economy. For instance, imposed tariffs on Chinese goods could be communicated as “great” for the U.S. by the President, and AFINN most likely gives it a positive sentiment score. Thus, it is of importance to bear in mind that in this paper, the sentiment scores rely on AFINN.
Finally, this paper has confirmed the hypothesis that Donald Trump’s tweets affect stock markets. Building on this, it provides a solid foundation for further research on the topic.
References (APA):
Bollen, J., Mao, H., & Zeng, X. (2011). Twitter mood predicts the stock market. Journal of
computational science, 2(1), 1-8.
Born, J. A., Myers, D. H., & Clark, W. J. (2017). Trump tweets and the efficient Market Hypothesis.
Algorithmic Finance, 6(3-4), 103-109.
Colonescu, C. (2018). The Effects of Donald Trump’s Tweets on US Financial and Foreign Exchange Markets. Athens Journal of Business & Economics, 4(4), 375-388.
Gorodnichenko, Y., Pham, T., & Talavera, O. (2018). Social media, sentiment and public opinions: Evidence from# Brexit and# USElection (No. w24631). National Bureau of Economic Research.
https://www.piie.com/sites/default/files/documents/trump-trade-war-timeline.pdf
Huang, Y., Lin, C., Liu, S., & Tang, H. (2018). Trade Linkages and Firm Value: Evidence from the 2018 US-China'Trade War'.
Jadoon , A. K. (2018). Can Donald Trump’s Tweets be used for Trading? Retrieved October 3, 2019, from
http://www.cse.ust.hk/~rossiter/independent_studies_projects/stocks_trump_tweets/stocks_trump
_tweets_report.pdf.
Kryger, M. (2017). What can tweets tell us about a person's sleep?. Journal of Clinical Sleep Medicine, 13(10), 1219-1221.
MacKinlay, A. C. (1997). Event studies in economics and finance. Journal of economic literature,
35(1), 13-39.
Malaver-Vojvodic, M. (2017). Measuring the Impact of President Donald Trump’s Tweets on the Mexican Peso/US Dollar Exchange Rate.
Malkiel, B. G., & Fama, E. F. (1970). Efficient capital markets: A review of theory and empirical work. The journal of Finance, 25(2), 383-417.
Michael. (2019, November 2). How Trump Reshaped the Presidency in Over 11,000 Tweets.
Retrieved December 23, 2019, from
https://www.nytimes.com/interactive/2019/11/02/us/politics/trump-twitter-presidency.html.
Nielsen, F. Å. (2011). A new ANEW: Evaluation of a word list for sentiment analysis in microblogs. arXiv preprint arXiv:1103.2903.
Ozdemir, C., & Bergler, S. (2015, September). A comparative study of different sentiment lexica for sentiment analysis of tweets. In Proceedings of the International Conference Recent Advances
in Natural Language Processing (pp. 488-496).
Pesce, N. L. (2019, October 11). 'This is Trump unleashed' - These charts show that the president
is tweeting and speaking more than ever. Retrieved from
https://www.marketwatch.com/story/this-
is-trump-unleashed-these-charts-show-that-the-president-is-tweeting-and-speaking-more-than-ever-2019-09-23.
Ranco, G., Aleksovski, D., Caldarelli, G., Grčar, M., & Mozetič, I. (2015). The effects of Twitter sentiment on stock price returns. PloS one, 10(9), e0138441.
Simpson, M. (2018). Do President Trump’s Tweets Increase Uncertainty in the US Economy?.
Thomas Franck. (2019, September 3). On days when President Trump tweets a lot, the stock market
falls, investment bank finds. Retrieved from
https://www.cnbc.com/2019/09/03/on-days-when-president-trump-tweets-a-lot-the-stock-market-falls-investment-bank-finds.html.
Tobey, J. S. (2019, September 7). How Trump's Tweets Infect Your Stock Market Investing.
Retrieved from
https://www.forbes.com/sites/johntobey/2019/09/07/how-tweet-risk-can-infect-your-stock-investing-and-how-to-avoid-harm/#26a7fdde3330.
Trump Twitter Archive website. http://www.trumptwitterarchive.com/archive. Accessed
September-December, 2019.
Trump's tweet divides Americans. (2019, July 17). Retrieved from