AMTD
8, 905–934, 2015Efficient photochemical generation of PANs
N. D. Rider et al.
Title Page
Abstract Introduction
Conclusions References
Tables Figures
◭ ◮
◭ ◮
Back Close
Full Screen / Esc
Printer-friendly Version
Interactive Discussion
Discussion
P
a
per
|
Discussion
P
a
per
|
Discussion
P
a
per
|
Discussion
P
a
per
|
Atmos. Meas. Tech. Discuss., 8, 905–934, 2015 www.atmos-meas-tech-discuss.net/8/905/2015/ doi:10.5194/amtd-8-905-2015
© Author(s) 2015. CC Attribution 3.0 License.
This discussion paper is/has been under review for the journal Atmospheric Measurement Techniques (AMT). Please refer to the corresponding final paper in AMT if available.
E
ffi
cient photochemical generation of
peroxycarboxylic nitric anhydrides with
ultraviolet light emitting diodes
N. D. Rider1, Y. M. Taha1, C. A. Odame-Ankrah1, J. A. Huo1, T. W. Tokarek1, E. Cairns1, S. G. Moussa2, J. Liggio2, and H. D. Osthoff1
1
Department of Chemistry, University of Calgary, 2500 University Drive NW, Calgary, AB T2N 1N4, Canada
2
Environment Canada, Air Quality Research Division, 4905 Dufferin Street, Toronto, Ontario, M3H 5T4, Canada
Received: 24 December 2014 – Accepted: 7 January 2015 – Published: 26 January 2015 Correspondence to: H. D. Osthoff([email protected])
AMTD
8, 905–934, 2015Efficient photochemical generation of PANs
N. D. Rider et al.
Title Page
Abstract Introduction
Conclusions References
Tables Figures
◭ ◮
◭ ◮
Back Close
Full Screen / Esc
Printer-friendly Version
Interactive Discussion
Discussion
P
a
per
|
Discussion
P
a
per
|
Discussion
P
a
per
|
Discussion
P
a
per
|
Abstract
Photochemical sources of peroxycarboxylic nitric anhydrides (PANs) are utilized in many atmospheric measurement techniques for calibration or to deliver an internal standard. Conventionally, such sources rely on phosphor-coated low-pressure mer-cury (Hg) lamps to generate the UV light necessary to photo-dissociate a dialkyl
ke-5
tone (usually acetone) in the presence of a calibrated amount of nitric oxide (NO) and oxygen (O2). In this manuscript, a photochemical PAN source in which the Hg lamp has been replaced by arrays of ultraviolet light-emitting diodes (UV-LEDs) is described. The output of the UV-LED source was analyzed by gas chromatography (PAN-GC) and thermal dissociation cavity ring-down spectroscopy (TD-CRDS). Using acetone, diethyl
10
ketone (DIEK), diisopropyl ketone (DIPK), or di-n-propyl ketone (DNPK), respectively, the source produces peroxyacetic (PAN), peroxypropionic (PPN), peroxyisobutanoic (PiBN), or peroxy-n-butanoic nitric anhydride (PnBN) from NO in high yield (>90 %). Box model simulations with a subset of the Master Chemical Mechanism (MCM) were carried out to rationalize products yields and to identify side products. The use of
15
UV-LED arrays offers many advantages over conventional Hg lamp setups, including greater light output over a narrower wavelength range, lower power consumption, and minimal generation of heat.
1 Introduction
The peroxycarboxylic nitric anhydrides (PANs, molecular formula RC(O)O2NO2) have 20
long been recognized as important trace gas constituents of the troposphere (e.g., Darley et al., 1963; Singh and Hanst, 1981; Roberts, 1990, 2007). A crucial aspect in their measurement, for example, by gas chromatography with electron capture de-tection (PAN-GC) or by chemical ionization mass spectrometry (CIMS) (Flocke et al., 2005; Slusher et al., 2004; Zheng et al., 2011), is the generation of a stable and suffi
-25
AMTD
8, 905–934, 2015Efficient photochemical generation of PANs
N. D. Rider et al.
Title Page
Abstract Introduction
Conclusions References
Tables Figures
◭ ◮
◭ ◮
Back Close
Full Screen / Esc
Printer-friendly Version
Interactive Discussion
Discussion
P
a
per
|
Discussion
P
a
per
|
Discussion
P
a
per
|
Discussion
P
a
per
|
standard to track the effects of the sample matrix on the instrument response. Diffusion standards are often used for this purpose, but require challenging syntheses and stor-age in a non-polar solvent at water-ice (or colder) temperatures since PANs are prone to thermal decomposition and explosive in pure form. In addition, the output of diffusion sources is difficult to stabilize. A complicating factor is that the instrument response
fac-5
tors usually differ for each of the PAN species, such that several PAN species need to be synthesized. Hence, the deployment of diffusion standards has practical limitations in field campaign settings.
Photochemical sources that generate PANs in situ are an attractive alternative as they remove the need to transport, store, and dispose of toxic chemicals and more
10
readily provide a stable output. Most commonly, the PAN species most abundant in the atmosphere, peroxyacetic nitric anhydride (PAN), is produced from irradiation of acetone in itsn→π∗ band in the presence of a calibrated amount of NO in excess O2
(Meyrahn et al., 1987; Warneck and Zerbach, 1992). Since the conversion of NO to PAN is reproducible and nearly quantitative (typically 95 %), the output of such a
pho-15
tochemical source is often directly calibrated using a conventional total odd nitrogen (NOy) chemiluminescence (CL) analyzer or relative to the amount of NO delivered from a calibrated gas cylinder (Pätz et al., 2002; Volz-Thomas et al., 2002; Flocke et al., 2005).
It is also possible to generate other PAN species photochemically, for example,
per-20
oxypropionic nitric anhydride (PPN) from propanal and NO, a reaction which has been reported to proceed in quantitative yield with respect to NO (Volz-Thomas et al., 2002). Recently, Furgeson et al. demonstrated that PPN and peroxyisobutyric nitric anhydride (PiBN) can be generated from either NO or NO2and diethyl ketone (DIEK) and
diiso-propyl ketone (DIPK), respectively, with yields in the 70–90 % range (Furgeson et al.,
25
2011) but they did not assess this new pathway by the most commonly used PAN measurement technique, PAN-GC.
AMTD
8, 905–934, 2015Efficient photochemical generation of PANs
N. D. Rider et al.
Title Page
Abstract Introduction
Conclusions References
Tables Figures
◭ ◮
◭ ◮
Back Close
Full Screen / Esc
Printer-friendly Version
Interactive Discussion
Discussion
P
a
per
|
Discussion
P
a
per
|
Discussion
P
a
per
|
Discussion
P
a
per
|
red-shift the output from 254 to 285 nm. This minimizes generation of undesirable ni-trogen oxide containing side products (i.e., alkyl nitrates and nitric acid) which interfere with calibration against NOyCL (Flocke et al., 2005). However, the use of these lamps
has several drawbacks: for one, they generate heat, which necessitates the use of a fan to avoid thermal decomposition of the desired PAN product. Furthermore, there is the
5
risk of breakage and exposure of the operator to toxic Hg vapor. In addition, some users have noted that the 285 nm light output of phosphor-coated Hg lamps can change over time (either through scratches or ageing of the phosphor coating) and that the source performance, i.e., the NO to PAN conversion efficiency, then degrades unbeknownst to the operator (J. M. Roberts, personal communication, 2014).
10
During the construction of a photochemical PAN source, Furgeson et al. (2011) ob-served that several newly purchased phosphor-coated Hg lamps, contrary to manu-facturer specifications, emitted residual radiation at 254 nm, which they suppressed by switching from a UV-transparent quartz photochemical cell to one constructed from Pyrex (which does not transmit UV-C light). The use of the Pyrex cell resulted in a high
15
purity output but also a reduced overall yield as the Pyrex walls attenuated the desirable 285 nm radiation. The PAN output of this source sufficed to produce a13C-labeled in-ternal standard for a thermal dissociation chemical ionization mass spectrometer (TD-CIMS) in a mildly polluted environment (Mielke and Osthoff, 2012) but was insufficient in the more polluted conditions encountered during the Calnex-LA campaign (Mielke
20
et al., 2013) and in Abbotsford, B.C. (Tokarek et al., 2014) motivating an improvement of the design of the photochemical source.
In this manuscript, we describe a second-generation photochemical PAN source in which the Hg lamp has been replaced by arrays of ultraviolet light emitting diodes (UV-LEDs). The new photochemical source was used to generate PAN, PPN, PiBN, and
25
AMTD
8, 905–934, 2015Efficient photochemical generation of PANs
N. D. Rider et al.
Title Page
Abstract Introduction
Conclusions References
Tables Figures
◭ ◮
◭ ◮
Back Close
Full Screen / Esc
Printer-friendly Version
Interactive Discussion
Discussion
P
a
per
|
Discussion
P
a
per
|
Discussion
P
a
per
|
Discussion
P
a
per
|
a modified subset of the Master Chemical Mechanism (Jenkin et al., 1997; Saunders et al., 2003; Jenkin et al., 2012) were carried out to rationalize the observed yields of PAN, PPN and PiBN and to identify side products. The performance of the UV-LED photochemical source was compared to the earlier generation photochemical source equipped with a conventional phosphor-coated Hg lamp.
5
2 Methods
2.1 UV-LED photochemical source
A photograph of the new UV-LED photochemical source is shown in Fig. 1. At the center, it contains a cylindrical quartz reaction chamber with the following dimensions: length=22.3 cm, outer diameter (o.d.)=4.9 cm, internal volume=450.5 cm3, and wall
10
thickness=0.1 cm. The chamber was mounted inside a 19′′width, rack mount metal case (Hammond PBPA19003BK2) but could have readily been mounted in a smaller enclosure if that had been desired. UV-LEDs were selected for best overlap with the (n→π∗) band of the ketones (see Fig. 2 of Furgeson et al., 2011); the LEDs chosen in this work (Thorlabs LED285W) have a manufacturer-specified center wavelength of
15
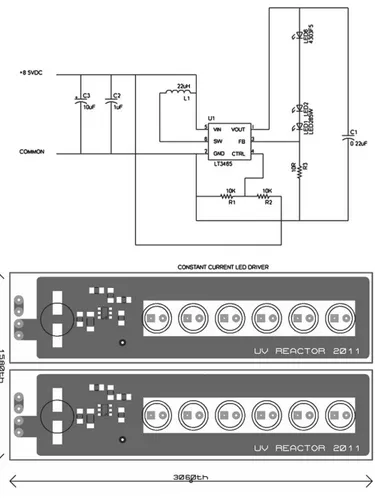
285±5 nm, a full-width at half-maximum (FWHM) of 12 nm, and typical optical power of 0.80 mW. The UV-LEDs were mounted on two arrays, which were designed and con-structed in-house (Fig. S1). Each array has the capacity to hold three UV-LEDs and contains a LT3465 LED driver integrated circuit to ensure a regulated constant current flow through each of the LEDs. Four LEDs were installed for the work presented here,
20
drawing a combined total of 1.7 W of electrical power (for comparison: the two Hg lamp sources described by Furgeson et al. (2011) consume 51 and 58 W, respectively, half of which was required to operate the cooling fans). The diode arrays were mounted on opposite sides and in parallel to the reaction chamber (Fig. 1). Their optical output is quite divergent (manufacturer-specified half-viewing angle of 60◦), and this
configura-25
AMTD
8, 905–934, 2015Efficient photochemical generation of PANs
N. D. Rider et al.
Title Page
Abstract Introduction
Conclusions References
Tables Figures
◭ ◮
◭ ◮
Back Close
Full Screen / Esc
Printer-friendly Version
Interactive Discussion
Discussion
P
a
per
|
Discussion
P
a
per
|
Discussion
P
a
per
|
Discussion
P
a
per
|
need to focus the LED outputs. Trials with quartz lenses did not produce higher PAN yields (data not shown).
Reagent gases were delivered in a similar fashion as described by Furgeson et al. (2011) and combined before entering the quartz chamber. The ketones were either delivered from a cylinder containing 13C-labeled acetone (Scott-Marrin,
5
18.68 ppmv, balance zero air) or by passing O2 (Praxair) through a 3-valve glass trap
(as shown in Fig. 1 of Furgeson et al., 2011) containing liquid acetone, DIEK, DIPK, or DNPK (Sigma-Aldrich), which were used as received.
The gas stream containing the ketone was delivered at flow rates in the range of 10 to 50 sccm (standard cubic centimeters per minute) set using a mass flow controller
10
(MFC, Celerity, 100 scc m−1
capacity). NO (Scott-Marrin, 1.960 ppmv, balance N2) was added at flow rates in the range from 0.2 to 12 scc m−1using an all-metal MFC (MKS, 1479 series). Under these conditions, residence times in the chamber ranged from 7 to 44 min (typically 15 min).
The gas mixture exiting the reaction chamber was passed through a 1 m long section
15
of coiled 0.25′′ o.d. Teflon tube to ensure that the reactions go to completion. The eluting mixture was then diluted with up to 6 standard liters per minute (slpm) of zero air (Praxair) delivered by a third MFC (MKS, M100B series, 15 slpm capacity), and analyzed as described below.
2.2 Gas chromatography
20
Initial experiments were carried out using a Hewlett-Packard (HP) 5890 Series II gas chromatograph equipped with an ECD detector which was converted into a PAN-GC in a similar fashion as described by Fischer et al. (2010) and Tokarek et al. (2014). Briefly, the instrument was equipped with a two-position sample valve (VICI Valco EHC10WE), which was automated using a 14-bit data acquisition module (Omega USB-1408) and
25
AMTD
8, 905–934, 2015Efficient photochemical generation of PANs
N. D. Rider et al.
Title Page
Abstract Introduction
Conclusions References
Tables Figures
◭ ◮
◭ ◮
Back Close
Full Screen / Esc
Printer-friendly Version
Interactive Discussion
Discussion
P
a
per
|
Discussion
P
a
per
|
Discussion
P
a
per
|
Discussion
P
a
per
|
Helium (Praxair) which was purified with the aid of a “triple trap” (Restek 22473) and re-humidified using copper sulfate pentahydrate (Aldrich) for reasons outlined by Flocke et al. (2005). The carrier gas flow rate was 18 mL min−1. Ultrapure N2 (Praxair, ECD
grade) was used as the make-up gas at a flow rate of 22 mL min−1(which was optimized to give the lowest background counts). Both flows were measured at the exhaust using
5
a digital flow meter (Restek ProFLOW 6000) and set daily. The ECD and GC oven were operated at temperatures of 30◦C and 27◦C, respectively. Both temperatures were deliberately set to above room temperature to avoid fluctuations in ECD response factors and column elution times. Peak fitting and data reduction were as described by Tokarek et al. (2014). Some experiments were replicated using the group’s Varian
PAN-10
GC whose construction and operation have been described by Tokarek et al. (2014).
2.3 Thermal dissociation cavity ring-down spectroscopy
The blue diode laser TD-CRDS used in this work was a modified version of the instru-ment described by Paul and Osthoff(2010). Briefly, NO2 was measured via its optical
absorption at 405 nm in an ambient temperature detection channel. Total
peroxycar-15
boxylic nitric anhydrates nitrates (ΣPN) were dissociated to NO2 in a heated detection
channel at an inlet temperatures of 250◦C (Day et al., 2002; Paul et al., 2009; Paul and Osthoff, 2010; Wooldridge et al., 2010) and quantified by difference. A recently added detection channel served to quantify NOx(=NO+NO2) through addition of excess O3,
which titrates NO to NO2, and hence allowed NO mixing ratios to be calculated by 20
subtraction (Fuchs et al., 2009). For the subtraction, it was assumed that the response to NO2was equal in all channels; in practice, the response varied somewhat between
channels (e.g., because of differences in the purge flows protecting the ring-down mir-rors), which limited the accuracy of the yields (presented in Sect. 3.2) to±5 % in this work.
25
DIEK gave rise to an offset in all CRDS channels equivalent to∼2.0 ppbv of NO2and
AMTD
8, 905–934, 2015Efficient photochemical generation of PANs
N. D. Rider et al.
Title Page
Abstract Introduction
Conclusions References
Tables Figures
◭ ◮
◭ ◮
Back Close
Full Screen / Esc
Printer-friendly Version
Interactive Discussion
Discussion
P
a
per
|
Discussion
P
a
per
|
Discussion
P
a
per
|
Discussion
P
a
per
|
cooling the trap in an ice-water bath and partially bypassing the oxygen flow. An offset was observed with DIPK and DNPK as well, equivalent to∼0.4 ppbv of NO2. This offset
could be lowered to∼60 pptv when the trap was cooled in an ice-water bath. Since the magnitudes of these offsets were the same in all CRDS channels, the differences, i.e., the NO andΣPN mixing ratios crucial to the work presented here, remained usable for
5
quantification.
2.4 Box modeling
A box model was constructed from a subset of the MCM V3.2 obtained from http: //mcm.leeds.ac.uk/MCM and run using the Atchem on-line tool V1.5 (Jenkin et al., 1997, 2012; Saunders et al., 2003) to simulate the production of PAN, PPN, and PiBN
10
in the photochemical source. The mechanism was modified as described below and included as a Supplement.
The MCM contains the chemistry of DIEK and its degradation products, but nei-ther DNPK nor DIPK are part of the MCM V3.2. The photo-dissociation of DIPK was added by using ethyl isopropyl ketone (EIPK) in its place and modifying the
15
photo-products to isopropylperoxy and peroxyisobutyryl radical, i.e., (CH3)2CHCO2and
(CH3)2CHC(O)O2. In the MCM, the thermal decomposition rate of PiBN defaults to that of PAN; in this work, it was set to that of PPN, which is slower and more in line with recent experimental work (Kabir et al., 2014). In addition, the yield of methyl nitrate (CH3ONO2) in the reaction between the methylperoxy radical (CH3O2) and NO was 20
increased from 0.1 to 1 % (Williams et al., 2014). Other studies (e.g., Scholtens et al., 1999) have reported a lower yield in the CH3ONO2branching channel, but the larger
value is used here as a precaution. Finally, photolysis reactions for PAN, PPN, PiBN and HO2NO2were added. Photolysis frequencies were calculated using cross-sections and quantum yields recommended by the NASA-JPL evaluation (Sander et al., 2010).
25
us-AMTD
8, 905–934, 2015Efficient photochemical generation of PANs
N. D. Rider et al.
Title Page
Abstract Introduction
Conclusions References
Tables Figures
◭ ◮
◭ ◮
Back Close
Full Screen / Esc
Printer-friendly Version
Interactive Discussion
Discussion
P
a
per
|
Discussion
P
a
per
|
Discussion
P
a
per
|
Discussion
P
a
per
|
ing 1.5×10¹¹molecules cm−3 of NO and 1.5×10¹¹molecules cm−3 of the respective dialkyl ketone at 293 K and a water vapor mixing ratio of 10 ppmv. Yields of PPN were also investigated at temperatures of 300, 311, and 323 K (for comparison with Fig. 5 of Volz-Thomas et al., 2002) and with water mixing ratios of 0.1 %.
2.5 Diffusion standards
5
PAN, PPN, and PiBN were synthesized as described by Mielke and Osthoff (2012).
Ethyl and n-propyl nitrate were synthesized from the reaction dinitrogen pentoxide (N2O5) with a corresponding alcohol following the method of Kames et al. (1993), and
i-propyl and i-butyl nitrate were purchased from Sigma-Aldrich and used as received.
3 Results
10
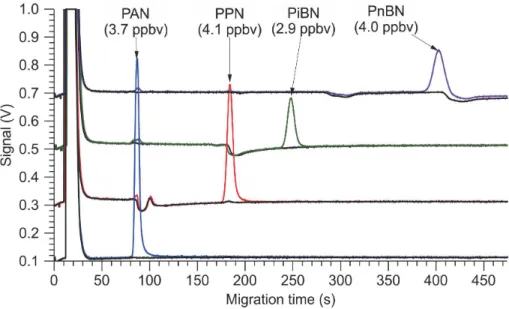
3.1 Gas chromatograms
Sample gas chromatograms (acquired with the Varian PAN-GC) of the photochemical source output are shown in Fig. 2. The same amount of NO (∼4.1 ppbv) was added in each experiment. The acetone, DIEK, and DIPK glass traps were cooled in a water-ice bath and partially by-passed to reduce the amount of ketone delivered.
15
Shown in black color are chromatograms of the source output before the UV-LEDs were switched on. DIEK, DIPK, and DNPK eluted as negative peaks at 95, 190, and 426 s, respectively. In addition, the chromatogram of DIEK contained two impurity peaks at 90 and 102 s, that of DIPK an impurity eluting at 84 s, and that of DNPK a second negative peak at 302 s. These peaks were more pronounced when the
by-20
pass of the glass trap was closed and a larger ketone concentration was delivered (data not shown).
AMTD
8, 905–934, 2015Efficient photochemical generation of PANs
N. D. Rider et al.
Title Page
Abstract Introduction
Conclusions References
Tables Figures
◭ ◮
◭ ◮
Back Close
Full Screen / Esc
Printer-friendly Version
Interactive Discussion
Discussion
P
a
per
|
Discussion
P
a
per
|
Discussion
P
a
per
|
Discussion
P
a
per
|
these peaks were approximately 86, 188, 246, and 403 s, respectively, and consistent with those observed with diffusion standards and the relative elution times reported by Tanimoto et al. (1999), who had also used a RTX-1701 column to separate PANs. TheΣPN mixing ratios (shown as labels on the graph) indicate nearly quantitative con-version of NO to the respective peroxyacyl nitrate, with exception of PiBN. Here, the
5
remainder appeared as NO2, which suggests that PiBN production was limited by the
production of peroxyisopropionyl radical in this particular experiment.
No impurity peaks were observed in the chromatogram generated from acetone. Ad-ditional features appeared in the chromatograms of the other compounds upon photol-ysis, however: with DIEK (red trace), the peak at 90 s increased slightly in height; this
10
peak’s retention time is consistent with PAN. There was no evidence of ethyl nitrate (which elutes about halfway between the oxygen peak and PAN). With DIPK (green trace), two small peaks were observed at 84 and 90 s (combined area∼17 % that of PiBN). The first peak is likely due to isopropyl nitrate. The second peak’s retention time is consistent with that of PAN. With DNPK, peaks appeared at 90 s (PAN) and 188 s
15
(PPN) with a combined area∼3 % that of PnBN, and the reagent peaks at 302 and
426 s decreased in height.
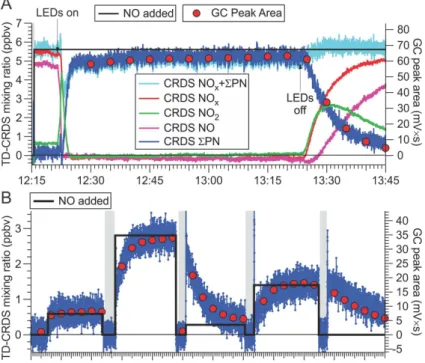
3.2 NO to PAN, PPN, PiBN and PnBN conversion efficiency
A time series of the CRDS NO (shown in magenta), NO2 (green), NOx (=NO+NO2, red), ΣPN (blue), and NOx+ ΣPN (turquoise) mixing ratios while the photochemical 20
source was operated with DIEK to generate PPN is shown in Fig. 3a. Superimposed as red circles are the PPN peak areas observed by the HP PAN-GC. The black trace shows the delivered amount of NO, calculated using the gas cylinder concentration and gas flows (estimated accuracy±10 %). Between 12:15 and 12:21, the instruments sampled the output of the photochemical source with its UV light off. A small fraction
25
of the NO had already oxidized (in the dark) to NO2, likely due to the 2nd-order
auto-oxidation of NO in the presence of O2. At 12:21, the UV-LEDs were switched on. Full
AMTD
8, 905–934, 2015Efficient photochemical generation of PANs
N. D. Rider et al.
Title Page
Abstract Introduction
Conclusions References
Tables Figures
◭ ◮
◭ ◮
Back Close
Full Screen / Esc
Printer-friendly Version
Interactive Discussion
Discussion
P
a
per
|
Discussion
P
a
per
|
Discussion
P
a
per
|
Discussion
P
a
per
|
and the appearance of PPN. TheΣPN mixing ratio was slightly lower (93.9 %) than the mixing ratio of NOxobserved earlier (and after the LED had been turned off), indicating
that NO converted in nearly quantitative yield to PPN. At 13:22, the UV-LEDs were switched off, PPN disappeared, and NO2and NO reappeared, respectively.
Figure 3b shows a time series in which the amount of NO reagent was deliberately
5
varied. In addition, the output of the photochemical source was occasionally by-passed (gray underlay) to “zero” the instruments. In this experiment, the amount of PPN gen-erated scaled directly with the amount of NO added, such that NO acted as the limiting reagent. When the amount of NO added was changed, the response was delayed as a result of the relatively slow flow rates through the reaction chamber. However, the
10
TD-CRDS and PAN-GC signals were sufficiently correlated such that linear calibration plots could be generated from these data (see Sect. 3.4).
In experiments similar to the one described above (not shown), conversion of NO in acetone to PAN was observed to be quantitative within TD-CRDS measurement error (±5 %). The yields of PiBN and PnBN (measured asΣPN) relative to the amount of NOx 15
observed by TD-CRDS prior to photolysis were as high as (96±5) % and (97±5) %, respectively. The yields were lower when production was limited by the rate of peroxy-acyl radical production (i.e., ketone concentration) as shown for PiBN in Fig. 2. Yields were also lower when the source was operated at a warmer temperature.
3.3 Comparison of UV-LED with Hg lamp photochemical source
20
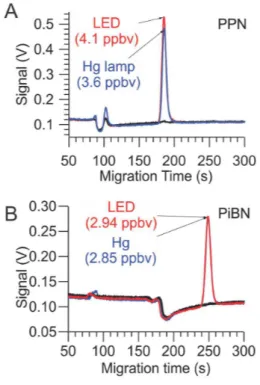
The performance of the UV-LED photochemical source was directly compared to the photochemical source containing a phosphor-coated Hg lamp described by Furgeson et al. (2011). A comparison of PPN and PiBN production is shown in Fig. 4. Both sources convert approximately the same amount of NO to PPN or PiBN, with a slightly higher yield when the UV-LED setup was used, especially after the Hg setup was
oper-25
AMTD
8, 905–934, 2015Efficient photochemical generation of PANs
N. D. Rider et al.
Title Page
Abstract Introduction
Conclusions References
Tables Figures
◭ ◮
◭ ◮
Back Close
Full Screen / Esc
Printer-friendly Version
Interactive Discussion
Discussion
P
a
per
|
Discussion
P
a
per
|
Discussion
P
a
per
|
Discussion
P
a
per
|
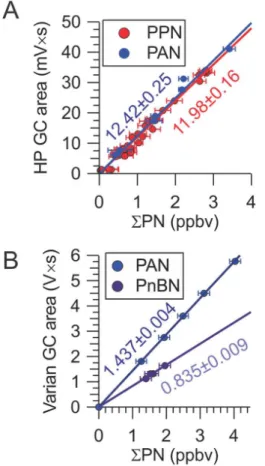
3.4 Sample calibration plots
Sample calibration plots of HP PAN-GC peak areas againstΣPN for PAN and PPN are shown in Fig. 5a, and sample calibration plots of Varian PAN-GC peak areas for PAN and PnBN are shown in Fig. 5b. In these experiments, the mixing ratio of NO delivered was systematically varied to vary theΣPN output.ΣPN mixing ratios were averaged
5
over 20 s prior to the time of the PAN-GC injection. Data above mixing ratios of 10 ppbv were not used in these plots as the TD-CRDS response is non-linear above this mixing ratio (Paul et al., 2009; Paul and Osthoff, 2010). The data shown in Fig. 5 were each collected on the same day, as PAN-GC response factors varied between days (as the flows were turned down in the evenings to conserve gas and reset in the mornings).
10
For the HP PAN-GC, the slopes (in units of mV s ppbv−1) of these calibration curves were 12.42±0.25 (r =0.997) for PAN and 11.98±0.16 (r=0.992) for PPN, respec-tively. The PAN and PPN response factors were identical to those obtained with dif-fusion standards, and the relative responses of PAN : PPN of 1 : (0.965±0.023) are consistent with recent results in the literature (e.g., Flocke et al., 2005; Tokarek et al.,
15
2014).
For the Varian PAN-GC, the slopes (in units of V s ppbv−1) were 1.437±0.004 (r = 0.9999) for PAN and 0.835±0.009 (r =0.9988) for PnBN, i.e., the relative response of PAN : PnBN was 1 : (0.585±0.007).
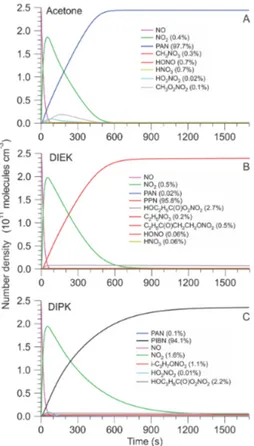
3.5 Box model simulations
20
Figure 6 shows the results of the box model simulations. Table 1 summarizes the ratios (relative to NOy) at the end of each simulation run. In all three cases, the desired
perox-ycarboxylic nitric anhydride is predicted as the major nitrogen oxide product (>94 %), consistent with experiment.
Stable side products include the expected alkyl nitrates CH3ONO2, C2H5ONO2and 25
AMTD
8, 905–934, 2015Efficient photochemical generation of PANs
N. D. Rider et al.
Title Page
Abstract Introduction
Conclusions References
Tables Figures
◭ ◮
◭ ◮
Back Close
Full Screen / Esc
Printer-friendly Version
Interactive Discussion
Discussion
P
a
per
|
Discussion
P
a
per
|
Discussion
P
a
per
|
Discussion
P
a
per
|
of DIEK or DIPK with OH (and subsequent reaction with NO2) in 0.516 and 0.661 % yield, respectively. The latter alkyl nitrates are not expected to elute on the time scale of the chromatograms shown in Fig. 2. Nitrous and nitric acid are negligible side prod-ucts with DIEK and DIPK at yields of<0.1 %, but are each produced from acetone with a yield of 0.7 %, respectively. In the case of DIEK and DIPK, the model predicts
forma-5
tion of hydroxyl group bearing PANs (yield 2.74 and 2.23 % relatively to NOy). These
would likely elute well after PPN and PIBN and hence not interfere with the PAN-GC, but would systematically biasΣPN high. However, it has been suggested (e.g., Zheng et al., 2011) that hydroxy-PANs such asβ-hydroxyperoxyacetic nitric anhydride (HPAN) are unstable with respect to unimolecular decomposition, such that is unclear if their
10
formation ultimately has any impact.
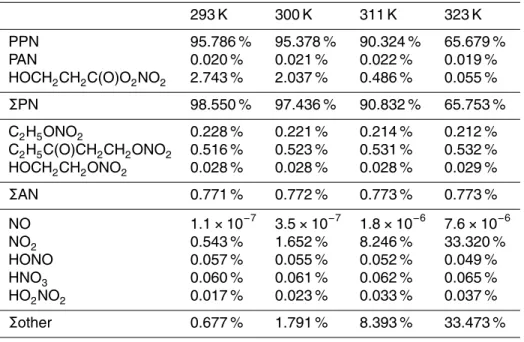
In all cases, NO2is predicted as a side product (yields at 293 K: 0.416, 0.543, and
1.600 %, respectively). To assess the yields of NO2 and other products at higher
op-erating temperatures (which may be encountered with a Hg lamp setup), additional simulations were carried out at 300, 311, and 323 K, respectively. Table 2 summarizes
15
the results. More NO2 and less PPN are produced as the temperature is increased,
as expected. In contrast to results reported by Volz-Thomas et al. (2002), less ethyl nitrate is produced as the temperature is increased. The predicted product yields re-mained essentially unchanged (<0.1 % difference) when the water mixing ratio was increased from 10 ppm to 0.1 % (data not shown).
20
4 Discussion
4.1 UV-LEDs vs. Hg lamps
The UV-LED photochemical source is an improvement over its Hg lamp predecessor in several regards. Perhaps most importantly, it generates a higher purity and cleaner out-put than we were able to achieve with the Hg setup (Fig. 4). There are multiple reasons
25
AMTD
8, 905–934, 2015Efficient photochemical generation of PANs
N. D. Rider et al.
Title Page
Abstract Introduction
Conclusions References
Tables Figures
◭ ◮
◭ ◮
Back Close
Full Screen / Esc
Printer-friendly Version
Interactive Discussion
Discussion
P
a
per
|
Discussion
P
a
per
|
Discussion
P
a
per
|
Discussion
P
a
per
|
generation of heat. The narrower wavelength range of UV-LEDs is an advantage in that the UV-C radiation emitted by Hg lamps can lead to unwanted side reactions (e.g., PAN photolysis), whereas the output of the UV-LED maximizes ketone photo-dissociation. Hg lamps generate a considerable amount of heat, which is redistributed using a fan or blower; this, in closed environments can still warm up the photochemical reaction
5
chamber, which dissociates PANs to peroxyacyl radicals and NO2 (Table 2). In
con-trast, UV-LEDs dissipate virtually no heat. Further, the low power consumption of the source may be useful in remote environments, where power can be scarce.
Another key advantage of using UV-LEDs is design flexibility. The compact nature of the diodes provides flexibility to alter the chamber geometry and to incorporate this
10
type of source in a tight space, which can be an important consideration in tight spaces during field deployments (e.g., on an aircraft). One possible design improvement is to use a hollow cylinder, with the LED arrays mounted inside, facing outward. This design would potentially allow for more efficient absorption of all photons emitted, in particular if the outside of the reactor were to be covered with a reflective coating.
15
Furthermore, the UV-LED setup has a low risk of breakage and long expected life-time; in contrast, with a Hg lamp, there is always a risk of exposing the operator to toxic mercury vapor. At this point, we have insufficient data to tell if there are any significant differences to the conventional Hg lamp setup in terms of longevity, but this will be evaluated in future experiments.
20
The only disadvantage of the LED setup is its price to construct; each of the UV-LEDs currently retails for about the same price as a phosphor-coated Hg lamp. There is also the added cost to construct the diode array driver circuits. At the same time, the ability to combine LEDs into arrays is an enormous advantage as the output of the source can be increased further simply by adding more diodes. With Hg lamps, that
25
AMTD
8, 905–934, 2015Efficient photochemical generation of PANs
N. D. Rider et al.
Title Page
Abstract Introduction
Conclusions References
Tables Figures
◭ ◮
◭ ◮
Back Close
Full Screen / Esc
Printer-friendly Version
Interactive Discussion
Discussion
P
a
per
|
Discussion
P
a
per
|
Discussion
P
a
per
|
Discussion
P
a
per
|
4.2 Efficient photochemical production of PPN, PiBN, and PnBN
The photochemical production PAN from acetone observed in this work is consistent with literature (e.g., Meyrahn et al., 1987; Warneck and Zerbach, 1992; Pätz et al., 2002; Volz-Thomas et al., 2002; Flocke et al., 2005) and hence does not require further discussion. Production of PPN, PiBN, and PnBN from DIEK, DIPK, and DNPK is less
5
established (Furgeson et al., 2011) and has not been studied by PAN-GC or by MCM box modeling prior to this work.
The chromatograms in Fig. 2 show PPN, PiBN, and PnBN are indeed produced in high purity, consistent with box model results (Fig. 5) that show PPN and PiBN as the expected major photoproducts with yields >90 %. This result is consistent with
10
the work by Furgeson et al. (2011) but contradicts the earlier work by Volz-Thomas et al. (2002), who first evaluated generation of PPN from DIEK using a Hg lamp and presented a chromatogram similar to the one shown in Fig. 2. In their work, they identi-fied a large impurity peak as ethyl nitrate. We also observed a peak at about the same relative retention time (∼102 s) which was present “in the dark”, i.e., before the
photo-15
chemical source was turned on. However, this retention time is inconsistent with ethyl nitrate which we verified elutes much earlier, consistent with Roberts et al. (1989), and whose area was considerably reduced when we lowered the DIEK output from the trap. Further, ethyl nitrate is predicted only as a minor product in DIEK photoly-sis (Table 1). Because we observe nearly quantitative conversion of NO to PPN, the
20
peak we observe at 102 s is most likely an impurity present in the DIEK reagent in our experiments. Regardless, the use of UV-LEDs has apparently reduced alkyl nitrate co-generation to a negligible level.
The use of DIEK, DIPK, and DNPK has a disadvantage in that they give rise to negative peaks in the chromatograms. Apparently, the dialkyl ketones do not “capture”
25
AMTD
8, 905–934, 2015Efficient photochemical generation of PANs
N. D. Rider et al.
Title Page
Abstract Introduction
Conclusions References
Tables Figures
◭ ◮
◭ ◮
Back Close
Full Screen / Esc
Printer-friendly Version
Interactive Discussion
Discussion
P
a
per
|
Discussion
P
a
per
|
Discussion
P
a
per
|
Discussion
P
a
per
|
their respective PAN photoproducts. In the case of DNPK, multiple negative peaks suggest the presence of at least one ketone impurity in the DNPK sample.
The chromatograms in Fig. 2 show PAN as a very minor side product when DIEK, DIPK or DNPK were used. However, PAN was not observed in all experiments. We suspect that it arises because acetone was used to clean the glass trap between uses,
5
or perhaps because acetone was present as a trace impurity in the reagents. Be it as it may, the interference from PAN in these experiments is negligibly small.
4.3 Use of thermal dissociation methods with photochemical sources
The use of the photochemical sources gives rise to offsets in the CRDS absorption signals (Furgeson et al., 2011) which needs to be taken into account when reducing
10
the data. The species causing this offset does not appear to be generated in the pho-tochemical source, as it is there before the lights are turned on. Simple ketones do not significantly absorb at 405 nm (Martinez et al., 1992), butα,β-dicarbonyls such as glyoxal do (Fuchs et al., 2009). We speculate that the interfering species are dialkyl diketones, generated from dimerization of acyl radicals which are produced during
ke-15
tone photolysis, and that these species are generated slowly in the reagent solutions. We were able to reduce, but not completely eliminate, these offsets by lowering the ke-tone concentrations in the photochemical source. Fortunately, sinceΣPN and NO were both determined by difference and the offset appeared to affect all CRDS channels equally, these offsets were of no further consequence in this work.
20
4.4 Use of photochemical sources for calibration of PAN instruments
Overall, this work has demonstrated that it is possible to use dialkyl ketones to generate PAN, PPN, and PiBN in the same high yields and purity as reported for the acetalde-hyde and propanal methods (Volz-Thomas et al., 2002). The source output sufficed to calibrate the two PAN-GCs against TD-CRDS with linear scatter plots.
AMTD
8, 905–934, 2015Efficient photochemical generation of PANs
N. D. Rider et al.
Title Page
Abstract Introduction
Conclusions References
Tables Figures
◭ ◮
◭ ◮
Back Close
Full Screen / Esc
Printer-friendly Version
Interactive Discussion
Discussion
P
a
per
|
Discussion
P
a
per
|
Discussion
P
a
per
|
Discussion
P
a
per
|
The source has not yet been optimized for maximum output concentration. When a large excess of ketone was delivered by closing the by-pass valve of the glass traps, mixing ratios in excess of 50 ppbv PPN could be generated from NO (data not shown). However, large ketone concentrations were not desirable in this work as they generated large negative peaks in the GC chromatograms and large positive offsets in the
TD-5
CRDS signal.
The conversion of NO to the PAN products was sufficiently high such that the UV-LED photochemical source could have been used for calibration even if only a NO chemiluminescence measurement or a well calibrated NO delivery system had been on hand. However, because the PAN yield is dependent on temperature (Table 2),
10
calibration of PAN on the basis of the amount of NO added alone may not be advisable in all field campaign settings.
The Supplement related to this article is available online at doi:10.5194/amtd-8-905-2015-supplement.
Acknowledgements. This work was supported by the Natural Science and Engineering
Re-15
search Council of Canada (NSERC) in form of a Discovery grant (to H. D. Osthoff), a post-doctoral fellowship (to S. G. Moussa), two undergraduate student research awards (USRA, to N. D. Rider and J. A. Huo) and the CREATE program IACPES, which provided matching undergraduate student stipends (to N. D. Rider and J. A. Huo) and a graduate student scholar-ship (to Y. M. Taha) The authors thank the Open Access Authors Fund, Libraries and Cultural
20
Resources, University of Calgary for covering the publication fees.
References
Darley, E. F., Kettner, K. A., and Stephens, E. R.: Analysis of peroxyacyl nitrates by gas chromatography with electron capture detection, Anal. Chem., 35, 589–591, doi:10.1021/ac60197a028, 1963.
AMTD
8, 905–934, 2015Efficient photochemical generation of PANs
N. D. Rider et al.
Title Page
Abstract Introduction
Conclusions References
Tables Figures
◭ ◮
◭ ◮
Back Close
Full Screen / Esc
Printer-friendly Version
Interactive Discussion
Discussion
P
a
per
|
Discussion
P
a
per
|
Discussion
P
a
per
|
Discussion
P
a
per
|
Day, D. A., Wooldridge, P. J., Dillon, M. B., Thornton, J. A., and Cohen, R. C.: A thermal dissoci-ation laser-induced fluorescence instrument for in situ detection of NO2, peroxy nitrates, alkyl nitrates, and HNO3, J. Geophys. Res., 107, D6, 4046, doi:10.1029/2001JD000779, 2002. Fischer, E. V., Jaffe, D. A., Reidmiller, D. R., and Jaegle, L.: Meteorological controls on observed
peroxyacetyl nitrate at Mount Bachelor during the spring of 2008, J. Geophys. Res., 115,
5
D03302, doi:10.1029/2009JD012776, 2010.
Flocke, F. M., Weinheimer, A. J., Swanson, A. L., Roberts, J. M., Schmitt, R., and Shertz, S.: On the measurement of PANs by gas chromatography and electron capture detection, J. Atmos. Chem., 52, 19–43, doi:10.1007/s10874-005-6772-0, 2005.
Fuchs, H., Dubé, W. P., Lerner, B. M., Wagner, N. L., Williams, E. J., and Brown, S. S.: A
sen-10
sitive and versatile detector for atmospheric NO2and NOxbased on blue diode laser cavity ring-down spectroscopy, Environm. Sci. Technol., 43, 7831–7836, doi:10.1021/es902067h, 2009.
Furgeson, A., Mielke, L. H., Paul, D., and Osthoff, H. D.: A photochemical source of per-oxypropionic and peroxyisobutanoic nitric anhydride, Atmos. Environ., 45, 5025–5032,
15
doi:10.1016/j.atmosenv.2011.03.072, 2011.
Jenkin, M. E., Saunders, S. M., and Pilling, M. J.: The tropospheric degradation of volatile organic compounds: a protocol for mechanism development, Atmos. Environ., 31, 81–104, doi:10.1016/S1352-2310(96)00105-7, 1997.
Jenkin, M. E., Wyche, K. P., Evans, C. J., Carr, T., Monks, P. S., Alfarra, M. R., Barley, M. H.,
20
McFiggans, G. B., Young, J. C., and Rickard, A. R.: Development and chamber evaluation of the MCM v3.2 degradation scheme forβ-caryophyllene, Atmos. Chem. Phys., 12, 5275– 5308, doi:10.5194/acp-12-5275-2012, 2012.
Kabir, M., Jagiella, S., and Zabel, F.: Thermal stability of n-acyl peroxynitrates, Int. J. Chem. Kinet., 46, 462–469, doi:10.1002/kin.20862, 2014.
25
Kames, J., Schurath, U., Flocke, F., and Volzthomas, A.: Preparation of organic nitrates from alcohols and N2O5 for species identification in atmospheric samples, J. Atmos. Chem., 16, 349–359, doi:10.1007/BF01032630, 1993.
Martinez, R. D., Buitrago, A. A., Howell, N. W., Hearn, C. H., and Joens, J. A.: The near-UV absorption spectra of several aliphatic aldehydes and ketones at 300 K, Atmos. Environm. A,
30
AMTD
8, 905–934, 2015Efficient photochemical generation of PANs
N. D. Rider et al.
Title Page
Abstract Introduction
Conclusions References
Tables Figures
◭ ◮
◭ ◮
Back Close
Full Screen / Esc
Printer-friendly Version
Interactive Discussion
Discussion
P
a
per
|
Discussion
P
a
per
|
Discussion
P
a
per
|
Discussion
P
a
per
|
Meyrahn, H., Helas, G., and Warneck, P.: Gas-chromatographic determination of perox-yacyetyl nitrate – 2 convenient calibration techniques, J. Atmos. Chem., 5, 405–415, doi:10.1007/bf00113903, 1987.
Mielke, L. H. and Osthoff, H. D.: On quantitative measurements of peroxycarboxylic nitric an-hydride mixing ratios by thermal dissociation chemical ionization mass spectrometry, Int. J.
5
Mass Spectrom., 310, 1–9, doi:10.1016/j.ijms.2011.10.005, 2012.
Mielke, L. H., Stutz, J., Tsai, C., Hurlock, S. C., Roberts, J. M., Veres, P. R., Froyd, K. D., Hayes, P. L., Cubison, M. J., Jimenez, J. L., Washenfelder, R. A., Young, C. J., Gilman, J. B., de Gouw, J. A., Flynn, J. H., Grossberg, N., Lefer, B. L., Liu, J., Weber, R. J., and Osthoff, H. D.: Heterogeneous formation of nitryl chloride and its role as a nocturnal
10
NOx reservoir species during CalNex-LA 2010, J. Geophys. Res., 118, 10638–10652, doi:10.1002/jgrd.50783, 2013.
Pätz, H.-W., Lerner, A., Houben, N., and Volz-Thomas, A.: Validation of a new method for the calibration of peroxy acetyl nitrate (PAN)-analyzers, Gefahrst. Reinhalt. L., 62, 215–219, 2002.
15
Paul, D. and Osthoff, H. D.: Absolute measurements of total peroxy nitrate mixing ratios by thermal dissociation blue diode laser cavity ring-down spectroscopy, Anal. Chem., 82, 6695– 6703, doi:10.1021/ac101441z, 2010.
Paul, D., Furgeson, A., and Osthoff, H. D.: Measurement of total alkyl and peroxy nitrates by thermal decomposition cavity ring-down spectroscopy, Rev. Sci. Instrum., 80, 114101,
20
doi:10.1063/1.3258204, 2009.
Roberts, J. M.: The atmospheric chemistry of organic nitrates, Atmos. Environm. A, 24, 243– 287, doi:10.1016/0960-1686(90)90108-Y, 1990.
Roberts, J. M.: PAN and related compounds, in: Volatile Organic Compounds in the Atmo-sphere, edited by: Koppmann, R., Blackwell Publishing, Oxford, UK, 221–268, 2007.
25
Roberts, J. M., Fajer, R. W., and Springston, S. R.: Capillary gas chromatographic sepa-ration of alkyl nitrates and peroxycarboxylic nitric anhydrides, Anal. Chem., 61, 771–772, doi:10.1021/ac00182a026, 1989.
Sander, S. P., Abbatt, J. P. D., Barker, J. R., Burkholder, J. B., Friedl, R. R., Golden, D. M., Huie, R. E., Kolb, C. E., Kurylo, M. J., Moortgat, G. K., Orkin, V. L., and Wine, P. H.: Chemical
30
AMTD
8, 905–934, 2015Efficient photochemical generation of PANs
N. D. Rider et al.
Title Page
Abstract Introduction
Conclusions References
Tables Figures
◭ ◮
◭ ◮
Back Close
Full Screen / Esc
Printer-friendly Version
Interactive Discussion
Discussion
P
a
per
|
Discussion
P
a
per
|
Discussion
P
a
per
|
Discussion
P
a
per
|
Saunders, S. M., Jenkin, M. E., Derwent, R. G., and Pilling, M. J.: Protocol for the development of the Master Chemical Mechanism, MCM v3 (Part A): tropospheric degradation of non-aromatic volatile organic compounds, Atmos. Chem. Phys., 3, 161–180, doi:10.5194/acp-3-161-2003, 2003.
Scholtens, K. W., Messer, B. M., Cappa, C. D., and Elrod, M. J.: Kinetics of the CH3O2+NO
5
reaction: temperature dependence of the overall rate constant and an improved up-per limit for the CH3ONO2 branching channel, J. Phys. Chem. A, 103, 4378–4384, doi:10.1021/jp990469k, 1999.
Singh, H. B. and Hanst, P. L.: Peroxyacetyl nitrate (PAN) in the unpolluted atmo-sphere – an important reservoir for nitrogen oxides, Geophys. Res. Lett., 8, 941–944,
10
doi:10.1029/GL008i008p00941, 1981.
Slusher, D. L., Huey, L. G., Tanner, D. J., Flocke, F. M., and Roberts, J. M.: A thermal dissociation-chemical ionization mass spectrometry (TD-CIMS) technique for the simulta-neous measurement of peroxyacyl nitrates and dinitrogen pentoxide, J. Geophys. Res., 109, D19315, doi:10.1029/2004JD004670, 2004.
15
Tanimoto, H., Hirokawa, J., Kajii, Y., and Akimoto, H.: A new measurement technique of peroxyacetyl nitrate at parts per trillion by volume levels: gas chromatography/negative ion chemical ionization mass spectrometry, J. Geophys. Res., 104, 21343–21354, doi:10.1029/1999JD900345, 1999.
Tokarek, T. W., Huo, J. A., Odame-Ankrah, C. A., Hammoud, D., Taha, Y. M., and Osthoff, H. D.:
20
A gas chromatograph for quantification of peroxycarboxylic nitric anhydrides calibrated by thermal dissociation cavity ring-down spectroscopy, Atmos. Meas. Tech., 7, 3263–3283, doi:10.5194/amt-7-3263-2014, 2014.
Volz-Thomas, A., Xueref, I., and Schmitt, R.: An automatic gas chromatograph and calibration system for ambient measurements of PAN and PPN, Environ. Sci. Pollut. R., 9, 72–76, 2002.
25
Warneck, P. and Zerbach, T.: Synthesis of peroxyacetyl nitrate in air by acetone photolysis, Environ. Sci. Technol., 26, 74–79, doi:10.1021/es00025a005, 1992.
Williams, J. E., Le Bras, G., Kukui, A., Ziereis, H., and Brenninkmeijer, C. A. M.: The impact of the chemical production of methyl nitrate from the NO+CH3O2 reaction on the global distributions of alkyl nitrates, nitrogen oxides and tropospheric ozone: a global modelling
30
study, Atmos. Chem. Phys., 14, 2363–2382, doi:10.5194/acp-14-2363-2014, 2014.
AMTD
8, 905–934, 2015Efficient photochemical generation of PANs
N. D. Rider et al.
Title Page
Abstract Introduction
Conclusions References
Tables Figures
◭ ◮
◭ ◮
Back Close
Full Screen / Esc
Printer-friendly Version
Interactive Discussion
Discussion
P
a
per
|
Discussion
P
a
per
|
Discussion
P
a
per
|
Discussion
P
a
per
|
LaFranchi, B. W., and Cohen, R. C.: Total Peroxy Nitrates (ΣPNs) in the atmosphere: the Thermal Dissociation-Laser Induced Fluorescence (TD-LIF) technique and comparisons to speciated PAN measurements, Atmos. Meas. Tech., 3, 593–607, doi:10.5194/amt-3-593-2010, 2010.
Zheng, W., Flocke, F. M., Tyndall, G. S., Swanson, A., Orlando, J. J., Roberts, J. M., Huey, L. G.,
5
AMTD
8, 905–934, 2015Efficient photochemical generation of PANs
N. D. Rider et al.
Title Page
Abstract Introduction
Conclusions References
Tables Figures
◭ ◮
◭ ◮
Back Close
Full Screen / Esc
Printer-friendly Version
Interactive Discussion
Discussion
P
a
per
|
Discussion
P
a
per
|
Discussion
P
a
per
|
Discussion
P
a
per
|
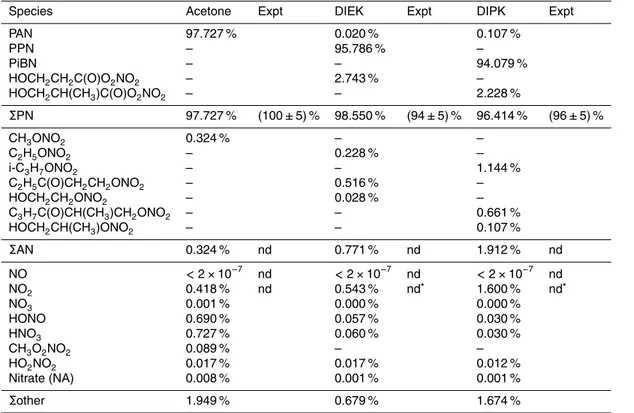
Table 1.Photo source product yields, relative to the amount of NO added, predicted by MCM box model simulations and observed. Species with an abundance of<5×10⁻⁶
relative to NOy are omitted. nd=below limit of detection.
Species Acetone Expt DIEK Expt DIPK Expt
PAN 97.727 % 0.020 % 0.107 %
PPN – 95.786 % –
PiBN – – 94.079 %
HOCH2CH2C(O)O2NO2 – 2.743 % – HOCH2CH(CH3)C(O)O2NO2 – – 2.228 %
ΣPN 97.727 % (100±5) % 98.550 % (94±5) % 96.414 % (96±5) %
CH3ONO2 0.324 % – –
C2H5ONO2 – 0.228 % –
i-C3H7ONO2 – – 1.144 %
C2H5C(O)CH2CH2ONO2 – 0.516 % –
HOCH2CH2ONO2 – 0.028 % –
C3H7C(O)CH(CH3)CH2ONO2 – – 0.661 %
HOCH2CH(CH3)ONO2 – – 0.107 %
ΣAN 0.324 % nd 0.771 % nd 1.912 % nd
NO <2×10⁻⁷
nd <2×10⁻⁷
nd <2×10⁻⁷ nd NO2 0.418 % nd 0.543 % nd∗ 1.600 % nd∗
NO3 0.001 % 0.000 % 0.000 %
HONO 0.690 % 0.057 % 0.030 %
HNO3 0.727 % 0.060 % 0.030 %
CH3O2NO2 0.089 % – –
HO2NO2 0.017 % 0.017 % 0.012 %
Nitrate (NA) 0.008 % 0.001 % 0.001 %
Σother 1.949 % 0.679 % 1.674 %
∗Measurement of NO
AMTD
8, 905–934, 2015Efficient photochemical generation of PANs
N. D. Rider et al.
Title Page
Abstract Introduction
Conclusions References
Tables Figures
◭ ◮
◭ ◮
Back Close
Full Screen / Esc
Printer-friendly Version
Interactive Discussion
Discussion
P
a
per
|
Discussion
P
a
per
|
Discussion
P
a
per
|
Discussion
P
a
per
|
Table 2.Product yields of PPN and side products as a function of temperature predicted by box modeling.
293 K 300 K 311 K 323 K PPN 95.786 % 95.378 % 90.324 % 65.679 % PAN 0.020 % 0.021 % 0.022 % 0.019 % HOCH2CH2C(O)O2NO2 2.743 % 2.037 % 0.486 % 0.055 %
ΣPN 98.550 % 97.436 % 90.832 % 65.753 % C2H5ONO2 0.228 % 0.221 % 0.214 % 0.212 % C2H5C(O)CH2CH2ONO2 0.516 % 0.523 % 0.531 % 0.532 % HOCH2CH2ONO2 0.028 % 0.028 % 0.028 % 0.029 %
ΣAN 0.771 % 0.772 % 0.773 % 0.773 % NO 1.1×10⁻⁷
3.5×10⁻⁷
1.8×10⁻⁶
7.6×10⁻⁶
NO2 0.543 % 1.652 % 8.246 % 33.320 % HONO 0.057 % 0.055 % 0.052 % 0.049 % HNO3 0.060 % 0.061 % 0.062 % 0.065 % HO2NO2 0.017 % 0.023 % 0.033 % 0.037 %
AMTD
8, 905–934, 2015Efficient photochemical generation of PANs
N. D. Rider et al.
Title Page
Abstract Introduction
Conclusions References
Tables Figures
◭ ◮
◭ ◮
Back Close
Full Screen / Esc
Printer-friendly Version
Interactive Discussion
Discussion
P
a
per
|
Discussion
P
a
per
|
Discussion
P
a
per
|
Discussion
P
a
per
|