Growth Arrest Specific 1 (
) Gene
Overexpression in Liver Reduces the
In Vivo
Progression of Murine Hepatocellular
Carcinoma and Partially Restores Gene
Expression Levels
Natalia Sacilotto1¤, Josefa Castillo1,2, Ángela L. Riffo-Campos1,2, Juana M. Flores3,
Olivia Hibbitt4, Richard Wade-Martins4, Carlos López5, M. Isabel Rodrigo1,2,
Luis Franco1,2
*, Gerardo López-Rodas1
1Department of Biochemistry and Molecular Biology, University of Valencia, Burjassot, Valencia, Spain, 2Institute of Health Research INCLIVA, Valencia, Spain,3Department of Medicine and Animal Surgery, University Complutense, Madrid, Spain,4Department of Physiology, Anatomy and Genetics, Oxford University, Oxford, United Kingdom,5Department of Cell Biology, University of Valencia, Burjassot, Valencia, Spain
¤ Current address: Ludwig Cancer Research, Oxford University, Oxford, United Kingdom *[email protected]
Abstract
The prognosis of hepatocellular carcinoma patients is usually poor, the size of tumors being a limiting factor for surgical treatments. Present results suggest that the overexpres-sion ofGas1(growth arrest specific 1) gene reduces the size, proliferating activity and malignancy of liver tumors. Mice developing diethylnitrosamine-induced hepatocellular carcinoma were subjected to hydrodynamic gene delivery to overexpressGas1in liver. This treatment significantly (p<0.05) reduced the number of large tumors, while the differ-ence in the total number of lesions was not significant. Moreover, the number of carcinoma foci in the liver and the number of lung metastases were reduced. These results are related with the finding that overexpression ofGas1in Hepa 1-6 cells arrests cell cycle before S phase, with a significant (p<0.01) and concomitant reduction in the expression of cyclin
E2 gene. In addition, a triangular analysis of microarray data shows thatGas1 overexpres-sion restores the transcription levels of 150 genes whose expresoverexpres-sion was affected in the diethylnitrosamine-induced tumors, thirteen of which are involved in the hedgehog signal-ing pathway. Since thein vivo Gas1gene delivery to livers of mice carrying hepatocellular carcinoma reduces the size and proliferating activity of tumors, partially restoring the tran-scriptional profile of the liver, the present study opens promising insights towards a thera-peutic approach for hepatocellular carcinoma.
a11111
OPEN ACCESS
Citation:Sacilotto N, Castillo J, Riffo-Campos ÁL, Flores JM, Hibbitt O, Wade-Martins R, et al. (2015) Growth Arrest Specific 1 (Gas1) Gene
Overexpression in Liver Reduces theIn Vivo
Progression of Murine Hepatocellular Carcinoma and Partially Restores Gene Expression Levels. PLoS ONE 10(7): e0132477. doi:10.1371/journal. pone.0132477
Editor:Matias A Avila, University of Navarra School of Medicine and Center for Applied Medical Research (CIMA), SPAIN
Received:April 2, 2015
Accepted:June 15, 2015
Published:July 10, 2015
Copyright:© 2015 Sacilotto et al. This is an open access article distributed under the terms of the Creative Commons Attribution License, which permits unrestricted use, distribution, and reproduction in any medium, provided the original author and source are credited.
Data Availability Statement:Raw data of microarray analysis are accessible in the GEO database (accession number GSE63574).
Introduction
Hepatocellular carcinoma (HCC) is the sixth most common malignancy worldwide and the third major cause of deaths attributable to cancer [1]. The prognosis of HCC patients is usually poor, the size of tumors being a limit to surgical resection and liver transplantation [2] and only patients with small tumors are candidates for resection or local ablation [3]. Moreover, the risk of vascular dissemination increases with tumor size [1]. Therefore, attempts to reduce the size and proliferating activity of liver tumors constitute an attractive strategy prior to resection.
The growth arrest specific (Gas1) gene, which codes for a
glycosylphosphatidylinositol-anchored protein [4], was first described in a search for genes preferentially expressed in growth-arrested cells [5], and its overexpression results in the arrest of the cell cycle before S
phase [6]. The localization of humanGAS1to chromosomal bands 9q21.3-q22, often deleted
in myeloid malignancies, suggested that this gene could be involved in the suppression of tumor cell proliferation [7]
Del Sal et al. [8] first showed that overexpression of humanGAS1arrested the proliferation
of cell lines from lung and bladder carcinoma and similar results were obtained using a variety
of other cell lines [9–12]. Correlations between proliferating activity andGAS1expression were
found in thyroid [13] and gastric [12] tumors, as well as in mesangial cells [14]. Also, the
expression ofGAS1has been included in a test to discriminate between prostate cancer and
benign tumors [15], its level being a prediction marker for metastasis or recurrence in stages II and III of colorectal cancer [16].
The potential role ofGAS1as a tumor suppressor was studied by analyzing tumor progression
after the implantation ofGas1-overexpressing malignant cells in mice. This study reported that the
number and growth rate of the induced tumors in animals overexpressingGas1were significantly
lower than in control animals [10]. Zamorano et al. [17] inoculated a group of athymic mice with C6 glioma cells and another group with retrovirus-producing C6 glioma cells carrying either the
humanGAS1gene under the control of a glial-specific promoter or an unrelated gene. The volume
of tumors was significantly smaller in mice expressingGas1than in those of the other groups.
Sim-ilar results, using a different experimental strategy, were afterwards reported by the same labora-tory [18]. Recent results from the same group show that tGAS1, a truncated, soluble form of the protein, inhibits proliferation and angiogenesis in a triple negative breast cancer model [19].
The mechanisms by whichGAS1gene exerts its antitumor activity remain largely unknown.
It has been suggested that GAS1 mediates hedgehog signaling [20–24], one of the pathways
involved in cancer development and metastasis as well as in the maintenance of the cancer stem cell phenotype (for a review, see [25]). It has also been hypothesized that GAS1 modifies the RET signaling pathway [26], also involved in cell growth and proliferation.
In summary, the current available data suggest that overexpression ofGAS1might represent
a potential antitumor therapeutic approach, although it has never been assessed on primary
tumorsin vivo. In the present paper, we show that thein vivooverexpression ofGas1in livers
reduces the size and proliferating activity of HCC primary tumors as well as the number of
lung metastases in mice. Additionally, microarray analysis showed that transfection withGas1
causes the expression of many liver genes to revert to their non-tumor level. In this regard, the
potential therapeutic use ofGas1may be considered.
Materials and Methods
Materials
The following antibodies were used: rat monoclonal anti-hemagglutinin (HA) (Roche, Basel, Switzerland #11.867.423.001); mouse monoclonal anti-bromodeoxyuridine (BrdU) (Dako,
(Generalitat Valenciana) to L.F. (http://www.cece.gva. es/es/).
Glostrup, Denmark, #M0744); goat anti-mouse GAS1 (R&D Systems, Minneapolis, MN, #AF2644); mouse goat IgG Alexa fluor 555 (Invitrogen, Carlsbad, CA, #21425); goat anti-mouse IgG Alexa Fluor 488 (Invitrogen, #11001); goat anti-anti-mouse IgG Alexa Fluor 594 (Invi-trogen #11005); goat anti-rat IgG Alexa Fluor 488 (Invi(Invi-trogen #11006). The plasmids used in this work were: pCAG-H2BGFP, expression vector coding for the fusion protein H2B-green fluorescent protein (GFP) under the control of CAG promoter (a gift from George Trichas,
University of Oxford); plux.promoter-, containing the luciferase gene, without promoter;
pCMV.lux, expression vector containing the luciferase gene under the control of cytomegalovi-rus (CMV) promoter (this work); pCAG.lux, expression plasmid containing the luciferase gene under the control of CAG promoter (this work); pcDNA3/CMV-HAGas1, expression vector designed to express an HA-N-tagged GAS1 fusion protein under the CMV promoter (this work); pcDNA3/CAG-HAGas1, expression vector designed to express an HA-N-tagged GAS1 fusion protein under the CAG promoter (this work); pIRES/HAGas1, bicistronic expression vector, coding for the fusion protein HA-GAS1 and the GFP, under the CMV promoter (this
work); pcDNA3.1/V5-His-TOPO/lacZ, expression vector coding for theβ-galactosidase, with a
V5 epitope on its N-terminus, and a His tag on the C-terminus (Invitrogen).
Cell culture and transfection methods
The mouse hepatoma cell line Hepa 1–6 (ATCC CRL-1830) was used for thein vitro
experi-ments. Cells were grown at 37°C in a humid atmosphere containing 5% CO2in high glucose
Dulbecco modified Eagle’s medium supplemented with 10% heat-inactivated fetal bovine
serum (Gibco, Invitrogen), 100 U/ml penicillin, 100μg/ml streptomycin and 2.5μg/ml
fungi-zone (Gibco). Cells were transfected with Lipofectamine 2000 reagent (Invitrogen), following
the manufacturer’s instructions.
Animals
Eight to ten week-old CD1 male mice were obtained from the animal facilities of the University
of Valencia, and fedad libitumwith standard diet. All procedures involving live animals were
conducted under isofluorane inhalational anesthesia in a properly equipped surgical theatre, in accordance with the European regulations (Council Directive 86/609/EEC) and were autho-rized by the Ethics Committee for Animal Experimentation of the University of Valencia (approval of procedure for project BFU2007-63120, date 12/03/2007). Hydrodynamic gene
delivery (HGD) was performed as described by Liu et al. [27], using 50μg of plasmid DNA.
Cell sorting and flow cytometry analysis
For cell sorting, suspensions of 3×10⁶cells/ml in growth medium were used. Non transfected
cells were used to define the region of auto-fluorescence, and 106transfected cells were
recov-ered after sorting (MoFlo High Performance Cell Sorter, Dako Cytomation, Glostrup, Den-mark). These cells were analyzed after propidium iodide staining in an Epics XL-MCL
cytometer (Beckman Coulter, Brea, CA, USA). Transfection efficiency of cells with IRES (inter-nal ribosome entry site) bicistronic plasmids was determined by measuring the green fluores-cence emission.
HCC development
Mice were intraperitoneally injected 15 days after birth with 25μg DEN (diethyl nitrosamine)
major lobes of the liver were counted, from both the upper and the visceral sides, and their major axes were measured with a vernier calliper.
In vitro
and
in vivo
luciferase assays
Hepa 1–6 cells transfected with pCMV.lux and pCAG.lux plasmids were assayed for luciferase
activity in a luminometer Revelation 4.28 (Dynex Technologies, Chantilly, VA). Light was measured for 4 s, starting 0.1 s after reagent addition, and the values were expressed as relative light units (R.L.U). Aliquots of the lysates were used to determine protein concentration, and R.L.U were normalized and expressed as R.L.U/mg protein. For bioluminescence live imaging, the method of Nguyen et al. [28] was used, with a Bioluminescence Optical Imager (IVIS 200; Xenogen, Alameda, CA).
Histopathological studies
Samples of livers and lungs were fixed overnight in 10% buffered formalin, embedded in
paraf-fin, sectioned 4μm thick and stained with hematoxilin-eosin. Photographs were taken using an
Olympus DP73 digital camera. Proliferating lesions were classified as hyperplasias and neo-plastic lesions according to current histopathological criteria.
Other microscopic techniques
For immunofluorescence analysis of proliferation, Hepa 1–6 cells were synchronized by serum
starvation and transfected with pcDNA3/CAG-HAGas1plasmid. Five hours after transfection,
fresh FBS-containing medium was added. Fifteen hours later medium was replaced by fresh
medium supplemented with FBS and 10μM BrdU, and cells were incubated at 37°C for 15 min.
After incubation and washing, cells were stained with a mixture of anti-HA and anti-BrdU antibodies by standard methods and analyzed with a fluorescence microscope.
For X-gal staining of tissue samples after HGD, 10μm frozen liver sections were fixed,
air-dried, washed once with PBS and incubated at 37°C with pre-warmed X-gal solution until the blue staining was visible. Cells were counterstained with hematoxylin-eosin.
For immunofluorescence studies in the liver of transfected animals, livers were carefully extracted and left in cold phosphate buffer for 4 to 6 hours after 15 min perfusion with 4%
paraformaldehyde in phosphate buffer (0.1M, pH 7.2). 100μm thick vibratome sections were
incubated with the primary antibody (1: 40) for 48 hours at 4°C and then with the secondary antibody (anti-goat Alexa 555, 1:500). All sections processed for immunofluorescence were counterstained with 4',6-diamidino-2-phenylindole (DAPI) and mounted on slides and cover-slipped using Permafluor mounting medium (Immunon/Shandon, Pittsburgh, PA, USA). Then, the sections were either observed on a Zeiss standard epifluorescence microscope or under a confocal microscope (Leica, Wein, Austria; TCSSPE). Z-series of optical sections
(1μm apart) were obtained using sequential scanning mode. These stacks were processed with
LSM 5 Image Browser software.
Microarray study of gene expression
An Agilent 1 Color‐Gene Expression SurePrint G3 Mouse GE 8x60K Microarray Kit with
Design ID 028005, containing 39,430 Entrez Gene RNAs and 16,251 lincRNA was used.100 ng
of total RNA were labeled using LowInputQuick Amp Labeling kit (Agilent 5190–2305)
follow-ing manufacturer instructions. Briefly, mRNA was reverse transcribed in the presence of
T7-oligo-dT primer to produce cDNA, which was transcribedin vitrowith T7 RNA
the microarray according to the manufacturer's protocol. The arrays were washed, and scanned
on an Agilent G2565CA microarray scanner at 100% PMT and 3μm resolution. Intensity data
was extracted using the Feature Extraction software (Agilent).
Raw data were taken from the Feature Extraction output files and were corrected for back-ground noise using the normexp method [29]. To assure comparability across samples we used quantile normalization [30].
Nucleic acids extraction, semi-quantitative and real time PCR
DNA was extracted from 100–150 mg liver portions in the presence of a protease inhibitor
cocktail and purified after proteinase K digestion with phenol:chloroform.
RNA was extracted and purified from livers and from Hepa 1–6 cells with the Illustra
RNAspin Mini RNA Isolation Kit (GE Healthcare Biosciences, Pittsburgh, PA), according to
the manufacturer’s instructions. Oneμg of total RNA was retrotranscribed to cDNA using
Superscript II RNase H-(Invitrogen), following the manufacturer’s instructions, with random
hexamers to prime the elongation reaction. Negative controls (no enzyme) were also included to check the possible contamination of the samples by genomic DNA. qRT-PCR was carried out in an ABI GeneAmp 7000 Sequence Detection System (Perkin-Elmer, Applied Biosystems, Foster City, CA) and analyzed with the ABI Prism Software (Applied Biosystems). The relative expression values were calculated as described by Pfaffl [31]. The primers used for
semiquanti-tative PCR and qRT-PCR are given in theS1 Table.
Protein extraction and western blot analysis
Fragments of liver (100 to 150 mg) were homogenized in 1ml of ice-cold PBS, supplemented
with 2μl of protease inhibitor cocktail (Roche). Total protein extraction was carried out with
RIPA buffer (50mM Tris-HCl, 150mM NaCl, 1% Nonidet P-40, 0.5% sodium deoxycholate,
0.1% SDS, 2μl/ml protease inhibitor cocktail, pH 8) for 2 h at 4°C. The lysates were centrifuged
at 14,000×gfor 10 min at 4°C, the supernatants containing the soluble proteins were recovered
and total protein was determined with the Bio-Rad protein assay reagent according to the
man-ufacturer’s instructions. Western blots were developed after standard handling with the ECL
advance detection kit (GE Healthcare, UK) according to the manufacturer’s instructions.
Statistical analyses
Quantitative values were expressed as mean ± SD. Data in the different treatments of cells, groups of animals and RT-PCR determinations were compared by two-tailed t-test. In micro-array experiments, statistical analyses and heatmaps were performed using R Bioconductor software (http://www.bioconductor.org/). Differentially expressed genes were identified with the multtest package [32].
Results
Overexpression of
Gas1
arrests proliferation of Hepa1-6 cells
It has long been established thatGas1overexpression arrests cell cycle before S phase in
differ-ent cell lines [6], but its role in hepatoma cells remains unknown. Therefore, we analyzed the
effects ofGas1overexpression in the Hepa 1–6 cell line proliferation.
In order to choose the strongest promoter to induce expression ofGas1in these mammalian
cells, we compared the efficiency of the widely used CAG and CMV promoters by a luciferase
assay. In this assay, using Hepa 1–6 cells routinely transfected with around 45% efficiency (S1A
Fig). Therefore, the former was used for the subsequent overexpression experiments.
Endoge-nous GAS1 protein is not detectable in asynchroEndoge-nously growing Hepa 1–6 cells. However, an
exogenously expressed HA-tagged GAS1 can be detected with both anti-HA and anti-GAS1 antibodies in these cells (S1C Fig), localizing to the cell membrane (Fig 1A).
These results show that the exogenous HA-Gas1can be differentially detected and that it is
correctly incorporated into the cell membrane, like the endogenous counterpart. Further, we
analyzed the effects ofGas1overexpression on cell proliferation. Asynchronously growing
Hepa 1–6 cells transfected with pcDNA3/CAG-HAGas1were unable to uptake BrdU as
deter-mined by double immunostaining against HA and BrdU, suggesting that cells overexpressing
Gas1were unable to progress to the S phase of the cell cycle (Fig 1B).
To further analyze this effect, control and HAGas1-expressing cells were sorted out by
FACS and their cell cycle stage analyzed by propidium iodide staining (Fig 1C and 1D). The
Gas1-overexpressing population was considerably enriched in G0/G1cells, while the number of
cells progressing to the cell cycle was highly reduced. Quantification of these results (Fig 1E)
shows a significant (p<0.001) reduction of S-phase cells in theGas1-overexpressing
popula-tions (from 58.5 to 17.9%), correlating with a significant decreased expression of cyclin E2 (Ccne2) gene, known to be mandatory for cell cycle progression to S phase (Fig 1F and 1G).
These results reinforce the anti-proliferating effects of GAS1 in Hepa 1–6 cells.
Effects of
in vivo
overexpression of
Gas1
on the growth and malignancy
of HCC
Given thatGas1overexpression arrests cell proliferation at the G1/S interface in the Hepa 1–6
hepatoma cell line, we wondered whetherGas1overexpression in liver could also affect
prolif-eration of hepatoma cellsin vivo. Firstly, HCC was induced by treating infant mice with DEN
[33]. This carcinogen produces liver tumors as the only primary lesions, which later metasta-size, mainly by the hematogenous route, to lungs [34]. When HCC was fully developed, mice
were subjected to HGD to transfect liver cells with either aGas1-overexpressing vector or an
empty vector as control.
To determine the efficiency of the transfection by HGD, a construct carrying thelacZ
reporter gene (pcDNA3.1/V5-His-TOPO/lacZ) was delivered in the conditions described
under Materials and Methods and theβ-galactosidase-positive cells visualized after X-gal
stain-ing (S2A Fig). In our hands, the transfection efficiency routinely lay between 30 and 40% and, as expected, most, if not all of the transfected cells, were in the neighborhood of blood vessels. These results are in accordance with published data [35]. We then checked whether the CAG
promoter was also more efficient than the CMV promoterin vivo. Mice were transfected by
HGD with plasmids carrying the luciferase gene under the control of either CMV (pCMV.lux) or CAG promoter (pCAG.lux). Forty eight hours later, live bioluminescent imaging showed
that the CAG promoter is also the most efficient promoterin vivo(S2B Fig). The quantification
of the light emitted in live animals after HGD (S2C Fig) revealed that the CAG promoter drives a luciferase activity more than 12-fold higher than the one induced by the CMV promoter.
The extent of the effects ofGas1 in vivodepends on the persistence of its product.
Conse-quently, mice were transfected with pcDNA3/CAG-HAGas1and transgene, mRNA and
pro-tein levels were analyzed over time. The persistence of the plasmid was checked by PCR after HGD, being high up to 72 h after HGD, but dropping to be almost negligible 14 days after HGD (Fig 2D). The concentration of mRNA follows a similar kinetics (Fig 2E) and protein lev-els are still high 14 days after HGD (Fig 2F).
Fig 1. Transfection of Hepa 1–6 cells with the growth-arrest specific 1 (Gas1) gene.(A) Anti-HA immunofluorescence of Hepa 1–6 cells transfected with pcDNA3/CAG-HAGas1in the absence of detergents to preserve the integrity of membranes. Nuclei were counterstained with DAPI. (B) Double
immunofluorescent staining anti-HA/anti-BrdU of Hepa 1–6 cells transfected with pcDNA3/CAG-HAGas1. (C) Cell cycle analysis of GFP-positive HEPA 1–6 cells after transfection with pIRES/GFP empty vector. 106cells (areas indicated in the upper row) were sorted and subjected to cell cycle analysis after propidium iodide staining (lower row). (D) As (C), after transfection with pIRES/HAGas1. (E) Quantitation of the % of cells in the different stages of the cell cycle from the flow cytometry analysis. Experiments were done in triplicate. (F) Analysis ofCcne2expression in Hepa 1–6 cells overexpressingGas1. A representative RT-PCR showing
Gas1andCcne2expression in cells transfected with either empty pcDNA3/CAG (control) or pcDNA3/ CAG-HAGas1(HAGas1), 15 h after transfection. (G) qRT-PCR to determineCycE2expression in cells as in (F). qRT-PCR was performed in triplicate from three independent experiments. Values were averaged and normalized to 18SrRNA.**, p<0.01.***, p<0.001. In A and B the bar represents 11μm.
On these grounds, animals developing DEN-induced HCC were transfected weekly by HGD
with HA-Gas1to ensure steady levels of protein during the course of the experiment. The
experi-ment was carried out in three groups of animals, 9 mice each. Animals from groups T (after
tumor) and G (afterGas1) received an intraperitoneal injection of DEN 15 days after birth, while
those of the C (after control) group were injected with saline as a DEN-negative, control group. In a previous experiment, we detected that HCC was fully developed in DEN-treated animals between 30 and 35 weeks after birth. For this reason, HGD started in all groups at 28 weeks of
age. Mice from group G were treated weekly with pcDNA3/CAG-HAGas1until week 34
inclu-sive, while groups C and T were treated with the empty plasmid also administered by HGD. Thirty five weeks after birth, all the animals were sacrificed and their livers and lungs removed for analysis. The experiments were repeated twice. Histological studies were carried out in one of the experiments, but the PCR analysis of gene expression was repeated in both of them.
Thede visuanalysis of livers shows that all DEN-treated animals developed a large number
of tumors; nevertheless, their size is reduced in animals overexpressingGas1. The livers of 4
representative animals from groups T and G are shown inFig 3A, together with that of a
DEN-negative, control animal. The quantitative analysis of the data from all the animals is given in Fig 2.In vivotransfection of mice by HGD with pcDNA3/CAG-HAGas1.(A) Immunofluorescence anti-HA on a liver section transfected with pcDNA3/CAG-HAGas1. Nuclei were counterstained with DAPI. (B) Confocal microscopy image of a liver section as that in (A). (C) A magnified confocal microscopy image as in B, to show the deposition of HA-tagged GAS1 into plasma membranes. (D) PCR using primers annealing to the HA tag of theGas1construct at several times after HGD. As an internal control, a region of the constitutive
β-actin gene was also amplified. (E) RT-PCR showing the HA-Gas1expression after HGD. 18SrRNAwas used as loading control. EV, cells transfected with empty vector as control. (F) Western blot against the HA-tag to detect HA-GAS1 after HGD. The intensity of the anti-HA signal, scanned and normalized to the protein load as given by the Ponceau staining, is shown in the row marked“Ratio”.
Fig 3B and 3C. The number of large tumors (>2 mm diameter) is significantly reduced
follow-ing overexpression ofGas1, albeit the total number of lesions did not significantly differ
between mice from groups T and G. In the 9 animals of group T a total of 319 tumors were counted, and 325 were found in those of group G (Fig 3B and 3C).
Histological studies were also carried out in the livers and lungs of all the animals. The analy-sis of livers allowed us to evaluate the grade of proliferating activity and malignancy of the differ-ent tumors. The sequdiffer-ential malignant transformation of hepatic cells after DEN treatmdiffer-ent is
shown, as an example, inS3 Fig. The examination of lungs was of interest because this organ is
one of the main targets of HCC metastases [36] especially in DEN-induced carcinogenesis [34]. Fig 3. Effects ofGas1overexpression on the development of hepatocellular carcinoma.(A)
Representative upper and visceral views of livers from animals of the three groups. (B) Total number of tumors present in the two major lobes of the livers of animals from groups T and G, arranged according to the length of their major axes. (C) Mean number of tumors per animal from groups T and G, arranged as in B. The bars represent the SD.**, p<0.05.*, p<0.1.
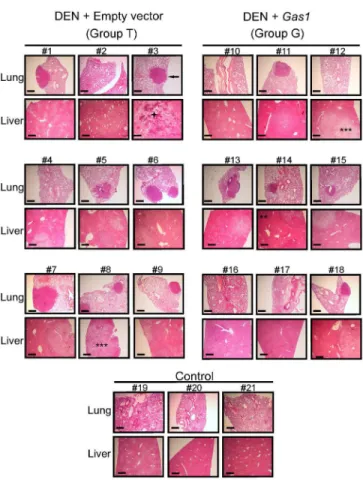
All the phases of malignant transformation, and even extensive necrotic areas were seen in
the livers of the animals from group T (Fig 4). The livers of the animals transfected withGas1,
while developing DEN-induced HCC (group G) showed more normalized areas, although hyperplastic, adenomatous, and some carcinoma areas were still visible. As to the lungs, metas-tases were more frequent in animals from group T than in those from group G. The histological
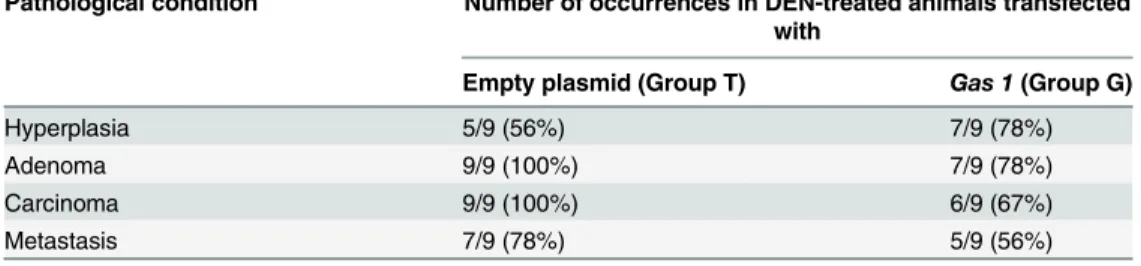
results referred to all the animals are summarized inTable 1, which shows that overexpression
ofGas1after transfection by HGD is compatible with a reduction of the pathological
manifes-tations of the HCC. The size of the sample does not allow an estimation of the significance of these results.
In vivo
transfection of livers with
Gas1
partially restores the levels of
gene expression
To determine the effects on gene expression in tumor-bearing animals afterin vivotransfection
withGas1, a microarray analysis was carried out with RNA from the livers of animals from the
three groups described above. The raw data are accessible in the GEO database (GSE63574). By comparing the data from group C with those of group T, we found that the expression of 698
out of the 20758 genes analyzed was significantly affected (p<0.05) as a consequence of the
DEN treatment. Then, the data from group T were compared with those of group G. In this
Fig 4. Histological analysis of livers and lungs.Representative sections of lungs and livers from all the animals of groups T and G and from 3 animals of group C are shown. As an example, the arrow points to a metastatic nodule in the lung of mouse No. 3. In the livers, examples of hyperplastic (*), adenoma (**), carcinoma (***), and necrotic (+) areas are indicated. The horizontal size bar corresponds to 200μm. All the samples were stained with hematoxylin-eosin.
way, we found that transfection of livers withGas1significantly (p<0.05) affects the expression of 180 out of the above mentioned 698 genes (S4 Fig). Finally, the comparison of the expression level of these 180 genes with that of the same genes in the control animals revealed that the
expression of 150 out of them was similar in groups G and C. These genes are listed inS2
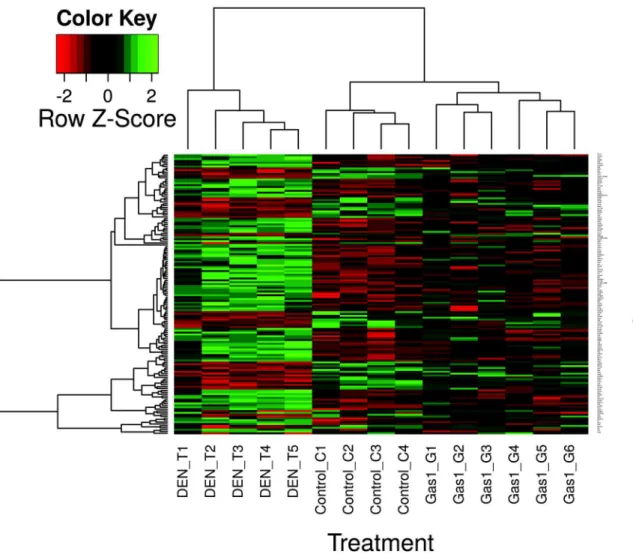
Table. The results of this triangular study were summarized inS5 Fig. The heatmap (Fig 5)
shows that mice treated with DEN and subjected toGas1overexpression have a gene
expres-sion profile comparable to that of control, healthy mice, in contrast with those treated with DEN but transfected with an empty vector. This suggests that the gene expression profile in
HCC-developing mice reverts towards physiological levels afterGas1overexpression.
The results obtained in the microarray analysis were validated by qRT-PCR for some genes of particular interest (Fig 6). These include five genes up-regulated, and two genes
down-regu-lated in tumors. In all the instances, their expression level is restored afterGas1transfection.
The qRT-PCR analysis ofFig 6also includes, as a control, the expression ofArfrp1, one of the
genes unaffected by DEN treatment.
Discussion
In this study we usedin vitroandin vivomurine models to understand the effects ofGas1
over-expression on the development and metastatic potential of HCC. Transfection of Hepa 1–6
cells and live mice with HA-taggedGas1under the control of the CAG promoter resulted in
the proper expression of the gene and in the correct localization of its product to the plasma
membrane (Figs1Aand2). Overexpression ofGas1resulted in the inhibition of the
prolifera-tion of Hepa 1–6 cells, which did not progress to S phase (Fig 1E). Interestingly, theGas1
-induced cell cycle arrest is accompanied by the inhibition ofCcne2transcription (Fig 1G),
although the present results do not allow us to establish a causal relationship between both
phenomena. However, hepatoma cells add to other cell lines in sharing this effect ofGas1
over-expression (see, for instance refs. [6,10,11,37,38].
Most importantly, the present study shows that the antiproliferating effects ofGas1on
hep-atoma cells can be extrapolatedin vivo. DEN-induced HCC in mice was used as a model
sys-tem, and livers were transfected by HGD to overexpress Gas1. The maximum reported efficiency of this procedure is 50% [39], although the normal values rank from 10 to 40% [35]. In our hands, values between 30 and 40% were systematically obtained. Although these values
were obtained with a construct carrying thelacZgene (pcDNA3.1/V5-His-TOPO/lacZ), the
similarity in size of this plasmid with the one used to overexpressGas1
(pcDNA3/CAG-HA-Gas1) allowed us to assume that the transfection efficiency is alike. Despite the fact that roughly
two thirds of the liver cells did not overexpressGas1, a noticeable reduction in the size of
hepa-toma foci was achieved, as shown inFig 4. It has been described that overexpression ofGas1is
able to reduce the tumor volume due to both, inhibition of cell proliferation and induction of Table 1. Summary of the histological studies.
Pathological condition Number of occurrences in DEN-treated animals transfected with
Empty plasmid (Group T) Gas 1(Group G)
Hyperplasia 5/9 (56%) 7/9 (78%)
Adenoma 9/9 (100%) 7/9 (78%)
Carcinoma 9/9 (100%) 6/9 (67%)
Metastasis 7/9 (78%) 5/9 (56%)
apoptosis [11,18,40]. Further studies are needed to clarify whether either or both of these causes contribute to decrease tumor size in liver.
Histological studies facilitate the objective determination of the transformation grade of the liver tumors and, taking into account that lung is a primary target organ for metastatic coloni-zation by HCC cells, the lungs of all the animals were also analyzed for metastatic foci. The
results summarized inTable 1show an excellent agreement with those given in Figs4and5in
that, for instance,Gas1overexpression reduces the number of highly malignant lesions, while
increases the number of just hyperplastic areas.
In addition to thede visuexamination, we also analyzed the global gene expression in the
livers of animals from the three groups described above, namely, control animals (C),
DEN-treated, tumor-bearing mice (T) and tumor-bearing mice after liver transfection withGas1(G).
The results of the microarray analysis revealed that the expression level of 150 genes is restored
afterGas1transfection (Fig 5). The expression changes in seven out of these 150 genes have
been checked by qRT-PCR (Fig 6). Some of them have a special oncologic interest. For
instance,Bmi1codes for a polycomb gene repressor and is overexpressed in human HCC.
Interestingly, knockdown ofBmi1inhibits cancer cell growthin vivo[41], and it has been
Fig 5. Effects of liver transfection withGas1in restoring gene expression in DEN-treated animals.The heatmap shows the expression level of the
genes up- or down-regulated in DEN-induced liver tumors, which reverts towards control levels (p>0.05) after transfection withGas1.
recently proposed that this gene may be a potential target for innovative treatments against
human liver cancer [42]. Of note,Bmi1is clearly overexpressed in DEN-induced liver tumors,
but transfection withGas1restores its expression level. The expression ofCtsedropped to
neg-ligible levels in the liver of DEN-treated animals, an effect that reverts afterGas1transfection.
Interestingly, cathepsin 8 induces growth arrest and apoptosis in tumor cells, but not in normal
cells [43]. A similar effect ofGas1transfection was observed in the expression ofWars1, a gene
whose low expression has been correlated with poor prognostic in colorectal cancer patients [44].
Thirteen out of the 150 genes whose expression level is restored afterGas1transfection,
namelyBmi1,Sulf1,Cd40,Ift122,Wif1,Igf1r,Rbp1,Cul5,Akna,Ick,Cdkn2c,Ift52andSlit2are
related in some way to the hedgehog signaling [45–64]. These genes include some of those
Fig 6. qRT-PCR validation of the expression of some of the genes shown inFig 5.The analyses covered 5 genes up-regulated in tumors, 2 genes down-regulated and a control, unaffected gene. qRT-PCRs were run in triplicate and normalized relative to theβ-actin expression for 4 control, 4 DEN-treated, and 6 DEN-treated plusGas1-transfected animals as depicted in the lower-right inset. The values plotted are the mean±SD of all the data.*, p<0.1.**, p<0.01.***, p<0.001. NS non-significant.
analyzed by qPCR inFig 6(Bmi1,Wif1andIck). As the hedgehog pathway has been implicated in the development of HCC and of colonic cancer stem cells, as well as in the
epithelial-mesen-chymal transition (for reviews, see [65,66]), the present results support the idea that the
tumor-suppressing activity of GAS1 may be mechanistically related to its participation in hedgehog signaling.
Gobeilet al. [67] have reported, after a genome-wide shRNA screening analysis, thatGas1
meets the criteria to be considered a melanoma metastasis suppressor gene. Specifically, a decrease in the expression of the gene increases the metastatic potential of melanoma cells,
while does not affect the primary tumor growth. Our results clearly show thatGas1negatively
affects the progression of HCC, but we do not yet know whether the reduction in the number of lung metastasis is simply a consequence of the action of GAS1 on primary liver tumors or it may also imply a metastasis suppressor role.
As far as we know, no reports have appeared in the literature concerning the changes in the
levels ofGAS1expression in human liver between healthy individuals and patients from HCC
or other liver pathologies. These data will be very valuable to explore the potential of this gene for both prognostic studies and therapeutic protocols. Moreover, further research is required to explore the mechanisms by which this gene plays a tumor suppressor role. However, the present results are interesting and novel because they show for the first time that this role can
be appliedin vivoto a common and highly malignant neoplasia as HCC. Although the tumor
suppressor effects ofGAS1had been previously reported in cell cultures or in xenograft models,
this is the first work in which the suppressor activity of murineGas1is reported for primary
tumorsin vivo. Recent advances in the design of safe vectors for transgene delivery (reviewed
in [68]) may result in extrapolating our results to humans and so a promising field of research emerges in the area of hepatic, neoplastic diseases.
Supporting Information
S1 Fig. Transfection of Hepa 1–6 cells.(A) Flow cytometry analysis of Hepa 1–6 cells after
transfection with pIRES GFP/HA plasmid. On the left, signal from control, non-transfected cells; on the right, GFP fluorescent emission after transfection. (B) Luciferase assay in Hepa
1–6 cells transfected with pCMV.lux and pCAG.lux plasmids. Three independent transfections
were performed in triplicate and the 9 values of relative luciferase units (R.L.U.) were normal-ized to total protein and averaged. Bars mean SD. (C) Western blot to detect the product of using anti-GAS1 and anti-HA antibodies.
(PDF)
S2 Fig. Transfection of livers by HGD.(A) Efficiency of HGD. Mice were subjected to HGD
with either empty vector or with aβ-galactosidase-expressing plasmid. Frozen sections from
the left lateral lobes were subjected to X-Gal staining, counterstained with hematoxylin and analyzed to estimate the transfection efficiency. (B) Bioluminescent live imaging of animals subjected to HGD with vectors expressing the luciferase gene under the control of either the CMV or CAG promoters. As a control, a group of animals was subjected to HGD with an empty vector. (C) Photon emission quantification of the animals shown in (B).
(PDF)
S3 Fig. Progression of a normal liver towards HCC after DEN treatment. Hematoxylin-eosin stained sections of livers from normal and DEN-treated mice are shown. The
magnifica-tion is indicated by the bars: top row, 125μm; middle row, 50μm; bottom row, 12.5μm.
S4 Fig. Effects of liver transfection withGas1on gene expression.The heatmap shows the expression level of the genes up- or downregulated in DEN-induced liver tumors, whose
expression changes significantly (adjusted p<0.05) after transfection withGas1.
(PDF)
S5 Fig. Summary of the triangular study analyzing the results of the microarray experi-ment.The expression level of the 20,758 genes of the microarray in control animals (Group C) was first compared with that of the DEN-treated, tumor-bearing animals (Group T) to find
that the expression of 698 genes had significantly (p<0.05) changed. Then the expression level
of these 698 genes was compared with that found in animals from group G (transfected with
Gas1), and a significant change (p<0.05) in the expression of 180 genes was detected. Finally,
the expression level of these 180 genes was compared with that in control animals to find that
in 150 genes the levels are similar in both groups G and C (p0.05).
(PDF)
S1 Table. Primers used for PCR.
(DOCX)
S2 Table. Genes whose expression is restored in livers of DEN-treated animals afterGas1
overexpression.The 150 genes whose expression is restored after liver transfection withGas1
list shows the comparison of the expression of 150 genes with that of the control animals. (DOCX)
Acknowledgments
We wish to thank Dr Andrés Cervantes (University of Valencia and INCLIVA) for his sugges-tions on the manuscript and to Dr George Trichas (Oxford University) for the gift of plasmid pCAG-H2BGFP.
Author Contributions
Conceived and designed the experiments: GL-R LF JC CL RW-M. Performed the experiments: NS AR-C JC CL MIR LF. Analyzed the data: NS AR-C JC LF GL-R. Contributed reagents/ materials/analysis tools: JMF OH. Wrote the paper: LF NS.
References
1. Forner A, Llovet JM, Bruix J. Hepatocellular carcinoma. Lancet. 2012; 379: 1245–1255. doi:10.1016/ S0140-6736(11)61347-0PMID:22353262
2. Bhoori S, Sposito C, Germini A, Coppa J, Mazzaferro V. The challenges of liver transplantation for hepatocellular carcinoma on cirrhosis. Transpl Int. 2010; 23: 712–722. doi:10.1111/j.1432-2277.2010. 01111.xPMID:20492616
3. Sala M, Llovet JM, Vilana R, Bianchi L, Sole M, Ayuso C, et al. Initial response to percutaneous ablation predicts survival in patients with hepatocellular carcinoma. Hepatology. 2004; 40: 1352–1360. PMID:
15565564
4. Stebel M, Vatta P, Ruaro ME, Del Sal G, Parton RG, Schneider C. The growth suppressing gas1 prod-uct is a GPI-linked protein. FEBS Lett. 2000; 481: 152–158. PMID:10996315
5. Schneider C, King RM, Philipson L. Genes specifically expressed at growth arrest of mammalian cells. Cell. 1988; 54: 787–793. PMID:3409319
6. Del Sal G, Ruaro ME, Philipson L, Schneider C. The growth arrest-specific gene, gas1, is involved in growth suppression. Cell. 1992; 70: 595–607. PMID:1505026
8. Del Sal G, Collavin L, Ruaro ME, Edomi P, Saccone S, Valle GD, et al. Structure, function, and chromo-some mapping of the growth-suppressing human homologue of the murine gas1 gene. Proc Natl Acad Sci U S A. 1994; 91: 1848–1852. PMID:8127893
9. Varner JA, Emerson DA, Juliano RL. Integrin alpha 5 beta 1 expression negatively regulates cell growth: reversal by attachment to fibronectin. Mol Biol Cell. 1995; 6: 725–740. PMID:7579691
10. Evdokiou A, Cowled PA. Growth-regulatory activity of the growth arrest-specific gene, GAS1, in NIH3T3 fibroblasts. Exp Cell Res. 1998; 240: 359–367. PMID:9597009
11. Zamorano A, Lamas M, Vergara P, Naranjo JR, Segovia J. Transcriptionally mediated gene targeting of gas1 to glioma cells elicits growth arrest and apoptosis. J Neurosci Res. 2003; 71: 256–263. PMID:
12503088
12. Wang H, Zhou X, Zhang Y, Zhu H, Zhao L, Fan L, et al. Growth arrest-specific gene 1 is downregulated and inhibits tumor growth in gastric cancer. FEBS J. 2012; 279: 3652–3664. doi:10.1111/j.1742-4658. 2012.08726.xPMID:22846196
13. Lapouge G, Millon R, Muller D, Abecassis J, Eber M, Bergerat JP, et al. Cisplatin-induced genes as potential markers for thyroid cancer. Cell Mol Life Sci. 2005; 62; 53–64. PMID:15619007
14. Van Roeyen CRC, Zok S, Pruessmeyer J, Boor P, Nagayama Y, Fleckenstein S, et al. Growth arrest-specific protein 1 is a novel endogenous inhibitor of glomerular cell activation and proliferation. Kidney Int. 2013; 83: 251–263. doi:10.1038/ki.2012.400PMID:23254899
15. Rizzi F, Belloni L, Crafa P, Lazzaretti M, Remondini D, Ferretti S, et al. A novel gene signature for molecular diagnosis of human prostate cancer by RT-qPCR. PLoS One. 2008; 3(10): e3617. doi:10. 1371/journal.pone.0003617PMID:18974881
16. Jiang Z, Xu Y, Cai S. Down-regulated GAS1 expression correlates with recurrence in stage II and III colorectal cancer. Hum Pathol. 2011; 42: 361–368. doi:10.1016/j.humpath.2010.03.009PMID:
21111449
17. Zamorano A, Mellström B, Vergara P, Naranjo JR, Segovia J. Glial-specific retrovirally mediated gas1 gene expression induces glioma cell apoptosis and inhibits tumor growth in vivo. Neurobiol Dis. 2004; 15: 483–491. PMID:15056455
18. Benítez JA, Arregui L, Vergara P, Segovia J. Targeted-simultaneous expression of Gas1 and p53 using a bicistronic adenoviral vector in gliomas. Cancer Gene Ther. 2007; 14: 836–846. PMID:
17599090
19. Jiménez A, López-Ornelas A, Estudillo E, González-Mariscal L, González RO, Segovia J. A soluble form of GAS1 inhibits tumor growth and angiogenesis in a triple negative breast cancer model. Exp Cell Res. 2014; 327: 307–317. doi:10.1016/j.yexcr.2014.06.016PMID:24992044
20. Lee CS, Buttitta L, Fan CM. Evidence that the WNT-inducible growth arrest-specific gene 1 encodes an antagonist of sonic hedgehog signaling in the somite. Proc Natl Acad Sci U S A. 2001; 98: 11347– 11352. PMID:11572986
21. Izzi L, Lévesque M, Morin S, Laniel D, Wilkes BC, Mille F, et al. Boc and Gas1 each form distinct Shh receptor complexes with Ptch1 and are required for Shh-mediated cell proliferation. Dev Cell. 2011; 20:788–801. doi:10.1016/j.devcel.2011.04.017PMID:21664577
22. Allen B, Song J, Izzi L, Althaus I. Overlapping roles and collective requirement for the coreceptors GAS1, CDO, and BOC in SHH pathway function. Dev Cell. 2011; 20: 775–787. doi:10.1016/j.devcel. 2011.04.018PMID:21664576
23. Sanchez-Arrones L, Cardozo M, Nieto-Lopez F. Bovolenta P. Cdon and Boc: Two transmembrane pro-teins implicated in cell—cell communication. Int J Biochem Cell Biol. 2012; 44: 698–702. doi:10.1016/ j.biocel.2012.01.019PMID:22326621
24. Witt RM, Hecht M-LL, Pazyra-Murphy MF, Cohen SM, Noti C, Van Kuppevelt TH, et al. Heparan sulfate proteoglycans containing a glypican 5 core and 2-O-sulfo-iduronic acid function as Sonic Hedgehog co-receptors to promote proliferation. J Biol Chem. 2013; 288: 26275–26288. doi:10.1074/jbc.M112. 438937PMID:23867465
25. Justilien V, Fields AP. Molecular Pathways: Novel Approaches for Improved Therapeutic Targeting of Hedgehog Signaling in Cancer Stem Cells. Clin Cancer Res. 2015; 21: 505–513. doi: 10.1158/1078-0432.CCR-14-0507PMID:25646180
26. Cabrera JR, Sanchez-Pulido L, Rojas AM, Valencia A, Mañes S, Naranjo JR, et al. Gas1 is related to the glial cell-derived neurotrophic factor family receptorsαand regulates Ret signaling. J Biol Chem. 2006; 281: 14330–14339. PMID:16551639
28. Nguyen AT, Dow AC, Kupiec-Weglinski J, Busuttil RW, Lipshutz GS. Evaluation of Gene Promoters for Liver Expression by Hydrodynamic Gene Transfer. J Surg Res. 2008; 148: 60–66. doi:10.1016/j.jss. 2008.02.016PMID:18570932
29. Ritchie ME, Silver J, Oshlack A, Holmes M, Diyagama D, Holloway A, et al. A comparison of back-ground correction methods for two-colour microarrays. Bioinformatics. 2007; 23: 2700–2707. PMID:
17720982
30. Bolstad B. Probe Level Quantile Normalization of High Density Oligonucleotide Array Data [Internet]. 2001. Available:http://bmbolstad.com/stuff/qnorm.pdf.
31. Pfaffl MW. Relative quantification. In: Dorak T, editor. Real-time PCR. La Jolla: International University Line; 2004. pp. 63–82.
32. Pollard KS, Dudoit S, van der Laan MJ. Multiple Testing Procedures: the multtest Package and Applica-tions to Genomics. In: Gentleman R, Carey VJ, Huber W, Irizarry RA, Dudoit S. editors. Statistics for Biology and Health. Part III. Bioinformatics and Computational Biology Solutions Using R and Biocon-ductor. New York: Springer; 2005. pp. 249–271.
33. Vesselinovitch SD, Mihailovich N. Kinetics of diethylnitrosamine hepatocarcinogenesis in the infant mouse. Cancer Res. 1983; 43: 4253–4259. PMID:6871863
34. Kyriazis A, Koka M, Vesselinovitch S. Metastatic rate of liver tumors induced by diethylnitrosamine in mice. Cancer Res. 1974; 34: 2881–2886. PMID:4424283
35. Chen X, Calvisi DF. Hydrodynamic transfection for generation of novel mouse models for liver cancer research. Am J Pathol. 2014; 184: 912–923. doi:10.1016/j.ajpath.2013.12.002PMID:24480331
36. Valastyan S, Weinberg RA. Tumor metastasis: Molecular insights and evolving paradigms. Cell. 2011; 147: 275–292. doi:10.1016/j.cell.2011.09.024PMID:22000009
37. Grossi M, La Rocca SA, Pierluigi G, Vannucchi S, Ruaro EM, Schneider C, et al. Role of Gas1 down-regulation in mitogenic stimulation of quiescent NIH3T3 cells by v-Src. Oncogene. 1998; 17: 1629– 1638. PMID:9796692
38. Del Sal G, Ruaro EM, Utrera R, Cole CN, Levine AJ, Schneider C. Gas1-induced growth suppression requires a transactivation-independent p53 function. Mol Cell Biol. 1995; 15: 7152–7160. PMID:
8524283
39. Sebestyén MG, Budker VG, Budker T, Subbotin VM, Zhang G, Monahan SD, et al. Mechanism of plas-mid delivery by hydrodynamic tail vein injection. I. Hepatocyte uptake of various molecules. J Gene Med. 2006; 8: 852–873. PMID:16724360
40. Zarco N, González-Ramírez R, González RO, Segovia J. GAS1 induces cell death through an intrinsic apoptotic pathway. Apoptosis. 2012; 17: 627–635. doi:10.1007/s10495-011-0696-8PMID:22311470
41. Xu C-R, Lee S, Ho C, Bommi P, Huang S-A, Cheung ST, et al. Bmi1 functions as an oncogene indepen-dent of Ink4A/Arf repression in hepatic carcinogenesis. Mol Cancer Res. 2009; 7: 1937–1945. doi:10. 1158/1541-7786.MCR-09-0333PMID:19934271
42. Fan L, Xu C, Wang C, Tao J, Ho C, Jiang L, et al. Bmi1 Is Required for Hepatic Progenitor Cell Expan-sion and Liver Tumor Development. PLoS One. 2012; 7(9): e46472. doi:10.1371/journal.pone. 0046472PMID:23029524
43. Kawakubo T, Okamoto K, Iwata JI, Shin M, Okamoto Y, Yasukochi A, et al. Cathepsin E prevents tumor growth and metastasis by catalyzing the proteolytic release of soluble TRAIL from tumor cell sur-face. Cancer Res. 2007; 67: 10869–10878. PMID:18006832
44. Ghanipour A, Jirström K, Pontén F, Glimelius B, Påhlman L, Birgisson H. The prognostic significance of tryptophanyl-tRNA synthetase in colorectal cancer. Cancer Epidemiol Biomarkers Prev. 2009; 18: 2949–2956. doi:10.1158/1055-9965.EPI-09-0456PMID:19900940
45. Gialmanidis IP, Bravou V, Petrou I, Kourea H, Mathioudakis A, Lilis I, et al. Expression of Bmi1, FoxF1, Nanog, andγ-catenin in relation to hedgehog signaling Pathway in Human Non-small-Cell Lung Can-cer. Lung. 2013; 191: 511–521. doi:10.1007/s00408-013-9490-4PMID:23864317
46. Touahri Y, Escalas N, Benazeraf B, Cochard P, Danesin C, Soula C. Sulfatase 1 promotes the motor neuron-to-oligodendrocyte fate switch by activating Shh signaling in Olig2 progenitors of the embryonic ventral spinal cord. J Neurosci. 2012; 32: 18018–18034. doi:10.1523/JNEUROSCI.3553-12.2012
PMID:23238718
47. Genethliou N, Panayiotou E, Panayi H, Orford M, Mean R, Lapathitis G, et al. Spatially distinct functions of PAX6 and NKX2.2 during gliogenesis in the ventral spinal cord. Biochem Biophys Res Commun. 2009; 382: 69–73. doi:10.1016/j.bbrc.2009.02.134PMID:19258013
49. Ocbina PJR, Eggenschwiler JT, Moskowitz I, Anderson KV. Complex interactions between genes con-trolling trafficking in primary cilia. Nat Genet. 2011; 43: 547–553. doi:10.1038/ng.832PMID:21552265
50. Qin J, Lin Y, Norman RX, Ko HW, Eggenschwiler JT. Intraflagellar transport protein 122 antagonizes Sonic Hedgehog signaling and controls ciliary localization of pathway components. Proc Natl Acad Sci U S A. 2011; 108: 1456–1461. doi:10.1073/pnas.1011410108PMID:21209331
51. Ng RC-L, Matsumaru D, Ho a S-H, Garcia-Barceló M-M, Yuan Z-W, Smith D, et al. Dysregulation of Wnt inhibitory factor 1 (Wif1) expression resulted in aberrant Wnt-β-catenin signaling and cell death of the cloaca endoderm, and anorectal malformations. Cell Death Differ. 2014; 21: 978–989. doi:10. 1038/cdd.2014.20PMID:24632949
52. Sanchez-Hernandez D, Sierra J, Ortigao-Farias JR, Guerrero I. The WIF domain of the human and Dro-sophila Wif-1 secreted factors confers specificity for Wnt or Hedgehog. Development. 2012; 139: 3849–3858. PMID:22951645
53. Avanesov A, Honeyager SM, Malicki J, Blair SS. The role of glypicans in Wnt inhibitory factor-1 activity and the structural basis of Wif1’s effects on Wnt and hedgehog signaling. PLoS Genet. 2012; 8(2): e1002503. doi:10.1371/journal.pgen.1002503PMID:22383891
54. Madhala-Levy D, Williams VC, Hughes SM, Reshef R, Halevy O. Cooperation between Shh and IGF-I in promoting myogenic proliferation and differentiation via the MAPK/ERK and PI3K/Akt pathways requires smo activity. J Cell Physiol. 2012; 227: 1455–1464. doi:10.1002/jcp.22861PMID:21618536
55. Fernandez C, Tatard VM, Bertrand N, Dahmane N. Differential modulation of sonic-hedgehog-induced cerebellar granule cell precursor proliferation by the IGF signaling network. Dev Neurosci. 2010; 32: 59–70. doi:10.1159/000274458PMID:20389077
56. Annenkov A. The insulin-like growth factor (IGF) receptor type 1 (IGF1R) as an essential component of the signalling network regulating neurogenesis. Mol Neurobiol. 2009; 40: 195–215. doi:10.1007/ s12035-009-8081-0PMID:19714501
57. Hager-Theodorides AL, Furmanski AL, Ross SE, Outram SV, Rowbotham NJ, Crompton T. The Gli3 transcription factor expressed in the thymus stroma controls thymocyte negative selection via Hedge-hog-dependent and -independent mechanisms. J Immunol. 2009; 183: 3023–3032. doi:10.4049/ jimmunol.0900152PMID:19667090
58. Dentice M, Bandyopadhyay A, Gereben B, Callebaut I, Christoffolete MA, Kim BW, et al. The Hedge-hog-inducible ubiquitin ligase subunit WSB-1 modulates thyroid hormone activation and PTHrP secre-tion in the developing growth plate. Nat Cell Biol. 2005; 7: 698–705. PMID:15965468
59. Chenna V, Hu C, Pramanik D, Aftab BT, Karikari C, Campbell NR, et al. A polymeric nanoparticle encapsulated small-molecule inhibitor of Hedgehog signaling (NanoHHI) bypasses secondary muta-tional resistance to smoothened antagonists. Mol Cancer Ther. 2012; 11: 165–173. doi: 10.1158/1535-7163.MCT-11-0341PMID:22027695
60. Moon H, Song J, Shin J-O, Lee H, Kim H-K, Eggenschwiller JT, et al. Intestinal cell kinase, a protein associated with endocrine-cerebro-osteodysplasia syndrome, is a key regulator of cilia length and Hedgehog signaling. Proc Natl Acad Sci U S A. 2014; 111: 8541–8546. doi:10.1073/pnas. 1323161111PMID:24853502
61. Chaya T, Omori Y, Kuwahara R, Furukawa T. ICK is essential for cell type-specific ciliogenesis and the regulation of ciliary transport. EMBO J. 2014; 33: 1227–1242. doi:10.1002/embj.201488175PMID:
24797473
62. Ayrault O, Zhao H, Zindy F, Qu C, Sherr CJ, Roussel MF. Atoh1 inhibits neuronal differentiation and col-laborates with Gli1 to generate medulloblastoma-initiating cells. Cancer Res. 2010; 70: 5618–5627. doi:10.1158/0008-5472.CAN-09-3740PMID:20516124
63. Liu A, Wang B, Niswander LA. Mouse intraflagellar transport proteins regulate both the activator and repressor functions of Gli transcription factors. Development. 2005; 132: 3103–3111. PMID:15930098
64. Liu J, Wang X, Wang H, Wei G, Yan J. Reconstruction of the gene regulatory network involved in the sonic hedgehog pathway with a potential role in early development of the mouse brain. PLoS Comput Biol. 2014; 10(10):e1003884. doi:10.1371/journal.pcbi.1003884PMID:25299227
65. Omenetti A, Choi S, Michelotti G, Diehl AM. Hedgehog signaling in the liver. J Hepatol. 2011; 54: 366– 373. doi:10.1016/j.jhep.2010.10.003PMID:21093090
66. Oishi N, Yamashita T, Kaneko S. Molecular biology of liver cancer stem cells. Liver Cancer. 2014; 3: 71–84. doi:10.1159/000343863PMID:24944998
67. Gobeil S, Zhu X, Doillon CJ, Green MR. A genome-wide shRNA screen identifies GAS1 as a novel mel-anoma metastasis suppressor gene. Genes Dev. 2008; 22: 2932–2940. doi:10.1101/gad.1714608
PMID:18981472