Abstract—Condition-based Maintenance (CBM) is an
effective maintenance policy to improve the reliability of industry assets. One of the fast growing research topics is about the threshold-type CBM policy. For the criterion of cost, the optimal threshold can determine whether or not the condition-based preventive maintenance action should be performed according to the current condition. For multi-component system, the cost evaluation based on numerical algorithm will suffer time-consuming computations if the number of components increases. For cost evaluation for the proportional hazards model based CBM policy, an algorithm based on Monte Carlo simulation is developed to balance the amount of calculations and the accuracy of the optimal thresholds. A comparative case study is presented to verify the effectiveness of the proposed method for cost evaluation.
Index Terms— condition-based maintenance,
multi-component system, proportional hazards model, Monte Carlo simulation
I. INTRODUCTION
ELIABILITY has always been indispensable in the assessment of industrial products or equipments for the industrial area such as power system, airlines, nuclear stations, steel industries, etc. To improve the reliability of the products or equipment, maintenance or replacement actions are very important. Effective maintenance policy can reduce or avoid the catastrophic failures and high costs. The earliest maintenance policy is corrective maintenance (also called run-to-failure maintenance), and latter maintenance policy is time-based maintenance, which sets a periodic interval to perform preventive maintenance without considering the health condition of a physical asset. With rapid development of the monitoring technology, more efficient approaches such as condition-based maintenance (CBM) are being implemented [1-3]. CBM is a maintenance program that recommends maintenance actions based on the information collected through condition monitoring [1-3]. For CBM, the event data is very important for the reliability analysis as well as the condition monitoring data. So this kind of models [4-7] combining event data and condition monitoring data is beneficial. For example, Jardine et al [4] proposed a Weilbull
Manuscript received January 14, 2014; revised March 5, 2014. Xinbo Qian is with School of Hydropower and Information Engineering, Huzhong University of Science and Technology, Wuhan 430074, China (e-mail: [email protected]).
proportional hazard model (PHM) to analyze the aircraft and marine engine data together with the monitoring data. More details about the proportional hazards model (PHM) can be referred to [8].
The aim of the CBM optimization is to make a decision about when and which to replace or to maintain for the assets. Assets fail when their degradation level reaches a specified failure threshold [9]. So the optimal thresholds should be optimized for various criterions, such as minimizing the cost, maximizing the availability, and etc. Here we take the criterion of minimizing the maintenance cost for example. If the threshold is set too low, more PMs should be performed as a result. On the contrary, the reliability will be reduced if the PM threshold is too high since more failures may happen. For above two extreme conditions, the maintenance cost can be much higher. So there may exit the optimal threshold to make a trade-off betweenthe failures and the PMs to obtain minimal maintenance costs.
Meanwhile, for the last few decades, the maintenance actions for systems have become more and more complex. For the operation of complex system as a multi-component system, it is not any more enough to model the system as a single-component system. Meanwhile, it is not anymore enough to just pay attention to just one single important sub-system without concern for the whole system. Take the generating unit for example, it can be important and cost-efficient to deal with maintenance policy for the whole unit instead of independent subcomponents. One reason is that the systems consist of many components which depend on each other with dependences. For the multi-component system, there may exist three kinds of dependences among the components: stochastic, structure, economic dependences [10]. Interactions between components complicate the modelling and optimization of maintenance. Meanwhile, interactions also offer the opportunity to group maintenance which may save costs. As a result, it follows that maintenance optimization is a big challenge and it is not surprising that many scholars have studied the maintenance optimization problems for multi-component systems [10-12]. In this research, more attentions would be paid to the multi-component system with economic dependence among the components [12]. Economic dependence means that performing maintenance on several subsystems jointly costs less money and/or time than on each subsystem separately [13]. Therefore, there often exist potential cost savings by implementing an opportunistic maintenance policy [11, 14, 15]. Opportunistic maintenance basically refers to the
Control-limit Policy of Condition-based
Maintenance Optimization for Multi-component
System by Means of Monte Carlo Simulation
Xinbo Qian
situation in which preventive maintenance is carried out at opportunities, either by choice or by restriction. For example, it is possible to perform preventive maintenance for non-failed subsystems at a reduced additional cost whereas failed subsystems are being repaired.
The accurate optimal thresholds can be obtained by the numerical algorithms [16-19]. However, for the CBM optimization for multi-component system with economic dependence by the means of the numerical algorithms, one problem is that it may incur intensive computation if the component number increases [16]. Practically, to balance time-consuming computation and the accuracy of the optimal thresholds, some simulation algorithms [20, 21] can be applied. One of the famous simulation methods is Monte Carlo simulation [20, 22]. In this paper, a kind of Monte Carlo simulation based cost evaluation method is applied to make a trade-off between the time-consuming computation and the accuracy of the optimal thresholds for the multi-component system with economic dependences.
The rest of the paper is organized as follows. In Section II, a cost evaluation method is proposed based on Monte Carlo simulation. In Section III, comparative studies are presented between the Monte Carlo simulation and numerical algorithm. Finally, some conclusion remarks are given in Section IV.
II. CONDITION BASED MAINTENANCE OPTIMIZATION BASED ON MONTE CARLO SIMULATION
A. PHM based CBM Policy
The valuable statistical procedure for estimating the risk of equipment failure when it is subjected to condition monitoring is the proportional hazard model (PHM) [2]. The forms of PHM combine the based hazard function h0 along
with a component that takes into account covariates, which are used to improve the prediction of failure. The particular form used in this study is known as a Weibull PHM, which is a PHM with a Weibull baseline, and it is given by
1
0
( , )t t ( )expt t ( t ) exp t
h a z h a z a z (1)
where and ƞ are parameters of the proportional hazards model, at is the age of the component at time t, zt is the covariate value of the component at time t and is the corresponding coefficient of the covariate. The covariates, which can be considered as the key condition monitoring measurements reflecting the health condition of the equipment, can be obtained by the software EXAKT [23]. For the PHM based CBM policy, two-level risk thresholds d1
and d2 are introduced to determine which component should
be performed preventive maintenance (PM) or opportunistic maintenance (OM) at a certain inspection point. The objective of the CBM optimization is to find the optimal d1
and d2 to minimize the total maintenance cost [16].
The CBM optimization approach for the multi-component system based on proportional hazards model, and the method for calculating the cost and reliability objective function, were developed in [16], and it can provide accurate expected maintenance cost. However the algorithm developed in [16] is computationally intensive, particularly when the number of components and the number of covariates become large. In this paper, a cost evaluation method based on Monte Carlo
simulation is proposed to balance the intensive computation and calculation accuracy of the condition based maintenance optimization of multi-component system.
B. Cost Evaluation by Monte Carlo Simulation
The cost model by means of Monte Carlo simulation for the PHM based CBM policy is described as shown in Fig. 1. At a certain inspection point, if a corrective maintenance is performed on a component, then the corrective maintenance cost Cf is incurred. Similarly, if a preventive maintenance (or
opportunistic maintenance) is performed on a component, the preventive maintenance cost Cp is incurred. Whenever
corrective or preventive maintenance is performed, the fixed cost C0 is incurred. If maintenances are performed on
multiple components simultaneously, the fixed cost is incurred only once.
A Monte Carlo simulation method is applied for the cost evaluation of the PHM based CBM policy for the multi-component system. Some of the notations of the PHM based CBM policy are similar to [16]. The system probability matrix Ps is introduced, which indicates the probability distribution of the different component at certain inspection point. Psk,i(a,j) denotes the probability of component i with the state(a, j) at the inspection point k,where a is the age of component i, 0≤k≤Ttal, 1≤i≤N. Ttal is the planning horizon and
one covariate for simplification. The covariate can be divided into several ranges, and the ranges are referred to as the monitoring state of the component, including states 1,2,…,J, where J is the highest possible state. The higher magnitude of covariate corresponds to a worse sub-system monitoring state. The initial values of Ps at initial inspection time is
Ps(0,1)=1, 0=(0,0,…,0), 1=(1,1,…,1) and Psk,i=0 for all the other elements (initial state). This indicates that all the components are in the best state at initial inspection time.
The basic idea of the proposed Monte Carlo based cost evaluation method is that at each inspection point, instead of selecting all the possible states which cause time-consuming calculation, only one possible state of each component is selected for each simulation. The system probability matrix
Ps is updated at each inspection point based on the state transition via the PHM based CBM policy. At the end of the planning horizon, the maintenance cost can be estimated. The average maintenance cost will be estimated again for more simulations until the average cost evaluation can converge. The flow chart of the proposed cost evaluation method is shown in Fig. 2, and detailed explanations are given below.
In the initialization process, the initial value of Ps at initial inspection point is specified as mentioned above. The initial values of the total corrective maintenance cost CEF, the initial
values of the total preventive maintenance cost CEP, and the
total fixed cost CE0, are all set to be zero. When the
initialization process is finished, we will start from initial inspection point to the last inspection point Ttal. For a certain
selected state (as, js) of component i at inspection point k-1,
the state possibility distribution can be updated to be
Psk-1,i(as, js)=1, and Psk-1,i(a, j)=0 for all the other states (a≠as, j≠ js). For each component i, based on state probability matrix
Psk-1,i at inspection point k-1, the state probability matrix of component i at the next inspection point k can be calculated by the transition probability matrix Mi as Psk,i = Psk-1,i Mi. During the selection process, Monte Carlo simulation method is used to reduce the amount of calculation of cost evaluation. Each state (a, j) of componenti has the probability of getting
selected proportional to its state probability value Psk,i(a, j). Here, we select one possible condition state at each inspection point, instead of going through all the possible
transitions, as shown in Fig. 2. To ensure the accuracy of the cost evaluation, the cost evaluation will be calculated for enough simulations until it converges.
For each possible state(a, j) of each component, there will be three possible actions: corrective maintenance, preventive maintenance or no maintenance action. The state transitions for the situation with no maintenance have been proposed above. Then we discuss the state transitions when corrective or preventive maintenance is performed. For certain state(a, j) of component i, the hazard value of component i can be calculated as follows:
1
( , ) ( ) exp ( )
i i
h a j L a z j (2) where z(j) represents the covariate value corresponding to state j. Here it is assumed that there is only one covariate. Let L be the inspection interval. The failure probability for component i during the interval between age (a-1) and a can be calculated as follows:
( , ) ( | ( 1) )
=1- ( | ( 1) )
1 exp( ( , ) ) i
i
F a j P T aL T a L P T aL T a L
h a j L
. (3) State (a, j) of component i can be further divided into two cases according to whether the component is on operation or failed. Each case is represented by ffi, if component i is failed then ffi=0, and ffi=1 for other case. Each case can be
selected by its failure probability Fi(k, j). We go through each component, and update the total maintenance cost values as well as the component age values according to whether corrective maintenance or preventive maintenance is performed. If a corrective maintenance is performed on certain component i, the total corrective maintenance cost value CEF will be updated. If a preventive maintenance is
performed on certain component i, the total preventive maintenance cost value CEP will be updated. If maintenance is
performed on at least one component, the fixed cost CE0 will
be updated. After the corrective or preventive maintenance is performed on component i, the state (a, j) will be updated to state (0, 1) as good as new. If no maintenance is performed on component i, the state (a, j) can be updated by the transition probability matrix. When the inspection point reaches Ttal, the
total maintenance cost per unit time for each simulation can be calculated by the following formula if thresholds d1 and d2
are determined:
1 2 EF EP E0 tal
( , ) /
s
c d d C C C T (4)
where Ttal is referred to be the largest inspection time point.
The total cost includes correct maintenance cost, preventive maintenance cost, OM cost and fixed cost. The estimated average maintenance cost per unit time after SN simulations can be calculated by the following formula:
1 2 1 s 1 2
( , )= SN ( , )
SN s s
C d d
p c d d (5) where ps is referred to be the possibility of each simulation and is equal to 1/SN. CSN( , )d d1 2 can be obtained if it satisfies the convergence criterion by
CSN-CSN1
CSN < (6) where ε is the stopping criterion. If the average maintenance cost per unit time CSN( , )d d1 2 converges, then the expected maintenance cost per unit can be estimated by1 2 1 2
( , ) ( , )
Quantitively, at certain inspection point k, instead of going through about (2kJ)N possible states, we only go through (Nnsim) states, where nsim is the simulation times, N is the
number of components and J is the number of states. It can be concluded that the amount of calculations of cost evaluation has been efficiently decreased. For example, as shown in Fig. 2 the black blocks are referred to as the selected states at each inspection point whereas all the blocks stand for all the possible states with different ages and different covariate states. So the proposed method can efficiently reduce the amount of calculation of cost evaluation, especially when the number of components becomes large. To verify the effectiveness of the proposed method for cost evaluation, a comparison study is given in next section.
III. COMPARATIVE STUDY
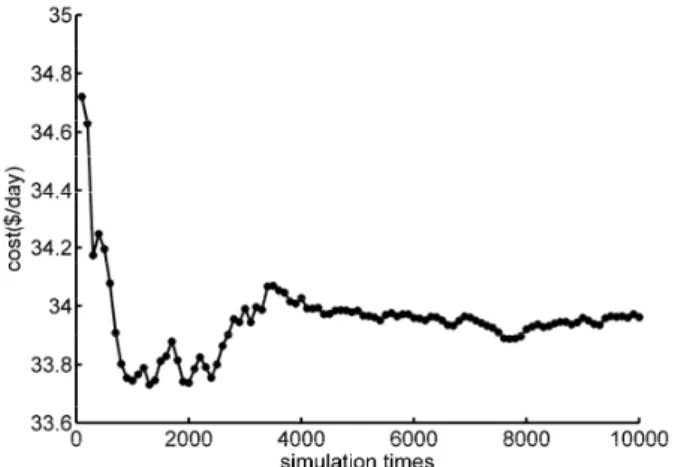
In this section, to verify the Monte Carlo simulation method for cost evaluation, comparison of simulation results are made between the proposed method and the method presented by [16]. To make them comparable, same objective function and same case from [16] are used. By the proposed simulation method for cost evaluation, the expected maintenance cost per unit time versus simulation times can be obtained when fixed risk threshold values and cost ratio λ are determined, as shown in Fig. 3 and Fig. 4. We can see that the expected cost per unit time converges when the total simulation times reach 5000.
For the proposed method for cost evaluation, if the thresholds are given and the number of simulation times is
5000, then total number of selected states is about 5 tal sim=48 2 5000 4.8 10
N T n .
Meanwhile the computing time of the proposed method for cost evaluation is about 50 seconds. If all the possible states are selected to be calculated as proposed by [16], the number of total states is about
tal 48 6
0 2+2 0 2+2 3.8 10
T N N
k kJ k kJ
,and the computation time is about 380 seconds. It can be seen that the computation time for cost evaluation can be significantly quickly decreased by the Monte Carlo method compared to the latter algorithm.
The corrective maintenance cost, preventive maintenance cost, and fixed maintenance cost are $16300, $1800, $3000, respectively. To verify the accuracy of the proposed method, with respect to different ratios between fixed replacement cost and total fixed and variable replacement costs, the optimal cost values and the optimal CBM thresholds derived from the Monte Carlo simulation and the method proposed by [16], are (d1, d2, cost) and (d10, d20, cost0), respectively, as
listed in Table 1. For this control-limit policy for condition based maintenance optimization, it is important to obtain the optimal thresholds. So the method is acceptable as long as the accuracy of the optimal thresholds of the Monte Carlo simulation can be maintained.
We set the difference of the optimal thresholds between the two methods ln(d1)= |ln(d1) -ln(d10)| and ln(d2)=
|ln(d2)-ln(d20)|. In the case study, the accuracy of the
condition monitoring value z1A is set to be ρ=0.1, and the
difference of optimal thresholds of the two methods can be acceptable if
1A 1 1A 10 1A 2 1A 20
| ( )z d z ( )|d , | ( )z d z ( )|d (8) Meanwhile ln(d1), ln(d2) should meet the following
constraints:
1 2
ln( )d 0.514, ln( )d 0.514
(9)
which is derived from (8). From Table I, it can be seen that for various fixed cost ratios all ln(d1) and ln(d2) can meet
the constraints of (9). Therefore the difference between the optimal thresholds of two different cost estimation methods is acceptable. So it can be concluded that in this case, the cost evaluation based on the Monte Carlo simulation method can significantly reduce the intensive computation while the accuracy of the optimal thresholds can be maintained.
Fig. 4. The average maintenance cost versus simulation times if level-1 threshold d1 is 10.0, level-2 threshold d2 is 0.50, and cost
ratio λ is 0.75.
IV. CONCLUSION
The cost evaluation for PHM based CBM policy becomes more complex when the number of components becomes large and the types of the components are different. As a result, a simulation method is developed for the proposed policy to efficiently reduce the computation. In this research, we have developed a Monte Carlo simulation based cost-evaluation method for CBM optimization. From a comparative case study, it shows that Monte Carlo simulation based cost-evaluation method can efficiently balance calculations of cost evaluation and the accuracy of the optimal risk thresholds. Future research topics will be to develop CBM policies to adapt the multi-component system with stochastic economy dependence and time-varying information.
REFERENCES
[1] Martin, K.F., “A review by discussion of condition monitoring and fault-diagnosis in machine-tools,” International Journal of Machine
Tools and Manufacture, vol. 34, no. 4, May 1994.
[2] Jardine, A.K.S., D.M. Lin, and D. Banjevic, “A review on machinery diagnostics and prognostics implementing condition-based maintenance,” Mechanical Systems and Signal Processing, vol. 20, no. 7, pp. 1483-1510, Oct. 2006.
[3] Ghasemi, A., S. Esmaeili, and S. Yacout, “Development of equipment failure prognostics model based on Logical Analysis of Data (LAD),”
Engineering Letters, vol. 21, no. 4, pp. 256-263, Nov. 2013.
[4] Jardine, A., P. Anderson, and D. Mann, “Application of the Weibull proportional hazards model to aircraft and marine engine failure data,” Quality and reliability engineering international, vol. 3, no. 2, pp. 77-82. 1987.
[5] Vlok, P.J., M. Wnek, and M. Zygmunt, “Utilising statistical residual life estimates of bearings to quantify the influence of preventive maintenance actions,” Mechanical systems and signal processing, vol. 18, no. 4, pp. 833-847, Jul. 2004.
[6] Rabiner, L.R., “A tutorial on hidden Markov models and selected applications in speech recognition,” Proceedings of the IEEE, vol. 77, no. 2, pp. 257-286. 1989.
[7] Elliott, R.J., Hidden Markov models: estimation and control. New York: Springer-Verlag, 1995, chr. 1.
[8] Kumar, D. and B. Klefsj “Proportional hazards model: a review,” Reliability Engineering & System Safety, vol. 44, no. 2, pp. 177-188. 1994.
[9] Yang, K. and G. Yang, “Degradation Reliability Assessment Using Severe Critical Values,” International Journal of Reliability, Quality
and Safety Engineering, vol. 5, no. 1, pp. 85-95. 1998.
[10] Nicolai, R.P. and R. Dekker, “Optimal maintenance of multi-component systems: a review,” in Complex System Maintenance
Handbook, London: Springer, 2008, pp. 263-286.
[11] Cho, D. and M. Parlar, “A survey of maintenance models for multi-unit systems,” European Journal of Operational Research, vol. 51, no. 1, pp. 1-23, Mar. 1991.
[12] Dekker, R., R.E. Wildeman, and F.A. van der Duyn Schouten, “A review of multi-component maintenance models with economic dependence,” Mathematical Methods of Operations Research, vol. 45, no. 3, pp. 411-435, Oct. 1997.
[13] Wang, H., “A survey of maintenance policies of deteriorating systems,” European Journal of Operational Research, vol. 139, no. 3, pp. 469-489, Jun. 2002.
[14] Berg, M. and B. Epstein, “Comparison of age, block, and failure replacement policies,” Reliability, IEEE Transactions on, vol. 27, no. 1, pp. 25-29, Apr. 1978.
[15] Zheng, X. and N. Fard, “A maintenance policy for repairable systems based on opportunistic failure-rate tolerance,” Reliability, IEEE
Transactions on, vol. 40, no. 2, pp. 237-244, Apr. 1991.
[16] Tian, Z. and H. Liao, “Condition based maintenance optimization for multi-component systems using proportional hazards model,” Reliability Engineering & System Safety, vol. 96, no. 5, pp. 581-589, May 2011.
[17] Banjevic, D. and A. Jardine, “Calculation of reliability function and remaining useful life for a Markov failure time process,” IMA Journal
of Management Mathematics, vol. 17, no. 2, pp. 115, Apr. 2006.
[18] Welte, T.M., J. Vatn, and J. Heggest. “Markov state model for optimization of maintenance and renewal of hydro power components,” Probabilistic Methods Applied to Power Systems, 2006.
PMAPS 2006. International Conference on, pp.1, 7, 11-15, Jun. 2006.
[19] Banjevic, D., A.K.S.J.V. Makis, and M. Ennis, “A control-limit policy and software for condition-based maintenance optimization,” INFOR, vol. 39, no. 1, pp. 32, Feb. 2001.
[20] Marseguerra, M., E. Zio, and L. Podofillini, “Condition-based maintenance optimization by means of genetic algorithms and Monte Carlo simulation,” Reliability Engineering & System Safety, vol. 77, no. 2, pp. 151-165, Aug. 2002.
[21] J. Barata, C. Guedes Soares, M. Marseguerra, E. Zio, “Simulation modelling of repairable multi-component deteriorating systems for ‘on condition’ maintenance optimisation,” Reliability Engineering & System Safety,. vol. 76, no. 3, pp. 255-264, Jun. 2002.
[22] Jalao, E.R.L., D.L. Shunk, and T. Wu, “Life cycle costs and the analytic network process for software-as-a-Service migration,” IAENG
International Journal of Computer Science, vol. 39, no. 3, pp. 269-275,
Sep. 2012.
[23] Jardine A K S, Banjevic D, Wiseman D W, Buck S, Joseph T, “Optimizing a mine haul truck wheel motors’ condition monitoring program Use of proportional hazards modeling,” Journal of Quality in
Maintenance Engineering, vol. 7, no. 4, pp. 286-301, 2001.
TABLE I
THE COMPARISON OF THE RESULTS OF TWO COST EVALUATION METHODS Ratio λ Threshold
d1 a
Threshold
d2a Cost
a Threshold
d10b
Threshold
d20b Cost0
b ln(d
1) ln(d2)
0.0 12.18 7.39 39.97 11.8 11.8 39.92 0.33 0.47
0.1 12.18 12.18 39.66 11.5 8.1 39.83 0.06 0.41
0.2 12.18 7.39 39.33 11.5 5.8 39.37 0.06 0.24
0.3 12.18 2.72 38.32 11.5 3.5 38.74 0.06 0.25
0.4 12.18 1.00 38.31 11.5 1.2 38.04 0.06 0.18
0.5 7.39 1.65 36.85 10.0 1.0 37.07 0.30 0.50
0.6 8.17 0.61 35.38 10.0 0.5 36.00 0.20 0.19
0.7 7.39 0.37 33.89 10.0 0.5 34.67 0.30 0.31
0.8 7.39 0.37 32.65 10.0 0.5 33.30 0.30 0.31
0.9 4.48 0.08 31.18 5.0 0.05 31.60 0.11 0.50
1.0 4.48 0.00 29.26 5.0 0.0 29.20 0.11 0.00
0.75 8.17 0.45 33.97 10.0 0.5 35.69 0.20 0.11