Monte Carlo simulation of inherited longevity
Paulo M.C. de Oliveira
1, Suzana Moss de Oliveira,
Americo T. Bernardes
2, Dietrich Stauer
∗Laboratoire PMMH, ESPCI, 10 rue Vauquelin, F-75231 Paris Cedex 05, France
Received 10 August 1998
Abstract
Within the Penna model of biological ageing, we show that longevity is heritable, for both sexual and asexual reproduction. c 1999 Elsevier Science B.V. All rights reserved.
PACS: 05.40; 87.10
Keywords:Ageing; Penna model; Mutation
1. Method
It is well known that longevity in humans is partly inherited: If the parents lived very long, then their children have a higher chance to live long. More quantitatively, Perls et al. [1] showed that brothers and sisters of centenarians have a four times higher survival chance at old age than the siblings of people who died at a normal age of 73 years. The present paper aims to check this by Monte Carlo simulations of a suitable model, rst for asexual and then for sexual reproduction.
The most widely studied microscopic model of ageing is at present the Penna bit-string model [2]. It has succeeded in explaining for instance, why the salmon dies soon after reproduction, the positive female survival probability after menopause, and is in agreement with the Gompertz law and the Azbel theory of mortality (for a review, see e.g. [3,7,8]). The human genome is here reduced to the 32 bits of one computer
∗Corresponding author. Permanent address: Institute for Theoretical Physics, Cologne University, 50923
Koln, Germany. E-mail: [email protected].
1Instituto de F sica, Universidade Federal Fluminense, Av.Litorˆanea s=n Boa Viagem, 24210-340 Niteroi RJ,
Brazil.
2Departamento de F sica, Universidade Federal de Ouro Preto, Ouro Preto, 35400-000 Ouro Preto MG,
Brazil.
P.M.C. de Oliveira et al. / Physica A 262 (1999) 242–248 243
word, where each bit represents a life-threatening inherited disease. The lifespan is divided into 32 intervals each corresponding to one bit position; for humans therefore one interval consists of 4–7 years, depending on the parameters chosen. A zero bit means health; a bit set to one means that starting from that age interval until death
one additional disease is diminishing the health. T such diseases, i.e. T bits set to
one in the bitstring from age zero to the current age, kill the individual. People who
survive up to the reproductive age R get from then on B children per time interval.
Each child diers in M randomly selected bit positions from the parent; if a position
is selected which has already its bit set to one, then the bit is set back to zero. Besides these genetic deaths, our simulations also allow for deaths because of the lack of food and space through a Verhulst factor; but such deaths are ignored in all the statistics of the present paper.
The computer program thus does not have to wait until an individual dies. Already at birth the time of death is programmed in the genome. Thus when a baby is born, the histogram element H(i; k) of the correlation matrixH is increased by unity, where iis
the genetic age of death for the parent and k that for the newly born child. Complete
correlation would mean that the matrix H(i; k) is diagonal while complete statistical independence for the ages of death would mean that the matrix elements have the same shape as a function of k, independent of the line i of the matrix.
The above description refers to asexual reproduction. For sexual reproduction the child gets a random section of genes from the mother and the others from the father (see [3,4,7–9] for a more precise description of the now diploid genome and its re-combination). The histogram H(i; j; k) has now three indices, for the death ages i; j; k
of father, mother and child. Six of the 32 bit positions are randomly selected (same for the whole population) as indicating dominant diseases aecting the child already when one of the parents has the disease. For the other (recessive) positions the health of the child is diminished only when both parents carry this mutation.
2. Results
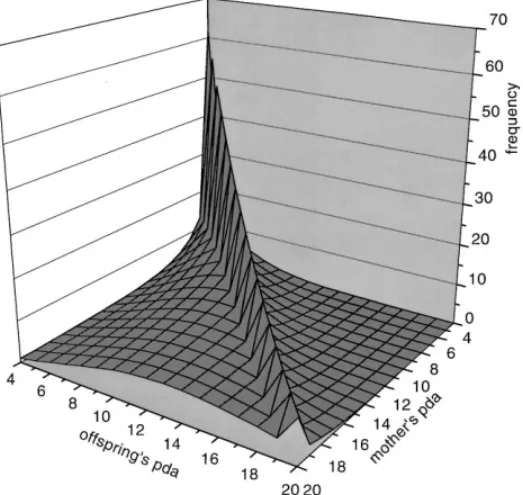
For asexual reproduction, the histogram in Fig. 1 shows clearly the correlations
between the age of death of parents and children: The numbers H(i; i) in the main
diagonal are clearly bigger than away from it. Thus long-lived parents get long-lived children. In observations of human populations, such studies would take much longer than the funding periods of typical grants, and thus Perls et al. [1] instead observed correlations between the age of death of brothers and sisters within the same family.
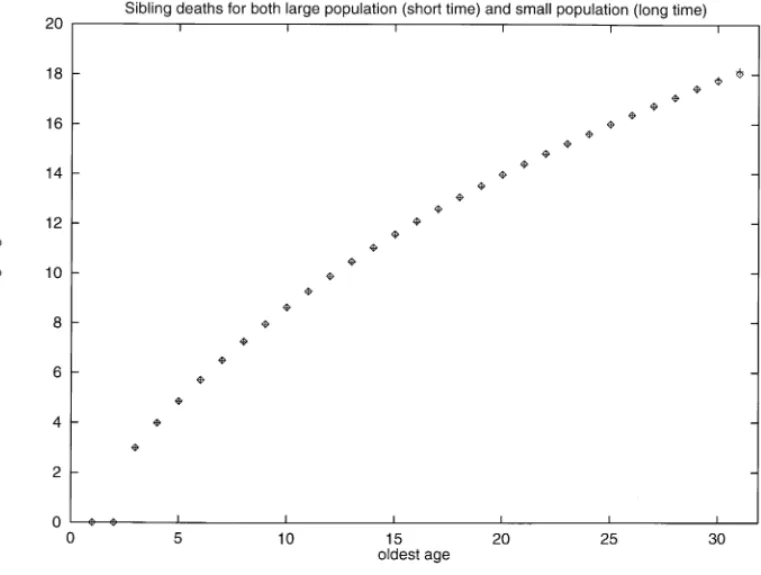
Fig. 2 shows from the same simulations used for Fig. 1 a very clear correlation
Fig. 1. Histogram (in percent) of child’s programmed death age (pda) versus parental death age. For a given genetic death age for the mother we plot the distribution of the ages of genetic death for the ospring. The sharp ridge in the diagonal shows that children die mostly at the same age as their parent, in this asexual model. Note that the horizontal axes do not start at zero. Since we allowed back mutations from one to zero for the bit-string, some children can live longer than their parents.
P.M.C. de Oliveira et al. / Physica A 262 (1999) 242–248 245
Fig. 3. Average death age of children versus death age of the oldest child in the family. Instead of the full histogram as in Figs. 1 and 2 we show here only the average.
as that in a preliminary publication of the authors [Lancet 352 (1998) 911], where much more iterations and a smaller population were used.
(As parameters for these gures we took T =R= 3; M= 4; B= 1. Then at age 13
about 99.8% of the population died, which correponds to an age of about 100 years for
the present German population. The mutation rate M= 4 was taken unusually [2,3,7,8]
large to avoid that nearly all brothers and sisters die at the same age. The minimum
reproduction age R= 3 was taken unusually low to correspond to human marriage
customs.)
We varied the population between 32 and 5×10⁷, and the number of iterations
between 150 and 2000 million, without clear changes seen in the histograms for ages up to 15 intervals. However, the survival probabilities for ages beyond 10 depended strongly on the size of the population as seen in Fig. 4; data with the same population size but dierent numbers of iterations roughly overlap. These straight lines corre-spond to the simple Gompertz law of an overall mortality increasing exponentially with age, while the less steep increase of the mortality for the oldest old may corre-spond to human reality [5,10–14]. For the parameters used in Refs. [2–4] with higher
Fig. 4. Mortality versus age, with initial population increasing from 12 (left) to 20 million (right) as given in the top line of the gure. The time varies between 150 (right) and 2000 million (left) iterations. The many curves show that by decreasing the population the end of the plateau is shifted to the left, by an amount logarithmic in the population size. This size eect vanishes and a plateau is reached already for averages over many small populations, if we rst average over the populations and then determine the joint survival rates. In this paper, however, we rst determine the survival rates and then average over time.
mortality is q(a) = ln[S(a)=S(a+ 1)] as a function of agea, whereS is the number of survivors.)
For sexual reproduction, we have to correlate the death ages of father (i), mother
(j) and child (k). In particular, we want to know if the distribution of the age of
P.M.C. de Oliveira et al. / Physica A 262 (1999) 242–248 247
3. Summary
In conclusion, the Penna model of mutation accumulation agrees nicely with the observed heredity of longevity [1], because it is based on population genetics. This success does not exclude, however, alternative theories of ageing [6] like oxygen rad-icals; for example the sensitivity to these radicals damaging the DNA could also be inherited.
Acknowledgements
We thank P. AlstrHm for suggesting this work, and Fapemig, CAPES and CNPq of
Brazil for support.
References
[1] T.T. Perls, E. Bubrick, C.G. Wager, J. Vijg, L. Kruglyak, Lancet 351 (1998) 1560. [2] T.J.P.P. Penna, J. Stat. Phys. 78 (1995) 1629.
[3] S. Moss de Oliveira, Physica A 257 (1998) 465.
[4] D. Stauer, P.M.C. de Oliveira, S. Moss de Oliveira, R.M. Zorzenon dos Santos, Physica A 231 (1996) 504.
[5] J.W. Vaupel et al., Science 280 (1998) 855.
[6] K.W. Wachter, C.E. Finch, Between Zeus and the Salmon, The Biodemography of Longevity, National Academy Press, Washington, DC, 1997.
[7] A.T. Bernardes, in: D. Stauer (Ed.), Annual Reviews of Computational Physics, p. 359, vol. IV, World Scientic, Singapore, 1996.
[8] S. Moss de Oliveira, P.M.C. de Oliveira, D. Stauer, Nontraditional Applications of Computational Statistical Physics, to be published.
[9] S. Moss de Oliveira, P.M.C. de Oliveira, D. Stauer, Braz. J. Phys. 26 (1996) 626. [10] M.Ya. Azbel, Proc. Roy. Soc. London B 263 (1996) 1449.
[11] M.Ya. Azbel, Phys. Rep. 288 (1997) 545. [12] M.Ya. Azbel, Physica A 249 (1998) 472.
[13] L.D. Mueller, M.R. Rose, Proc. Natl. Acad. Sci. USA 93 (1996) 15 249 S.D. Pletcher, J.W. Curtsinger, Evolution 52 (1998) 454.