Design and Performance of a New Severity
Score for Intermediate Care
Félix Alegre1☯
*, Manuel Fortún Landecho1,2, Ana Huerta1, Nerea Fernández-Ros1,
Diego Martínez-Urbistondo1, Nicolás García1, Jorge Quiroga1,2,3, Juan Felipe Lucena1☯
1Division of Intermediate Care and Hospitalists Unit, Department of Internal Medicine, Clínica Universidad de Navarra, Pamplona, Navarra, Spain,2Instituto de Investigación Sanitaria de Navarra (IdiSNA), Pamplona, Navarra, Spain,3Centro de Investigación Biomédica en Red de Enfermedades Hepáticas y Digestivas (CIBEREHD), Madrid, Spain
☯These authors contributed equally to this work. *[email protected]
Abstract
Background
Application of illness-severity scores in Intermediate Care Units (ImCU) shows conflicting results. The aim of the study is to design a severity-of-illness score for patients admitted to an ImCU.
Methods
We performed a retrospective observational study in a single academic medical centre in Pamplona, Spain. Demographics, past medical history, reasons for admission, physiologi-cal parameters at admission and during the first 24 hours of ImCU stay, laboratory variables and survival to hospital discharge were recorded. Logistic regression analysis was per-formed to identify variables for mortality prediction.
Results
A total of 743 patients were included. The final multivariable model (derivation cohort = 554 patients) contained only 9 variables obtained at admission to the ImCU: previous length of stay 7 days (6 points), health-care related infection (11), metastatic cancer (9), immunosup-pressive therapy (6), Glasgow comma scale 12 (10), need of non-invasive ventilation (14), platelets 50000/mcL (9), urea 0.6 g/L (10) and bilirubin 4 mg/dL (9). The ImCU severity score (ImCUSS) is generated by summing the individual point values, and the formula for determining the expected in-hospital mortality risk is:eImCUSS points*0.099–4,111/ (1 + eImCUSS
points*0.099–4,111). The model showed adequate calibration and discrimination. Performance of ImCUSS (validation cohort = 189 patients) was comparable to that of SAPS II and 3. Hos-mer-Lemeshow goodness-of-fit C test wasχ28.078 (p=0.326) and the area under receiver operating curve 0.802.
OPEN ACCESS
Citation:Alegre F, Landecho MF, Huerta A, Fernández-Ros N, Martínez-Urbistondo D, García N, et al. (2015) Design and Performance of a New Severity Score for Intermediate Care. PLoS ONE 10(6): e0130989. doi:10.1371/journal.pone.0130989
Editor:Lyle L Moldawer, University of Florida College of Medicine, UNITED STATES
Received:January 30, 2015
Accepted:May 26, 2015
Published:June 29, 2015
Copyright:© 2015 Alegre et al. This is an open access article distributed under the terms of the
Creative Commons Attribution License, which permits unrestricted use, distribution, and reproduction in any medium, provided the original author and source are credited.
Data Availability Statement:All relevant data are within the paper.
Funding:These authors have no support or funding to report.
Conclusions
ImCUSS, specially designed for intermediate care, is based on easy to obtain variables at admission to ImCU. Additionally, it shows a notable performance in terms of calibration and mortality discrimination.
Introduction
Worldwide health care institutions try to give care based on best-practice models with cost-effectiveness. However, hospitalized patients are becoming complex and many of them exceed monitoring and nursing care available in conventional hospitalization wards. In this scenario, intermediate care units (ImCU) may provide a rational and proportional treatment between the intensive care units and the general ward [1–11].
The characteristics of ImCUs depend on resource availability, institutional infrastructure and the parent health care system. They can function as step-up or step-down units, or provide specialty care for cardiac, neurologic, respiratory or surgical conditions. Multipurpose ImCUs need characterization of the admitted patients in order to assess their illness severity and prog-nosis. Multiple severity scores have been designed and widely described in patients admitted to intensive care units (ICU) [12–21], but information in the setting of ImCU is scarce [1,5,8– 9,11]. Moreover, the performance of the Simplified Acute Physiology Score II (SAPS II) [13] and the Simplified Acute Physiology Score 3 (SAPS 3) [14] showed conflicting results in inter-mediate care [5]. In addition, the collection of data for the calculation of these illness severity scores is time consuming.
The purpose of the present study is to design, based on simple variables, a new severity-of-illness scoring system for intermediate care, and to assess its performance in a single centre ImCU.
Patients and Methods
In order to develop the ImCU Severity Score (ImCUSS) we performed a retrospective observa-tional study, with data collected from April 2006 to December 2013 in a single academic medi-cal centre in Pamplona, Spain. The ImCU is a 9-bed unit adjacent to, but independent from, the mixed ICU. Each bed is equipped with a continuous telemetry, pulse oximetry, non-inva-sive arterial blood pressure, central venous pressure monitoring, and non-invanon-inva-sive pressure support ventilation. The signals are relayed to a central monitoring station and the nurse: patient ratio is 1:3. The ImCU infrastructure (beds, technical resources and nursing staff) is shared with the Stroke Unit and the Coronary Care Unit. The ImCU rounding team involves a nurse, the hospital pharmacist, the ImCU resident, the specialist or surgeon and the attending hospitalist. The hospitalist is responsible for admission and discharge of all ImCU patients. Admission and discharge criteria were set according to previous guidelines defined by The American College of Critical Care Medicine [22]. Exclusion criteria included age less than 18 years old, severe respiratory failure at imminent risk of requiring intubation, status epilepticus, and catastrophic brain illness.
hours of ImCU stay, laboratory variables, location at discharge and survival to hospital discharge were recorded. SAPS II and SAPS 3 were also calculated according to standard coefficients.
Statistical analysis was performed using SPSS for Windows, version 20.0 (SPSS Inc, Chicago; IL). Continuous variables were reported as mean ± standard deviation or median (25%-75% interquartile range).
Logistic regression was used to develop an in-hospital mortality prediction model for patients admitted to our ImCU. Variables to be included in the multivariable model were deter-mined by using univariable logistic regression (p value in the univariable model0.20). The maximum likelihood method was applied to estimate model coefficients, and these were then used to develop our new severity score. We assigned integer point values to each predictor vari-able from the multivarivari-able logistic regression model (the coefficients of these varivari-ables were transformed by multiplying them by 10 and rounding to the nearest integer), thus generating the ImCUSS. The expected mortality rates were calculated using the ImCUSS as the only vari-able in another logistic regression model.
The ImCUSS was derived using a random sample of 75% subjects from the cohort, and then validated in the remaining 25%. For both instances, the calibration and discrimination perfor-mances were evaluated with the Hosmer-Lemeshow goodness-of-fit (GOF) C test and the area under the receiver operator curve (AUROC), respectively.
Ethics statement
The study protocol was approved by the Institutional Review Board (IRB) at the Clínica Uni-versidad de Navarra (ref. 129/2010). The IRB waived the need for informed consent, because it is an observational non-interventional study, and also because it did not interfere with deci-sions related to patient’s care. The study has been performed in accordance with the ethical standards laid down in the 1964 Declaration of Helsinki and its later amendments. Patient information was anonymized and de-identified prior to analysis.
Results
During the study period, 1112 patients were admitted to the ImCU. Of these, 369 were excluded: 70 low-risk patients (drug administration and desensitization), 200 readmissions, and 99 patients for missing variables. Therefore, 743 patients were included in data analysis.
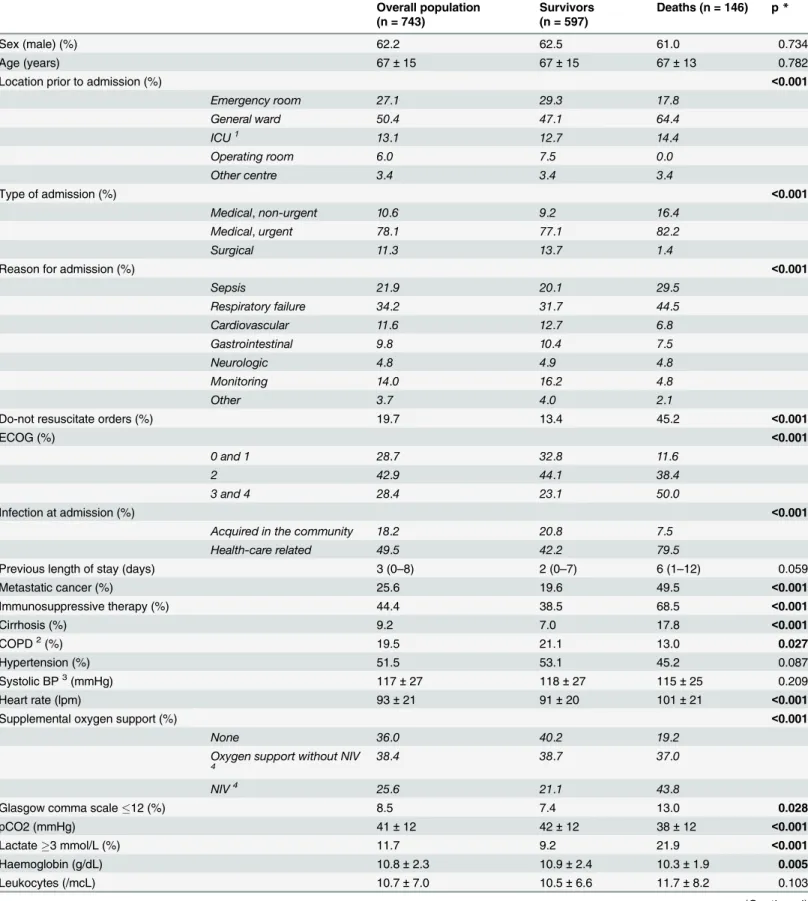
Patient characteristics, reasons for admission, and relevant data regarding main differences between survivors and deaths are summarized inTable 1. The mean age was 67 years with 62% male. The patients were admitted from the general ward (50.4%), the emergency room (27.1%), the ICU (13.1%), the operating room (6.0%) and from other hospital wards (3.4%). Reasons for admission were primarily medical (88.7%), with respiratory failure (34.2%) and sepsis (21.9%) as the leading causes. The median length of ImCU stay was 4 (2–7) days.
Table 1. Patient characteristics and complementary data.
Overall population (n = 743)
Survivors (n = 597)
Deaths (n = 146) p*
Sex (male) (%) 62.2 62.5 61.0 0.734
Age (years) 67±15 67±15 67±13 0.782
Location prior to admission (%) <0.001
Emergency room 27.1 29.3 17.8
General ward 50.4 47.1 64.4
ICU1 13.1 12.7 14.4
Operating room 6.0 7.5 0.0
Other centre 3.4 3.4 3.4
Type of admission (%) <0.001
Medical,non-urgent 10.6 9.2 16.4
Medical,urgent 78.1 77.1 82.2
Surgical 11.3 13.7 1.4
Reason for admission (%) <0.001
Sepsis 21.9 20.1 29.5
Respiratory failure 34.2 31.7 44.5
Cardiovascular 11.6 12.7 6.8
Gastrointestinal 9.8 10.4 7.5
Neurologic 4.8 4.9 4.8
Monitoring 14.0 16.2 4.8
Other 3.7 4.0 2.1
Do-not resuscitate orders (%) 19.7 13.4 45.2 <0.001
ECOG (%) <0.001
0 and 1 28.7 32.8 11.6
2 42.9 44.1 38.4
3 and 4 28.4 23.1 50.0
Infection at admission (%) <0.001
Acquired in the community 18.2 20.8 7.5
Health-care related 49.5 42.2 79.5
Previous length of stay (days) 3 (0–8) 2 (0–7) 6 (1–12) 0.059
Metastatic cancer (%) 25.6 19.6 49.5 <0.001
Immunosuppressive therapy (%) 44.4 38.5 68.5 <0.001
Cirrhosis (%) 9.2 7.0 17.8 <0.001
COPD2(%) 19.5 21.1 13.0 0.027
Hypertension (%) 51.5 53.1 45.2 0.087
Systolic BP3(mmHg) 117±27 118±27 115±25 0.209
Heart rate (lpm) 93±21 91±20 101±21 <0.001
Supplemental oxygen support (%) <0.001
None 36.0 40.2 19.2
Oxygen support without NIV
4
38.4 38.7 37.0
NIV4 25.6 21.1 43.8
Glasgow comma scale12 (%) 8.5 7.4 13.0 0.028
pCO2 (mmHg) 41±12 42±12 38±12 <0.001
Lactate3 mmol/L (%) 11.7 9.2 21.9 <0.001
Haemoglobin (g/dL) 10.8±2.3 10.9±2.4 10.3±1.9 0.005
Leukocytes (/mcL) 10.7±7.0 10.5±6.6 11.7±8.2 0.103
Design and performance of the ImCUSS
The final multivariable model obtained from the derivation cohort (554 patients) contained only 9 variables that were obtained at admission to the ImCU: previous length of stay7 days, health-care related infection, metastatic cancer, immunosuppressive therapy (includes steroids and other immunosuppressive drugs), Glasgow comma scale12, need of non-invasive mechanical ventilation, platelets50000/mcL, urea0.6 g/L and bilirubin4 mg/dL. No
Table 1. (Continued)
Overall population (n = 743)
Survivors (n = 597)
Deaths (n = 146) p*
Platelets (/mcL) 222±148 229±143 194±164 0.018
Pro-thrombin time (%) 79.1±42.0 81.0±45.1 71.5±24.8 0.017
C-reactive protein (mg/dL) 12.4±11.3 12.0±11.3 14.1±11.5 0.056
Creatinine (mg/dL) 1.4±1.1 1.4±1.1 1.6±1.2 0.182
Urea (g/L) 0.60±0.42 0.57±0.39 0.75±0.47 <0.001
RIFLE score (%) 0.026
Risk 10.6 9.9 13.7
Injury 5.8 5.4 7.5
Failure 4.3 3.4 8.2
Loss 0.3 0.2 0.7
ESRD5 2.2 2.0 2.7
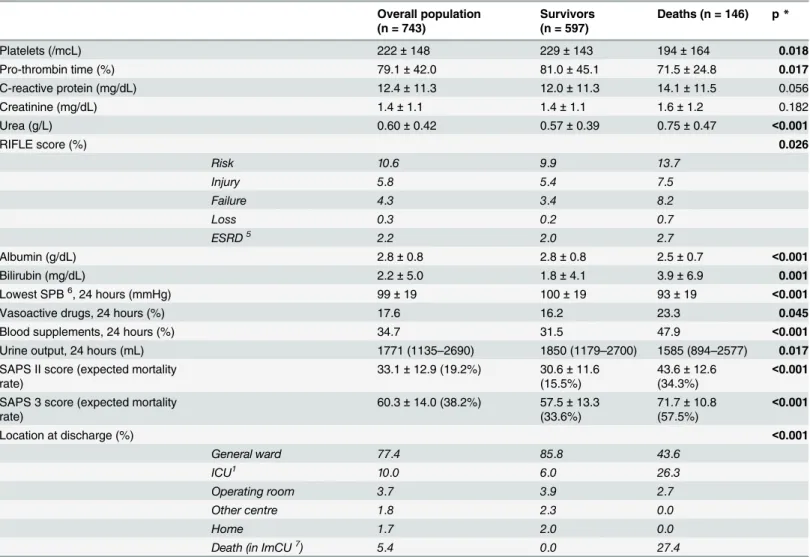
Albumin (g/dL) 2.8±0.8 2.8±0.8 2.5±0.7 <0.001
Bilirubin (mg/dL) 2.2±5.0 1.8±4.1 3.9±6.9 0.001
Lowest SPB6, 24 hours (mmHg) 99±19 100±19 93±19
<0.001
Vasoactive drugs, 24 hours (%) 17.6 16.2 23.3 0.045
Blood supplements, 24 hours (%) 34.7 31.5 47.9 <0.001
Urine output, 24 hours (mL) 1771 (1135–2690) 1850 (1179–2700) 1585 (894–2577) 0.017
SAPS II score (expected mortality rate)
33.1±12.9 (19.2%) 30.6±11.6
(15.5%)
43.6±12.6
(34.3%) <
0.001
SAPS 3 score (expected mortality rate)
60.3±14.0 (38.2%) 57.5±13.3
(33.6%)
71.7±10.8
(57.5%) <
0.001
Location at discharge (%) <0.001
General ward 77.4 85.8 43.6
ICU1 10.0 6.0 26.3
Operating room 3.7 3.9 2.7
Other centre 1.8 2.3 0.0
Home 1.7 2.0 0.0
Death (in ImCU7) 5.4 0.0 27.4
*All the remaining variables including diabetes, dyslipidemia, heart failure, previous coronary heart disease, heart arrhythmia, neurologic illness, body mass index, temperature, pH, sodium, potassium, magnesium and GPT were not statistically significant. Some variables described as continuous were also studied as polychotomous and dichotomous ones.
1ICU: Intensive Care Unit.
2COPD: Chronic Obstructive Pulmonary Disease. 3BP: Blood Pressure.
4NIV: Non-invasive Ventilation. 5ESRD: End-Stage Renal Disease. 6SBP: Systolic Blood Pressure. 7ImCU: Intermediate Care Unit.
continuous variables were included, as some of them were transformed into dichotomous vari-ables to simplify the model (conversion of polychotomus and continuous varivari-ables from the univariable analysis to dichotomous ones in the final multivariable analysis was made based on sensitivity analysis regarding different groups obtained for each variable, and favouring previ-ous cut-offs described in the literature when possible). Parameters that were measured in the 24 hour interval after admission to the ImCU were also excluded, in order to make the score able to be calculated at admission to the ImCU and to avoid the potential Boyd and Grounds effect [23]. Additionally, we did not include variables that could have in our data a subjective component, such as ECOG scale (it was collected retrospectively in our series). Both DNR orders and the presence of solid organ metastatic and/or haematological cancer were signifi-cantly related to in-hospital mortality in the univariate analysis. Nonetheless, in order to avoid collinearity (65.4% of patients with DNR orders had also metastatic cancer), we excluded DNR for the final multivariate model.
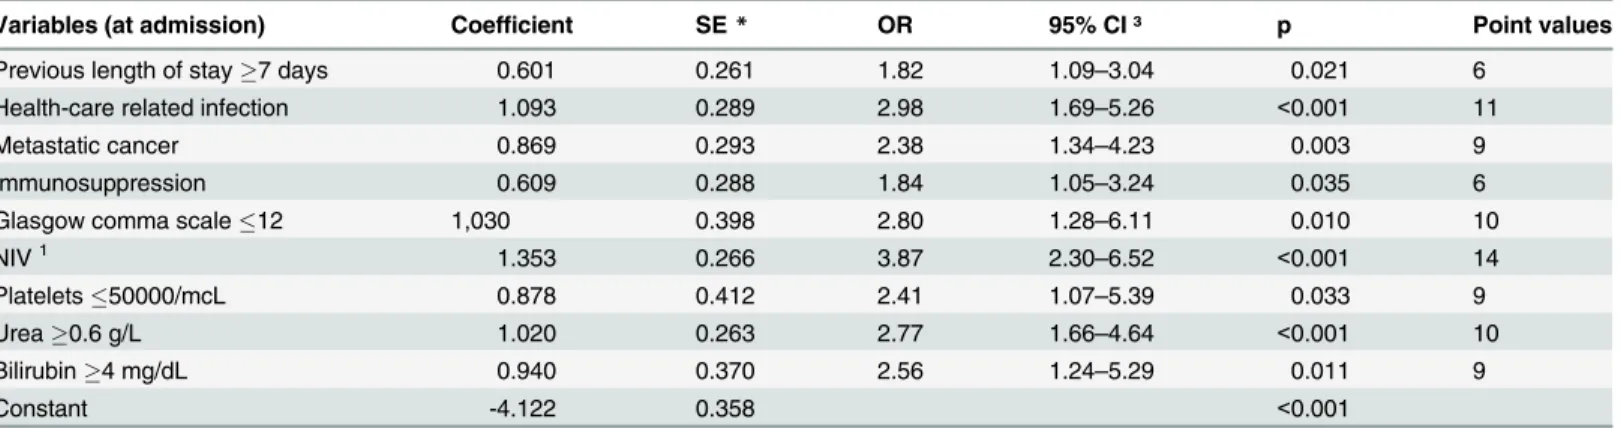
The logistic regression model coefficients, SE, odds ratios, the 95% CI for the odds ratios, p values, and the point value for each of the predictor variables are shown inTable 2. Model per-formance was adequate, with Hosmer-Lemeshow GOF C test showingχ213.039, degrees of freedom 8, p = 0.111. p-value is greater than 0.05, suggesting that the model is well calibrated and predicts probabilities that reflect the true mortality experience of the data. The bootstrap-ping simulation validates that the developed model has good calibration as 974 of the 1000 Hosmer-Lemeshow GOF p values (97.4%) were greater than 0.05.
The ImCUSS is generated by summing the individual point values (Table 2) based on the patients’status at ImCU admission, resulting in a minimal score of 0 and a maximal score of 84. The mean ± standard deviation score in the development group was 22.1 ± 15.2.). The AUROC was 0.843 (95% CI 0.805–0.881), showing good discrimination.
Probability of in-hospital mortality based on the ImCUSS was estimated using logistic regression. The scale of the score was determined to be linear in the logit using fractional poly-nomials. The coefficient for the score is 0.099 (standard error 0.010, OR 1.10 with 95% CI 1.08–1.13, p<0.001), and the model intercept -4.111 (standard error 0.342, p<0.001). The Hos-mer-Lemeshow GOF p value is 0.111. In order to estimate the probability of in-hospital mor-tality, one would multiply the obtained ImCUSS by the coefficient and then add the intercept.
Table 2. Mortality prediction model—using maximum likelihood estimation logistic regression.
Variables (at admission) Coefficient SE* OR₸ 95% CI ³ p Point values
Previous length of stay7 days 0.601 0.261 1.82 1.09–3.04 0.021 6
Health-care related infection 1.093 0.289 2.98 1.69–5.26 <0.001 11
Metastatic cancer 0.869 0.293 2.38 1.34–4.23 0.003 9
Immunosuppression 0.609 0.288 1.84 1.05–3.24 0.035 6
Glasgow comma scale12 1,030 0.398 2.80 1.28–6.11 0.010 10
NIV1 1.353 0.266 3.87 2.30
–6.52 <0.001 14
Platelets50000/mcL 0.878 0.412 2.41 1.07–5.39 0.033 9
Urea0.6 g/L 1.020 0.263 2.77 1.66–4.64 <0.001 10
Bilirubin4 mg/dL 0.940 0.370 2.56 1.24–5.29 0.011 9
Constant -4.122 0.358 <0.001
*SE: Standard Error
₸OR: Odds Ratio 3CI: Con
fidence Interval
1NIV: Non-invasive ventilation
This sum would be exponentiated and then divided by the addition of one plus the exponen-tiated sum.
ImCUSSformula:eImCUSSpoints0:099 4;111
=ð1þeImCUSSpoints0:099 4;111 Þ
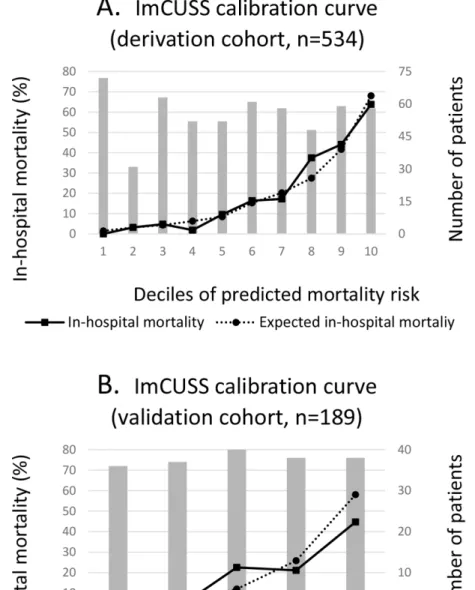
Fig 1Acompares observed and predicted mortality (based on the ImCUSS) for all subjects
in the development cohort when using deciles of in-hospital mortality risk. These results indi-cate that estimated and observed hospital mortality pairs were very similar.
Fig 1. Calibration curves based on Hosmer-Lemeshow goodness-of-fit C test for ImCUSS.
Performance of the obtained score was studied in the validation cohort (189 patients). The Hosmer-Lemeshow goodness-of-fit showedχ28.078 with 7 degrees of freedom and p = 0.326, indicating good calibration. Ability to discriminate in-hospital mortality was also good, with area under receiver operating curve of 0.802 (95% CI 0.733–0.871) (Fig 2). ImCUSS calibration curve for the validation cohort is shown inFig 1B.
Comparison of ImCUSS with SAPS II and SAPS 3
The mean ImCUSS (in the validation cohort), SAPS II and SAPS 3 (in the whole cohort) were 21±16.1, 33.1±12.9 and 60.3±14.0 respectively. The expected mortality rates derived from these scores were 20.7±21.9%, 19.2±18.1% and 38.3±23.0%. The observed in-hospital mortality was 18.5% in the validation cohort (35/189) and 19.7% in the whole cohort (146/743), resulting in a standardized mortality ratio (SMR) of 0.89 (95% CI 0.59–1.19) for ImCUSS, 1.03 (95% CI 0.86–1.20) for SAPS II and 0.51 (95% CI 0.43–0.59) for SAPS 3. Interestingly, SAPS 3 clearly overestimated mortality, while SAPS II and ImCUSS showed results closer to the observed mortality.
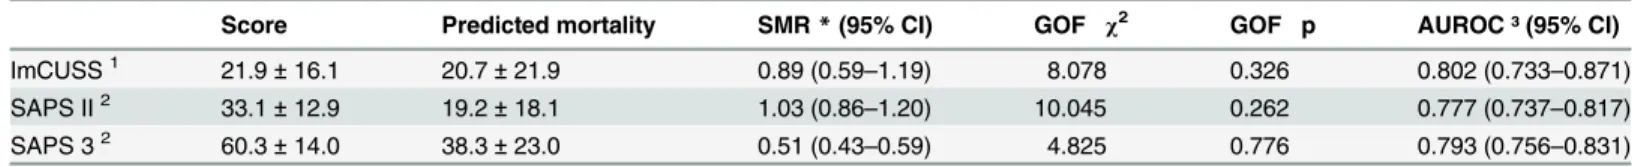
Performance of the models is presented inTable 3. The scores showed acceptable discrimi-nation, with an AUROC of 0.802 (95% CI 0.733–0.871) for ImCUSS, 0.777 (95% CI 0.737–
0.817) for SAPS 2 and 0.793 (95% CI 0.756–0.831) for SAPS 3. The scores also showed similar calibration performance based on the Hosmer-Lemeshow GOF C-test:χ2= 8.708 and p = 0.326 for ImCUSS,χ2= 10.045 and p = 0.262 for SAPS II, andχ2= 4.825 and p = 0.776 for SAPS 3. Integrated discrimination improvement analysis showed p values of 0.898 and 0.231 when comparing performance of ImCUSS versus SAPS II and SAPS 3 scores.
Fig 2. ImCUSS receiver operating characteristic curve (ROC) for mortality in the validation cohort (n = 189).
Clinical application of ImCUSS
In an effort to simplify the clinical application, sensitivity analysis was performed to find criti-cal values which could classify patients in statisticriti-cally different mortality groups. ImCUss was divided in 5 mortality groups; their cut-off values and mean probabilities of in-hospital death are shown inTable 4.
Additionally, we decided to study whether ImCUSS could also be useful to identify patients who may benefit of a direct ICU admission in those subjects suitable for transfer to a higher level of care in case of worsening (thus excluding patients with DNR orders at ImCU admis-sion). Transfer to a higher level of care in the first 48 hours after ImCU admission may reflect inappropriate triage, and obviously warrants further consideration. Only 45/597 patients in our series were discharged to the ICU in the first 48 hours after ImCU admission, thus reflect-ing adequate global triage. Nevertheless, when studyreflect-ing this endpoint in the different mortality groups previously described (Table 4), we observe that patients with an ImCUSS42 should be considered for direct ICU admission (eventually, 38.5% of them would need transfer to this unit in the following 48 hours in case they are admitted to the ImCU).
Discussion
ImCUs are an attractive alternative for the management of complex patients, in need of special monitoring and nursing care. Concerning the high costs of the traditional ICU and the limited resources of the general wards, multipurpose ImCUs were developed to try to give rational and proportional care. Description of this population is necessary and must be based on accurate severity scoring. Multiple severity scores have been designed and widely described in ICU patients: APACHE II, APACHE III, SAPS II, SAPS 3, SOFA, APACHE IV, MPM II (0 and 24),
Table 4. Clinical application of ImCUSS.
ImCUSS—Points 16 17–20 21–30 31–41 42
Number of patients 291 69 159 142 82
Observed mortality (%) 2.1 (6/291) 10.1 (7/69) 20.1 (32/159) 36.6 (52/142) 59.8 (49/82)
Mean expected mortality rate (%) 3.71 8.98 16.77 35.37 67.91
ICU transfer in thefirst 48 hours1(%) 2.6 (7/272) 3.3 (2/61) 7.4 (9/122) 11.7 (12/103) 38.5 (15/39)
1
data regarding ICU (intensive care unit) transfer in thefirst 48 hours after ImCU (intermediate care unit) admission were calculated considering only patients suitable for transfer to a higher level of care in case of worsening (thus excluding patients with do-not-resuscitate orders at ImCU admission).
doi:10.1371/journal.pone.0130989.t004
Table 3. Performance of ImCUSS, SAPS II and SAPS 3.
Score Predicted mortality SMR*(95% CI) GOF₸χ2 GOF₸p AUROC ³ (95% CI)
ImCUSS1 21.9±16.1 20.7±21.9 0.89 (0.59–1.19) 8.078 0.326 0.802 (0.733–0.871)
SAPS II2 33.1±12.9 19.2±18.1 1.03 (0.86
–1.20) 10.045 0.262 0.777 (0.737–0.817)
SAPS 32 60.3±14.0 38.3±23.0 0.51 (0.43
–0.59) 4.825 0.776 0.793 (0.756–0.831)
*SMR: Standardized Mortality Ratio.
₸GOF: Goodness-Of-Fit.
3AUROC: Area Under Receiver Operating Characteristic Curve 1Performance in the validation cohort (n = 189).
2Performance in the whole cohort (n = 743).
among others [12–21]. However, the information is scarce and the ability of these scores to accurately and reliably predict mortality in ImCU is inconsistent.
In 1998, Auriant et al [8] described the performance of SAPS II in a cohort of 433 patients, showing good discriminant power (AUROC 0.85) and calibration (C = 2.4, p<0.5), with an SMR of 0.93. Posteriorly, Ip et al [9] described the application of the APACHE II and SAPS scores in a geriatric ImCU cohort of 150 patients. Both scores showed acceptable performance regarding observed to expected mortality ratios (correlation coefficients of 0.97 and 0.92 respectively), but there is no data about calibration. In 2006, Torres et al [11] described the mortality risk of a cohort of 412 patients, using the APACHE II and TISS-28 scores. Mortality discrimination was acceptable (AUROC 0.77 and 0.88 respectively), and the scores showed sta-tistical significant correlation with mortality in the logistic regression analysis. Unfortunately, the scores were not calibrated. Recently, our group described the performance of SAPS II and SAPS 3 in a cohort of 607 patients [5]. Both scores showed acceptable discrimination (AUROC 0.76 and 0.75 respectively) and calibration (χ2= 12.9, p = 0.113 for SAPS II andχ2= 4.07, p = 0.851for SAPS 3). Nonetheless, in this study SAPS 3 clearly overestimated mortality (SMR = 0.56), while the oldest version SAPS II showed better discrimination in terms of SMR, with results closer to the observed mortality (SMR = 0.87). These conflicting results, and the insufficient information, emphasize the need to find more reliable and accurate scores for the ImCU setting. In this context, the present study describes the design and performance of a new severity-of-illness model, which was developed using simple variables, easily obtained at patient admission to the ImCU. To the best of our knowledge, this is the first description of a new score, specifically designed for intermediate care. Moreover, it included the largest popula-tion in this setting.
Data regarding patient characteristics and overall mortality are similar to those previously published by our group [1,5]. Observed in-hospital mortality was 19.7%, different to that of other ImCUs and similar to that observed in ICU population, with very high risk for major complications and mortality. The contribution of oncologic patients (284/753), most of them with advanced disease (194/284 had metastatic cancer and/or haematological cancer) and ele-vated severity-of-illness scoring system predicted risk of death (with mean expected mortality rates of 24.5, 49.5 and 31.1% based on SAPS II, SAPS 3 and ImCUSS scores) probably contrib-uted to the high acuity of our population. Additionally, a total of 146/793 patients had DNR-orders at admission to the ImCU.
The ImCUSS was designed based on 554 patients, and internally validated in 189 additional patients. Its simplicity is remarkable, as it only contains 9 dichotomic variables that are easily obtained in common practice. Four of them are related to previous history (length of in-hospi-tal stay7 days, health-care related infection, metastatic cancer and immunosuppressive ther-apy), two of them are bed-side obtained (Glasgow Comma Scale12 and need of non-invasive mechanical ventilation), and the remaining three variables depend on routine blood tests (platelets50000/mcL, urea0.6 g/L and bilirubin4 mg/dL) (Table 2). Consequently, its application could reduce the collection burden and potential errors associated to the time-con-suming traditional scores. Despite the small number of patients, the ImCUSS showed adequate calibration and discrimination (Figs1and2, andTable 3). Moreover, limiting acquisition of data to patient admission should minimise the impact of mortality overestimation associated with the occurrence of more abnormal physiologic values during the first 24 hours of ImCU stay. This, so-called Boyd and Grounds effect [23], might affect mortality prediction in scores like SAPS II, because the increase in computed severity illness and predicted mortality could be due to suboptimal care, more than to an increase in disease severity.
ImCUSS (SMR = 0.89) and SAPS II (SMR = 1.03). In this setting, the differences in the case-mix profiles with the original cohort (SAPS 3), and the simplicity of the two other scores could explain this potential mortality overestimation [24]. Recent external validation studies showed similar results for SAPS 3 [5,25–26]. Nonetheless, although the global performance of the ImCUSS, SAPS II and 3 did not revealed meaningful differences, three aspects must be highlighted. First of all, ImCUSS is specifically designed for multipurpose ImCUs. Secondly, collection of data is made at admission to the ImCU (SAPS II includes variables collected in the first 24 hours after admission). Finally, its simplicity could be a remarkable advantage for ImCU mortality prediction.
Clinical application of ImCUSS is evident, as it provides prognostic information and an esti-mated in-hospital mortality rate. In addition, it may also be useful to identify patients who may benefit of a direct ICU admission, as we have previously observed inTable 4.
However, in the present study some limitations must be addressed. Lack of data regarding post-ImCU care and its impact in hospital-derived outcomes is shared by all previous scoring systems [27]. The limited number of patients derived from a single centre multipurpose ImCU, and even more restricted samples of various subgroups of the population (patients with AIDS were absent), could interfere with the evaluation of the uniformity-of-fit among different expected mortality subgroups and also limit the applicability of the new score in these specific populations. Furthermore, as previously explained, the case-mix of our cohort (advanced age, high prevalence of cancer, deteriorated functional status and DNR orders) may differ from that in other ImCUs, limiting the extrapolation of the results. Accordingly, we need larger, prospec-tive and well-designed studies with external validation cohorts, before the routine application of the ImCUSS.
Conclusions
ImCUSS is a new score specially designed for intermediate care, based on simple and easy to calculate variables at admission, and with a notable performance in terms of calibration and mortality discrimination.
Acknowledgments
The authors thank the Nursing Staff of the ImCU for their unconditional support in patient care.
Author Contributions
Conceived and designed the experiments: FA MFL JQ JFL. Performed the experiments: FA MFL AH NFR DMU JFL. Analyzed the data: FA MFL DM NG JQ JFL. Contributed reagents/ materials/analysis tools: FA MFL AH NFR JFL. Wrote the paper: FA MFL NG JQ JFL.
References
1. Lucena JF, Alegre F, Rodil R, Landecho MF, García-Mouriz A, Marqués M, et al. Results of a restros-pective observational study of intermediate care staffed by hospitalists: impacto n mortality, co-man-agemente, and teaching. J Hosp Med. 2012; 7: 411–415. doi:10.1002/jhm.1905
2. Franklin CM, Rackow EC, Mamdani B, Nightingale S, Burke G, Weil MH. Decreases in mortality on a large urban medical service by facilitating Access to critical care. An alternative to rationing. Arch Intern Med. 1988; 148: 1403–1405. PMID:3132123
3. Byrick RJ, Mazer CD, Caskennette GM. Closure of an intermediate care unit. Impact on critical care uti-lization. Chest. 1993; 104: 876–881. PMID:8365304
5. Lucena JF, Alegre F, Martínez-Urbistondo D, Landecho MF, Huerta A, García-Mouriz A, et al. Perfor-mance of SAPS II and SAPS 3 in intermediate care. PLoS One. 2013; 8: e77229. doi:10.1371/journal. pone.0077229PMID:24130860
6. Byrick RJ, Power JD, Ycas JO, Brown KA. Impact of an intermediate care area on ICU utilization after cardiac surgery. Crit Care Med. 1986; 14: 869–872. PMID:3757527
7. Elpern EH, Silver MR, Rosen RL, Bone RC. The noninvasive respiratory care unit. Patterns of use and financial implications. Chest. 1991; 99: 205–208. PMID:1898646
8. Auriant I, Vinatier I, Thaler F, Tourneur MR, Loirat P. Simplified acute physiology score II for measuring severity of illness in intermediate care units. Crit Care Med. 1998; 26: 1368–1371. PMID:9710096
9. Ip SP, Leung YF, Ip CY, Mak WP. Outcomes of critically ill elderly patients: is high-dependency care for geriatric patients worthwhile? Crit Care Med. 1999; 27: 2351–2357. PMID:10579247
10. Bertolini G, Confalonieri M, Rossi C, Rossi G, Simini B, Gorini M, et al. Costs of the COPD. Differences between intensive care unit and respiratory intermediate care unit. Respir Med. 2005; 99: 894–900. PMID:15939252
11. Torres OH, Francia E, Longobardi V, Gich I, Benito S, Ruiz D. Short- and long-term outcomes of older patients in intermediate care units. Intensive Care Med. 2006; 32: 1052–1059. PMID:16791668
12. Gunning K, Rowan K. ABC of intensive care: outcome data and scoring systems. BMJ. 1999; 319: 241–244. PMID:10417092
13. Le Gall JR, Lemeshow S, Saulnier F. A new simplified acute physiology score (SAPS II) based on a European/North American multicenter study. JAMA. 1993; 270: 2957–2963. PMID:8254858
14. Moreno RP, Metnitz PG, Almeida E, Jordan B, Bauer P, Campos RA, et al. SAPS 3–From evaluation of the patient to evaluation of the intensive care unit. Part 2: development of a prognostic model for hos-pital mortality at ICU admission. Intensive Care Med. 2005; 31: 1345–1355. PMID:16132892
15. Vincent JL, Moreno R, Takala J, Willatts S, de Mendoça A, Bruining H, et al. The SOFA (Sepsis-related Organ Failure Assessment) score to describe organ dysfunction/failure. Intensive Care Med. 1996; 22: 707–710. PMID:8844239
16. Knaus WA, Draper EA, Wagner DP, Zimmerman JE. APACHE II: a severity of disease classification system. Crit Care Med. 1985; 13: 818–829. PMID:3928249
17. Knaus WA, Wagner DP, Draper EA, Zimmerman JE, Bergner M, Bastos PG, et al. The APACHE III prognostic system. Risk prediction of hospital mortality for critically ill hospitalized adults. Chest. 1991; 100: 1619–1636. PMID:1959406
18. Zimmerman JE, Kramer AA, McNair DS, Malila FM. Acute Physiology and Chronic Health Evaluation (APACHE) IV: hospital mortality assessment for today’s critically ill patients. Crit Care Med. 2006; 34: 1297–1310. PMID:16540951
19. Lemeshow S, Teres D, Klar J, Avrunin JS, Gehlbach SH, Rapoport J. Mortality Probability Models (MPM II) based on an international cohort of intensive care unit patients. JAMA. 1993; 270: 2478–
2486. PMID:8230626
20. Higgins TL, Teres D, Copes WS, Nathanson BH, Stark M, Kramer AA. Assessing contemporary inten-sive care unit outcome: an updated mortality probability admission model (MPM0-III). Crit Care Med. 2007; 35: 827–835. PMID:17255863
21. Breslow MJ, Badawi O. Severity scoring in the critically ill. Part 1–interpretation and accuracy of out-come prediction scoring systems. Chest. 2012; 78: 1261–1269. doi:10.1378/chest.11-0330
22. Nasraway SA, Cohen IL, Dennis RC, Howenstein MA, Nikas DK, Warren J, et al. Guidelines on admis-sion and discharge for adult intermediate care units. American College of Critical Care Medicine of the Society of Critical Care Medicine. Crit Care Med. 1998; 26: 607–610. PMID:9504593
23. Boyd O, Grounds RM. Physiological scoring systems and audit. Lancet. 1993; 341: 1573–1574. PMID: 8099649
24. Metnitz PG, Lang T, Vesely H, Valentin A, Le Gall JR. Ratios of observed to expected mortality are affected by differences in case mix and quality of care. Intensive Care Med. 2000; 26: 1466–1472. PMID:11126258
25. Strand K, Søreide E, Aardal S, Flaaten H. A comparison of SAPS II and SAPS 3 in a Norwegian inten-sive care unit population. Acta Anaesthesiol Scand. 2009; 53: 595–600. doi:10.111/j.1399-6576.2009. 01948.x
26. Poole D, Rossi C, Latronico N, Rossi G, Finazzi S, Bertolini G. Comparison between SAPS II and SAPS 3 in predicting hospital mortality in a cohort of 103 Italian ICUs. Is new always better? Intensive Care Med. 2012; 38: 1280–1288. doi:10.1007/s00134-012-2578-0PMID:22584793