Abstract
Synaesthesia is an unusual perceptual experience in which an inducer stimulus triggers a percept in a different domain in addition to its own. To explore the conditions under which synaesthesia evolves, we studied a neuronal network model that represents two recurrently connected neural systems. The interactions in the network evolve according to learning rules that optimize sensory sensitivity. We demonstrate several scenarios, such as sensory deprivation or heightened plasticity, under which synaesthesia can evolve even though the inputs to the two systems are statistically independent and the initial cross-talk interactions are zero. Sensory deprivation is the known causal mechanism for acquired synaesthesia and increased plasticity is implicated in developmental synaesthesia. The model unifies dif-ferent causes of synaesthesia within a single theoretical framework and repositions synaes-thesia not as some quirk of aberrant connectivity, but rather as a functional brain state that can emerge as a consequence of optimising sensory information processing.
Author Summary
Synaesthesia is a remarkable form of altered perception, where one attribute of a stimulus (e.g. sound) leads to the conscious experience of an additional attribute (often colour). Despite being known about for 200 years, there is no commonly agreed upon model for how and why synaesthesia emerges. This study presents a new model of synaesthesia based on computational principles that accounts for the emergence of different types of synaesthesia (acquired and developmental) as well as many of its key characteristics. The model describes how two independent neuronal systems can evolve to interact with one another even though their inputs are statistically uncorrelated. Specifically, synaesthesia arises as a result of instability in the learning process that shapes the network, which can be caused by heightened plasticity or due to sensory deprivation of one of the systems. The
OPEN ACCESS
Citation:Shriki O, Sadeh Y, Ward J (2016) The Emergence of Synaesthesia in a Neuronal Network Model via Changes in Perceptual Sensitivity and Plasticity. PLoS Comput Biol 12(7): e1004959. doi:10.1371/journal.pcbi.1004959
Editor:Jeff Beck, Duke University, UNITED STATES
Received:November 27, 2015
Accepted:May 4, 2016
Published:July 8, 2016
Copyright:© 2016 Shriki et al. This is an open access article distributed under the terms of the Creative Commons Attribution License, which permits unrestricted use, distribution, and reproduction in any medium, provided the original author and source are credited.
Data Availability Statement:All relevant data are within the paper and its Supporting Information files. The paper contains only data from numerical simulations of a theoretical model.
Funding:This research was funded by: Israel Science Foundation (grant 754/14 to OS) ESRC -Economic and Social Research Council (grant ES/ K006215/1 to JW). The funders had no role in study design, data collection and analysis, decision to publish, or preparation of the manuscript.
model unifies different aspects of synaesthesia and generates novel insights and predictions.
Introduction
Synaesthesia is a remarkable form of altered perception. One attribute of a stimulus (e.g. its sound, shape or meaning) may inevitably lead to the conscious experience of an additional attribute (often colour). For example, the word“Phillip”may taste of sour oranges, the graph-eme A may be bright red, and a C# note on the violin may be a brown fuzzy line extending from left to right in the lower left part of space [1]. Although the precise definition of synaes-thesia remains open to debate [2], there are a number of generally agreed upon characteristics. The first is that synaesthesia is elicited by particular stimuli (unlike hallucinations which may occur spontaneously). The stimulus that elicits the synaesthesia is termed the inducer and the synaesthetic experience itself is the concurrent [3]. A second characteristic is that the experi-ence is automatic. That is, the inducer inevitably leads to the concurrent experiexperi-ence. Finally, synaesthetic concurrents are (from a first-person perspective) described as being percept-like. In corroboration of this, functional imaging studies have often found activity within perceptual regions (e.g. colour-sensitive regions) when synaesthesia is experienced [4].
Existing Accounts of the Causes and Mechanisms of Synaesthesia
A broad distinction made in the synaesthesia literature is between acquired and developmental forms and it is presently unclear whether a single model or mechanism can account for them both.
Developmental forms of synaesthesia have no known triggering event. The typical explana-tion is that genetic differences in these individuals give rise to structural and funcexplana-tional differ-ences in their brains [5]. Genetic differences linked to synaesthesia have been identified and synaesthesia is known to run in families [e.g.6]. However, the exact synaesthetic associations themselves do not appear to be inherited, despite being stable within individuals. Thus, a mother may perceive‘A’as red and her daughter may perceive it as blue [7]. One of the earlier ways of describing synaesthesia is in terms of a breakdown in modularity [8]. In effect, a given brain region (e.g. that responsible for colour perception) responds to multiple inputs in synaesthetes but not others (e.g. responding to sounds or achromatic letters as well as colours). The evidence from functional imaging generally supports this idea [4].
Ramachandran and Hubbard [9] suggest that adjacent regions of cortex may be particularly predisposed to pair as synaesthetic inducers and concurrents in developmental synaesthesia. This may explain why combinations such as grapheme-colour synaesthesia are particularly prevalent [10]; i.e. because of anatomical proximity within the visual ventral stream of graph-eme recognition and colour perception. Computational models in general have suggested that a high degree of local clustering is an optimal solution for cortico-cortical connectivity [11].
impairments [e.g. blindness21] or as a result of taking certain drugs such as LSD (lysergic acid diethylamide[22]). The latter tends to be temporary and occurs quickly (minutes, hours), whereas the former can occur either quickly (days) or slowly (months or years) and lasts for long or indefinite periods. Superficially, acquired synaesthesia appears to have somewhat differ-ent characteristics from developmdiffer-ental forms of synaesthesia. The nature of the inducer tends to be a sensory stimulus: there are no instances on record of acquired grapheme-colour synaes-thesia, for example. This faster acting mechanism is consistent with unmasking (i.e. removal of inhibition) of pathways that are already established or enhancement of existing excitatory inter-actions. For instance, after blindfolding for a few days the‘visual’cortex responds to inputs from touch and audition [23]. Although this is not strictly synaesthesia, it represents an example of an inducer triggering a concurrent in neurophysiological terms if not in terms of perceptual experience. In addition to changes in inhibition/excitation, there may be slower-acting struc-tural changes [e.g. synaptogenesis along multi-sensory pathways24] that lead to acquired syn-aesthesia and explains why the onset of synsyn-aesthesia can occur up to a year after sensory loss.
Computational Models of Synaesthesia
There is only one known computational model of synaesthesia [25]. This model is based on a self-organising Kohonen network and was established to account for one very specific type of synaesthesia: a tendency of some people to experience the sequence of numbers in a spatial configuration. The approach taken in the present study is very different in that it aims to offer a general account of the kinds of scenarios in which synaesthesia might evolve from a neural network and is not seeking to model any particular variety of synaesthesia.
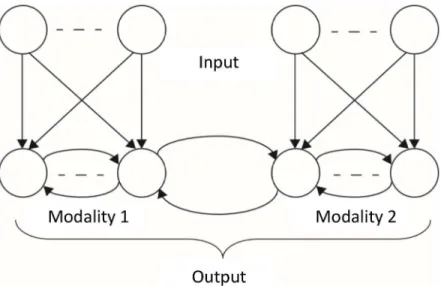
The basic architecture of the model below contains two sets of units that can be construed as different modalities (or, rather, features within a modality). The two different sets of input neurons connect to additional layers of output neurons (Fig 1). The neurons in each output layer are connected by recurrent connections and additional recurrent connections connect the two output layers with one another.
In order for synaesthesia to evolve in the first place it would require connections to already be in place between the two modalities, although not necessarily functional. This is develop-mentally plausible [26]. In our model the difference between synaesthetes and
non-synaesthetes lies in whether these connections become functional as a result of the learning process. The presence of synaesthesia is thus operationalised as stable non-zero cross-talk con-nections between modalities 1 and 2 (or vice versa), together with the observation that stimu-lating one set of inputs activates both modalities (i.e. 1!1+2 and/or 2!1+2).
into the modalities [27,28]. More specifically, the quality of the representation is measured by themutual information[29] between the input to the network and the neuronal output. Here the input corresponds to the total input to both modalities and similarly the output corre-sponds to the total output of both modalities after reaching steady state. In our context, the mutual information reflects the ability of the network to discriminate between two similar inputs or, in other words, its sensitivity to changes in the external inputs.
In the beginning of the learning process, the cross-talk connections are set to near zero. During learning, the network is presented with input samples of certain statistical characteris-tics. A major question relates to the role of statistical correlations between the inputs to both modalities. If the inputs are statistically correlated, it is not surprising that cross-talk connec-tions will evolve. From a computational point of view the network can take advantage of these correlations and improve the quality of the representation. However, it seems that in most real-world cases no such correlation underlies synaesthesia. Thus, we try to examine the conditions under which synaesthesia develops despite the fact that there are no correlations between the inputs. In our network model, when the inputs to the two modalities are uncorrelated, typically no cross-talk connections evolve. However, as we show in the following sections, under certain conditions they develop and synaesthesia emerges.
Results
Evolution of Cross-Talk in a Simple Network Model with Two
Interconnected Units
We first analyze a network where each modality contains a single input neuron and a single out-put neuron (Fig 2). The simplicity of this network model makes it amenable to analytical investi-gation in addition to computational simulations. The input and output neurons in each
modality are connected in a feed-forward manner. The input to each modality is taken to be normally distributed with zero mean, and the two one-dimensional distributions are statistically
Fig 1. Architecture of a general network model for studying synaesthesia.The network consists of two interacting modalities. Each modality has a set of input neurons and a set of output neurons. There are feedforward connections within each modality but not between them. There are recurrent connections among all output neurons. The subset of recurrent connections that connect the two modalities are referred to as cross-talk interactions. The goal of the network is to optimize the representation of the combined input from both sets of input neurons, by the neurons at the combined output layer.
independent. There are additional recurrent (cross-talk) connections between the two output units. Synaesthesia evolves when the cross-talk connections between the two units increase and become functional. In order to determine the evolution of synaesthesia, we first identify the con-ditions under which zero cross-talk connectivity (K12= K21= 0) is a fixed-point of the learning dynamics, and then look for the conditions under which this fixed-point becomes unstable. In other words, the question is what will happen to a small perturbation to the connections. If both connections go back to zero, the no-cross-talk state is a stable state. The interesting case is when this state becomes unstable and the cross-talk connections develop. The information maximiza-tion learning rules for the connecmaximiza-tions K12and K21form a set of two coupled nonlinear equa-tions. We linearized these equations around the point K12= K21= 0 and explored the discrete time dynamics by analysing the corresponding eigenvalues. The details of the investigation appear in the Supporting Information and the Results are summarised inFig 3.
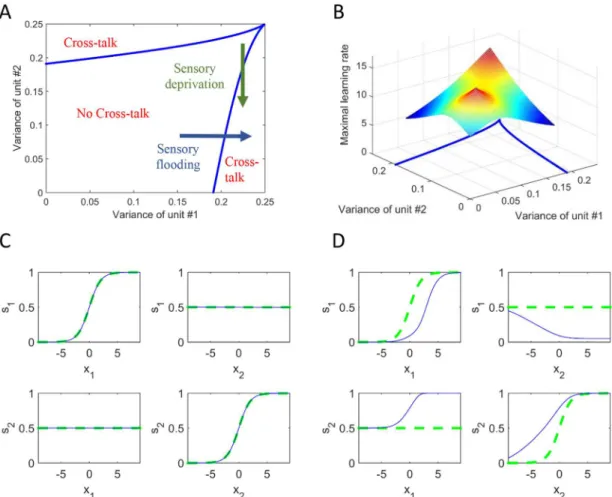
We first analysed how the stability of the fixed-point depends on the variances of the two output neurons. These variances are determined by the variances of the Gaussian distributions at the input. The higher the input variance, the higher the output variance, but due to the bounded non-linearity of the output neurons, the output variance is constrained to be between 0 and 0.25 (see Supporting Information).Fig 3Ashows the phase diagram of the stability as a function of the two output variances. For pairs of variances in the central region, the no-cross-talk state is stable. Outside this region cross-no-cross-talk connections evolve (i.e. synaesthesia occurs). There are various scenarios in which a network can be driven outside the no-cross-talk region. For instance, consider a situation in which the variance of the second unit is decreased (shown by the green arrow). This situation is analogous tosensory deprivationat the second unit. At the same point the network develops cross-talk connections from the non-deprived unit to the deprived unit, which increase the output variance at the deprived unit. Similarly, cross-talk connections evolve when the variance of the first unit is increased (shown by the blue arrow). This situation is analogous tosensory floodingat the first unit.
Fig 3Bshows the same phase diagram together with a surface which describes the critical learning rate,ηcritical, as a function of the variances. Above this surface, synaesthesia appears
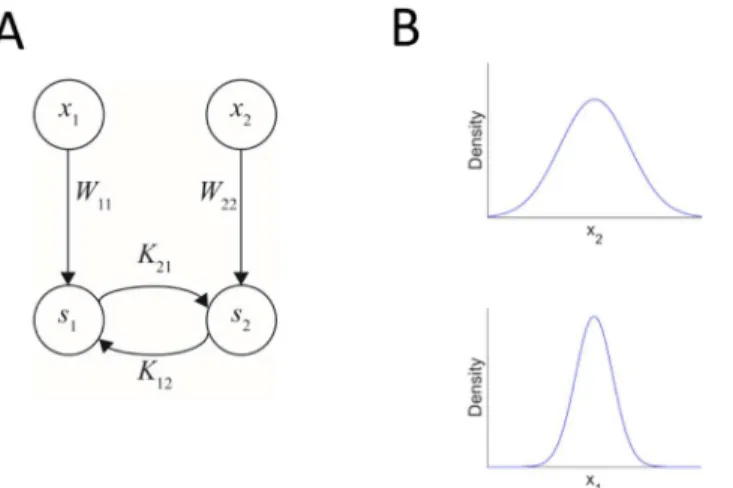
Fig 2. A simple network architecture to study the conditions for evolution of cross-talk interactions. (A) The network contains four neurons, one input neuron and one output neuron in each modality. The feedforward connections are denoted by W11and W22and the recurrent cross-talk connections are denoted by K12(from neuron 2 to 1) and K21(from neuron 1 to 2). In this simple case, there are no internal recurrent connections within each modality, only between them. (B) The inputs were drawn from two independent Gaussian distributions with zero mean. We analysed the effect of the variances of the two Gaussian distributions on the evolution of cross-talk connections.
(although the statistical variances alone give a "normal" state, without synaesthesia). This reflects instability of the learning dynamics due to the high plasticity. The interpretation is that people with high synaptic plasticity are more likely to develop synaesthesia. It cannot be seen in the graph (in order to have a satisfying resolution for the z-axis), but when both variances approach 0.25, the critical learning rate approaches infinity. This means that close to these vari-ance values and in the main regime (of no cross-talk), the learning rate must be very large to result in cross-talk, or synaesthesia.Fig 3C and 3Drepresent two specific examples of end points within this model space.Fig 3Crepresents the more typical scenario of no cross-talk such that s1 is sensitive to inputs from x1 alone and s2 is sensitive to inputs from x2 alone.Fig 3Drepresents an example of the state of the model after the evolution of cross-talk under a sen-sory flooding scenario. In this model, s2 is activated by inputs from both x2 and x1 (i.e. a case of modality 1!modality 2 synaesthesia). Note also how s2 has become more sensitive to its own inputs; that is, synaesthesia has increased unimodal sensitivity within the concurrent
Fig 3. Conditions on input statistics and network plasticity for the evolution of cross-talk interactions.A phase-diagram of stability as a function of output variances based on mathematical analysis (A) and additionally including the critical learning rate (B). There is a regime of stability where no cross-talk develops. Outside this regime, cross-talk connections evolve. The scenarios for losing stability are analogous tosensory deprivationorsensory flooding. C and D show the input and output activity for two specific scenarios depicting no cross-talk (C) and cross-talk (D). In all cases, one input was changed while the other was kept at 0. Thus, the panels show the response of each unit either to its direct input or to input to the other unit. The green dotted curve represents the state of the model before the beginning of the learning process and the blue solid curve represents the state after the learning process. In D, the solid blue curve represents the responses after the emergence of synaesthesia. In this particular case, the interactions evolved to: K12= -2.91 (2 inhibits 1), and K21= 14.34 (1 excites 2).
modality (modality 2). By contrast, the cross-modal inputs from modality 2 to modality 1 are negative (inhibitory); i.e. the synaesthesia is not bidirectional.
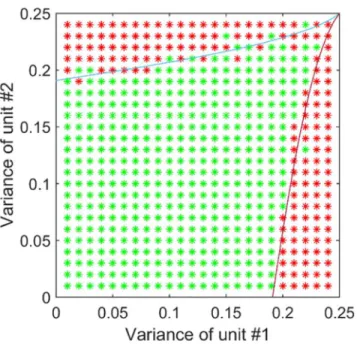
We next verified that results of the analytical investigation using numerical simulations of the corresponding network. The input to each modality was random and normally distributed. The range of variances was sampled in a resolution of about 0.01, and the total amount of sim-ulations was 729 (27x27). In each simulation the learning process was run with a different pair of variances (of both units). The initial values for the cross-talk connections were randomly chosen in a ring around the origin (K12= K21= 0). In this case, we checked whether the net-work converged back to the no cross-talk state or diverged. The results (Fig 4) are consistent with the analytical calculations. The "leaking" of stable-points into the theoretical unstable-area and vice versa, and the asymmetry in respect to the major diagonal is the result of insufficient accuracy or not enough learning-steps in the simulation.
The simple model reveals a number of scenarios in which cross-talk may emerge between recurrently connected units, receiving different inputs, based on the principle of maximising the overall sensitivity of the network model. Decreased variance of the input is analogous to sensory deprivation, which is the known aetiology in most (if not all) cases of acquired thesia. Sensory flooding (increased variance of one input) is another possible cause for synaes-thesia. Synaesthetes also have better perceptual discrimination within the concurrent modality [30]. Interestingly, it has recently been found that autism, which is linked to sensory flooding, is also co-morbid with synaesthesia [e.g.31]. Another finding is related to the learning rate. As the analysis shows, there is a critical value above which the network may develop synaesthesia. This prediction is consistent with the established fact that developmental synaesthesia usually occurs at an early age, when the brain is more plastic. It may also be related to the fact that developmental synaesthesia is linked to enhanced memory abilities [32].
Fig 4. Simulation results for varying input statistics on the evolution of cross-talk interactions.Green asterisks represent an absence of cross-talk after a long time and red asterisks represent the presence of cross-talk. The results are in close agreement with the mathematical analysis (shown with the curved lines). Close to this borderline, the dynamics are very slow and the simulation may terminate before reaching the predicted solution. Differences in the outcome could also relate to the different initial conditions of the model (which were selected at random).
Evolution of Synaesthesia in a Network with a High-Dimensional
Representation
The analysis of the simple model shows that the evolution of cross-talk connections occurs in several scenarios; namely sensory deprivation, sensory flooding and high plasticity. However, the existence of cross-talk in itself does not necessarily reflect synesthetic behavior, since synes-thesia also requires a systematic mapping of inducers to concurrents. The aim of this section is to extend these findings in a more complex model containing a population of output units in each modality. In this scenario, each unit has the potential to represent a particular feature of the input and, therefore, it enables us to explore how features in one modality are mapped to features in the other modality. For instance, do monotonic mappings between features in differ-ent modalities emerge? Are they differ-entirely idiosyncratic? Under which conditions do the map-pings fluctuate or become stable? In synaesthesia, the mapmap-pings tend to be consistent within an individual. The mappings tend to differ across individuals but are not strictly random: for instance, synaesthetes tend to show monotonic relationships between pitch and luminance [15].
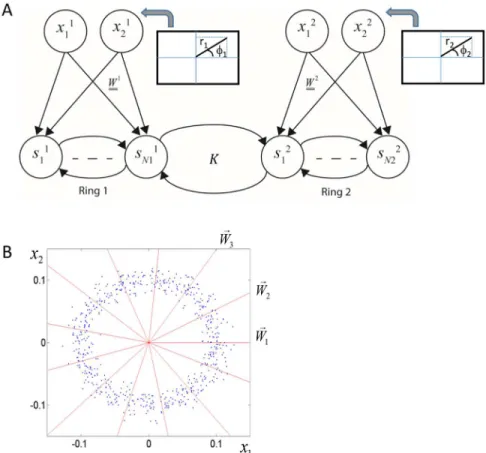
In this model, the input to each modality is two-dimensional characterized by an angle and a distance from the origin (Fig 5). The angle,φ, represents a one-dimensional perceptual space (e.g. the pitch of a sound, the luminance of a colour) and the distance from the origin, r, repre-sents intensity. The magnitudes, r, of the input samples were drawn from a normal distribution (with standard deviation proportional to the mean) and the angles were drawn from a uniform distribution (Fig 5B; blue dots). Altogether, there are four input-neurons, and the inputs to the two modalities are uncorrelated (Fig 5A). The network was presented with random inputs and the recurrent synaptic connections were updated according to the gradient-based learning rules.
The feed-forward connections were set to be unit vectors with different angles,θi, which spanned all possible angles from 0° to 360° (Fig 5B; red radial lines). Thus, the weighted input to each neuron in the output layer is:rcos(θi−φ). In this sense, the angleθican be referred to as thepreferred angleof thei'th neuron. An external stimulus at a given angleφelicits a 'hill' of activity around the neuron with the closest preferred angle. Each modality in this model is sim-ilar to a visual hypercolumn, the basic functional unit of the primary visual cortex, which con-tains a representation of all possible orientations. Analysis of the behaviour of a single hypercolumn network model with these properties and the same information maximization approach appears in [28]. Here, we analyse the case of two coupled networks of this type.
In the simulations, we explored the effect of the mean input magnitude and of the plasticity (learning rate). In this model, like in the simple network, the cross-talk connections were ini-tially set to near-zero. We assumed for simplicity that the level of plasticity is the same for all recurrent interactions in the network, and therefore used a single learning rate.
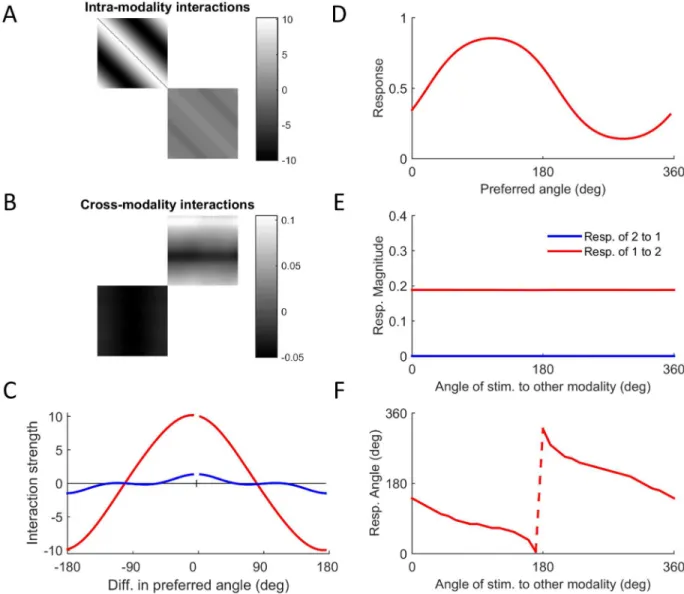
We also checked the existence of synesthetic behavior by directly stimulating one modality and testing the response of the other.Fig 6Dshows the response of modality 1 to stimulation of modality 2 at an angle of 30°. A compact representation of the response is provided by the magnitude and angle of thepopulation vector(Methods; [28]). The magnitude of the popula-tion vector of modality 1 in response to stimulapopula-tion of modality 2 at different angles is finite (Fig 6E, red). In contrast, the magnitude of the population vector of modality 2 in response to stimulation of modality 1 is effectively zero (Fig 6E, blue). The angle of the population vector of modality 1 in response to stimulation of modality 2 shows a clear systematic mapping (Fig 6F). The fact that the mapping is phase-shifted and decreasing is not important since the values are arbitrary, but the fact that there is a monotonic relationship at all is not trivial (given that no such mapping was present in the input)
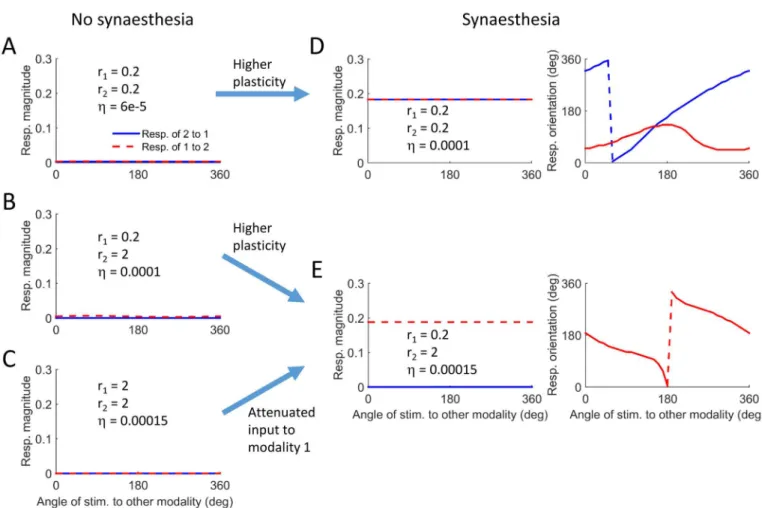
Fig 7summarizes the results from 5 simulations and demonstrates the different scenarios that can lead to the evolution of synaesthesia. The values of the input magnitudes and the level of plasticity appear inside each panel. The first 3 simulations (Fig 7A–7C) describe conditions
Fig 5. A network model for studying the evolution of synaesthetic mappings.A. Network architecture. The network is composed of two interacting modalities. Each modality receives a two-dimensional input characterized by an angle and a distance from the origin. This input is mapped into a high dimensional representation. There are recurrent connections among all the neurons in the output layer, namely within and between modalities. For clarity, only a few connections are shown. B. Feedforward connections and input distribution. The feedforward connections (red radial lines) are unit vectors with angles equally spaced from 0° to 360°. They are fixed throughout the learning. The input to each neuron is proportional to the projection of the input on the corresponding unit vector and has a cosine tuning around the corresponding angle, which represents its preferred feature. For clarity, the figure shows only a few lines, but in the numerical simulations we used 71 output neurons in each modality. The blue dots depict the input distribution to a single modality. The angles are uniformly distributed and the distance from the origin has a Gaussian distribution around a characteristic distance (0.1 in this example), which represents stimulus intensity.
under which no synaesthesia evolved, resulting in population vectors with zero magnitude. The simulation inFig 7Dhad the same input statistics as inFig 7A(r1= r2= 0.2), but a slightly higher level of plasticity. The magnitude of the population vectors is finite in both directions, reflecting a bi-directional synaesthesia (Fig 7D, left panel). This is not surprising as there was complete symmetry between the two modalities in terms of the input statistics. Nevertheless, the mapping from modality 1 to modality 2 is monotonic, whereas the mapping in the opposite direction is non-monotonic (Fig 7D, right panel). This reflects some arbitrary symmetry break-ing in the evolution of the cross-talk connection pattern. This may have been caused by small differences in the realization of the random inputs to the modalities. Naively, we would expect the network to be symmetrical, since the properties of both modalities are the same. However,
Fig 6. Evolution of synaesthetic mapping.The figure shows results from a simulation in which the network developed
synaesthesia where modality 2 is the inducer and modality 1 is the concurrent. The input to modality 1 wasr1= 0.2 and the input to modality 2 wasr2= 2. A. Pattern of intra-modality interactions. Note that the higher contrast image (top left) reflects the greater sensitivity of modality 1 to its own inputs. B. Pattern of cross-modality interactions. C. Interaction profiles within modality 1 (red) and within modality 2 (blue). D. Response of modality 1 to single stimulation of modality 2 at an angle of 30 deg. E. Magnitude of population vectors shows the synaesthesia to be unidirectional. F. Synaesthetic mapping from stimulation of modality 2 to response of modality 1 showing a shifted monotonic relationship. (The sharp jump is due to the periodicity of the angle).
this behavior shows that other extrema of the objective function may exist, extrema which do not preserve the symmetry between the modalities. The simulation inFig 7Eserves as another example of how high plasticity can lead to synaesthesia, when comparing it to the simulation in Fig 7B. Again both had the same input statistics but different plasticity levels. It also demon-strates how sensory deprivation can lead to synaesthesia when comparing it to the simulation inFig 7C. The simulations inFig 7C and 7Ehad the same learning rate, but the magnitude of the inputs to modality 1 was reduced in the simulation ofFig 7E, resulting in a clear monotonic mapping (Fig 7E, right panel).
The high-dimensional model produces synaesthesia-like behaviour in response to the same kinds of parameter changes identified in the simple model: namely an increase in learning rate (analogous to high plasticity) and if one modality becomes more or less sensitive to its direct input relative to the other (sensory deprivation/flooding). This model also enabled us to explore the relationship between the inducer and concurrent. Although there was no correlated input during learning, the relationship between the inducer and concurrent tended to be monotonic, as is found in many naturally occurring forms of synaesthesia. This is not a trivial outcome, and suggests that such mappings are an emergent property of this kind of neural architecture.
Fig 7. Different scenarios for the evolution of synaesthetic mapping in the model.A-C. Conditions on input statistics and learning rate for which no synaesthesia evolves. D-E. Conditions on input statistics and learning rate for which synaesthesia evolves. The arrows describe scenarios for the evolution of synaesthesia.
Discussion
For the last twenty years, theories of synaesthesia have been dominated by two general models: disinhibited feedback from multi-sensory regions to uni-sensory regions, and cross-talk theo-ries which have emphasised the presence of atypical (and direct) structural connectivity between modalities [33]. Whereas the former explanation has tended to be favoured for explaining acquired synaesthesia, the latter has dominated explanations of developmental syn-aesthesia. The approach taken in our computational model represents a significant departure from this current status quo, and has generated novel insights. Our model repositions synaes-thesia not as some quirk of aberrant connectivity but rather as a functional brain state that emerges, under certain conditions, as a consequence of optimising sensory information pro-cessing. In short, this model goes beyond others by offering an account not only of how synaes-thesia emerges but also of why synaessynaes-thesia emerges. It offers a unifying account of acquired and developmental forms of synaesthesia insofar as it explains how the same outcome can emerge under different conditions within the same model.
Acquired synaesthesia is often associated with sensory deprivation due to damage to the sensory organs or pathways. Our model proposes that the same learning process that optimizes information representation naturally causes neurons in the deprived modality to enhance incoming inputs from intact modalities, leading to synaesthesia. To provide some intuition, we note that our model maximizes the output entropy of the network, which depends on two fac-tors: one is the entropy of each single neuron, i.e. how variable the activity of single neurons is, and the other is the correlations among the neurons. Maximizing this entropy favours high sin-gle neuron entropy and low correlations among the neurons. The cross-talk connections induce correlations between the two modalities, which in general tend to reduce the output entropy. However, when one modality is deprived of input, it may be beneficial to have cross-talk connections from the intact modality to the deprived modality. The increase in the single neuron entropy due to the cross-talk connections can compensate for the higher correlations and result in a total increase of the output entropy. Loosely speaking, the deprived neurons seek for other neuronal sources of variability and enhance their connections with them. This mechanism, which emerges naturally in our computational framework, can also be useful for modelling the changes in neural representation that take place in other conditions such as phantom-limb [34].
partially correlated inputs to the two modalities to model childhood exposure to coloured ter sets (they are not fully correlated given that most literacy exposure is with achromatic let-ters). It may well be the case that there is an interaction between learning rate (an innate parameter within the synaesthete brain) and these partial associations (in the environment), which explains why most people do not go on to develop synaesthesia after exposure to these stimuli.
An interesting hypothesis that emerges from this study regards the relationship between synaesthesia and the concept of critical brain dynamics [28,42,43]. The goal of the learning process in our model is to find the pattern of recurrent interactions that maximizes the sensitiv-ity of the network to changes in its external inputs. In analogy to physical systems, in which the sensitivity (often termed susceptibility) to external inputs diverges near a critical point [44], here, as the network maximizes its sensitivity, it also tends to approach a critical point [28]. This critical point represents the border between normal amplification of external inputs and a regime governed by attractor dynamics. In the context of sensory processing, the super-critical attractor phase can be thought of as hallucinations that reflect the learned pattern of interac-tions. A useful measure for identifying critical dynamics is the time it takes the recurrent net-work to reach steady-state. When close to critical points, many dynamical systems display the phenomenon ofcritical slowing down[28,45]. Interestingly, in simulations of the complex model in which synaesthesia evolved, when the learning process approached the optimal pat-tern of interactions, the dynamics of the recurrent network became substantially slower (the number of iterations required to process each input sample until reaching steady-state was ~35000–45000 compared to ~1000–4000 in the beginning of the learning process). This obser-vation suggests that in the proposed model networks that developed synaesthesia operate closer to a critical point compared to networks that did not develop synaesthesia. The prediction is that there may be evidence of the neural signatures of critical dynamics in synaesthetes [46, 47], particularly as synaesthesia is developing.
non-computationally explicit account of synaesthesia in terms of predictive coding has been articulated [50]. Moreover, the kinds of learning algorithms employed in our model are com-patible with this approach [51].
The gradient-based learning rules used in this study are not local and are thus expected to reflect the long-term evolution of the system rather than mimicking the moment-by-moment dynamics of real neural circuits. In addition, the neurons in the model are described by simpli-fied rate dynamics which do not capture the complex dynamics of real neurons. An important direction for future modelling work would be the examination of more biologically realistic networks that also optimize information representation. The scenarios for the evolution of syn-aesthesia described in this study are very general and we believe that similar scenarios would appear also in more realistic networks.
In summary, these computational models permit new ways of thinking about synaesthesia both in terms of causal mechanisms and in terms of optimising perceptual function. It gener-ates non-trivial outcomes (e.g. generating monotonic mappings not found in the input charac-teristics) and non-trivial predictions (e.g. relating to learning, unimodal perceptual sensitivity, hallucinatory tendencies).
Materials and Methods
The full details of the network model and the derivation of the learning algorithm appear in [27]. Here we briefly review the main ingredients of the model. The numerical simulations were performed in MATLAB. Analytical results for the simple model appear inS1 Appendix.
General Network Architecture and Dynamics
The general architecture of the model is described inFig 1. It involves an input layer withN
neurons and an output layer withMneurons. We consider here only overcomplete representa-tions, in whichMN. In the simple modelM=N= 2, and in the more complex modelN= 4 andM= 142. The feedforward interactions are described by theM x NmatrixWand the recur-rent interactions by theM x MmatrixK. During the presentation of each input sample, the input componentsxiare fixed. The output neurons obey the following dynamics
tdsi
dt ¼ siþg
XN
j¼1 wijxjþ
XM
k¼1 kiksk
!
; i¼1;. . .;M:
wheregis some nonlinear squashing function andτis a characteristic time scale. The steady-state responses are given by
si¼g XN
j¼1 wijxjþ
XM
k¼1 kiksk
!
; i¼1;. . .;M:
Objective Function and Learning Algorithm
DK¼ Z@ε
@K¼ZhðwGÞ
T
þTasTi;
whereηis the learning rate, the matrixϕis given byϕ= (G−1−K)−1and satisfiesχ=ϕW, the
matrixGis defined asGij=g0iδij, the matrixΓis defined asΓ= (χTχ)−1χTϕand the
compo-nents of the vectoraare given byak¼ ½wGkk g@
k
ðg0kÞ3. The triangular brackets denote averaging
over the input samples.
During the learning process, the evolving networks can approach a critical point in their dynamics (seeDiscussion). In such cases, the objective function becomes very sensitive to changes in the pattern of interactions. In some cases the objective function may even increase rather than decrease. One way to avoid this is to gradually reduce the learning rate to very small magnitudes. However, to minimize the number of free parameters and make the inter-pretation clearer, we chose to leave the learning rate fixed across the learning process. Rather, we saved the interaction patterns in the course of the learning process and if a substantial increase in the objective function was identified, we simply chose the interaction pattern associ-ated with the minimal value of the objective function, namely the optimal pattern. To estimate the convergence time of the recurrent network and identify critical slowing down, we defined a criterion for stability of the neuronal activities and measured the time it takes the network to satisfy this criterion. A substantial increase in the convergence time suggests that the network operates close to a critical point. We indeed observed such substantial slowdown of the net-work dynamics, in particular in the simulations that developed synaesthesia when they approached the optimal pattern of interactions. As a consequence, the simulations could be very long (up to a couple of weeks on a standard PC station).
Supporting Information
S1 Appendix. Analytical derivation of the conditions for the evolution of cross-talk in the simple model.
(DOCX)
Author Contributions
References
1. Ward J. Synesthesia. Annual Review of Psychology. 2013; 64:49–75. doi: 10.1146/annurev-psych-113011-143840PMID:22747246
2. Simner J. Defining synaesthesia. British Journal of Psychology. 2012; 103:1–15. doi:10.1348/ 000712610X528305PMID:22229768
3. Grossenbacher PG, Lovelace CT. Mechanisms of synaesthesia: Cognitive and physiological con-straints. Trends in Cognitive Sciences. 2001; 5:36–41. PMID:11164734
4. Rouw R, Scholte HS, Colizoli O. Brain areas involved in synaesthesia: A review. Journal of Neuropsy-chology. 2011; 5:214–42. doi:10.1111/j.1748-6653.2011.02006.xPMID:21923787
5. Bargary G, Mitchell KJ. Synaesthesia and cortical connectivity. Trends in Neurosciences. 2008; 31:335–42. doi:10.1016/j.tins.2008.03.007PMID:18550184
6. Asher JE, Lamb JA, Brocklebank D, Cazier JB, Maestrini E, Addis L, et al. A Whole-Genome Scan and Fine-Mapping Linkage Study of Auditory-Visual Synesthesia Reveals Evidence of Linkage to Chromo-somes 2q24, 5q33, 6p12, and 12p12. American Journal of Human Genetics. 2009; 84(2):279–85. doi: 10.1016/j.ajhg.2009.01.012ISI:000263799700018. PMID:19200526
7. Barnett KJ, Finucane C, Asher JE, Bargary G, Corvin AP, Newell FN, et al. Familial patterns and the ori-gins of individual differences in synaesthesia. Cognition. 2008; 106:871–93. PMID:17586484
8. Baron-Cohen S, Harrison J, Goldstein LH, Wyke M. Coloured speech perception: Is synaesthesia what happens when modularity breaks down? Perception. 1993; 22:419–26. PMID:8378132
9. Ramachandran VS, Hubbard EM. Psychophysical investigations into the neural basis of synaesthesia. Proceedings of the Royal Society of London B. 2001; 268:979–83.
10. Simner J, Mulvenna C, Sagiv N, Tsakanikos E, Witherby SA, Fraser C, et al. Synaesthesia: The preva-lence of atypical cross-modal experiences. Perception. 2006; 35:1024–33. PMID:17076063
11. Sporns O, Chialvo DR, Kaiser M, Hilgetag CC. Organization, development and function of complex brain networks. Trends in Cognitive Sciences. 2004; 8:418–25. PMID:15350243
12. Rich AN, Bradshaw JL, Mattingley JB. A systematic, large-scale study of synaesthesia: Implications for the role of early experience in lexical-colour associations. Cognition. 2005; 98:53–84. PMID:16297676
13. Witthoft N, Winawer J, Eagleman DM. Prevalence of Learned Grapheme-Color Pairings in a Large Online Sample of Synesthetes. Plos One. 2015; 10(3). doi:10.1371/journal.pone.0118996
WOS:000350685900090.
14. Gray JA, Chopping S, Nunn J, Parslow D, Gregory L, Williams S, et al. Implications of synaesthesia for functionalism. Journal of Consciousness Studies. 2002; 9:5–31.
15. Ward J, Huckstep B, Tsakanikos E. Sound-colour synaesthesia: To what extent does it use cross-modal mechanisms common to us all? Cortex. 2006; 42:264–80. PMID:16683501
16. Ward J, Banissy MJ, Jonas CN. Haptic perception and synaesthesia. In: Grunwald M, editor. Handbook of Haptic Perception. Berlin: Springer-Verlag; 2008.
17. Cohen Kadosh R, Henik A, Walsh V. Small is bright and big is dark in synaesthesia. Current Biology. 2007; 18:R834–5.
18. Simner J, Lanz M, Jansari A, Noonan K, Glover L, Oakley DA, et al. Non-random associations of graph-emes to colours in synaesthetic and normal populations. Cognitive Neuropsychology. 2005; 22:1069–
85. doi:10.1080/02643290500200122PMID:21038290
19. Cohen Kadosh R, Sagiv N, Linden DEJ, Robertson LC, Elinger G, Henik A. Do colors influence numeri-cal cognition in synaesthesia? Journal of Cognitive Neuroscience. 2005; 17:1766–73.
20. Goller AI, Otten LJ, Ward J. Seeing sounds and hearing colors: An event-related potential study of audi-tory-visual synesthesia. Journal of Cognitive Neuroscience. 2009; 21:1869–81. doi:10.1162/jocn. 2009.21134PMID:18823243
21. Afra M, Funke M, Matsuo F. Acquired auditory-visual synesthesia: A window to early cross-modal sen-sory interactions. Psychology Research and Behavior Management. 2009; 2:31–7. PMID:22110319
22. Hartman AM, Hollister LE. Effect of mescaline, lysergic acid diethylamide and psilocybin on color per-ception. Psychopharmacolgia. 1963; 4:441–51.
23. Merabet LB, Hamilton R, Schlaug G, Swisher JD, Kiriakopoulos ET, Pitskel NB, et al. Rapid and Reversible Recruitment of Early Visual Cortex for Touch. Plos One. 2008; 3(8). doi:10.1371/journal. pone.0003046WOS:000264796400004.
24. Pascual-Leone A, Amedi A, Fregni F, Merabet LB. The plastic human brain cortex. Annual Review of Neuroscience. 2005; 28:377–401. PMID:16022601
32. Rothen N, Meier B, Ward J. Enhanced memory: Insights from Synaesthesia. Neuroscience and Biobe-havioral Review. 2012; 36(8):1952–63.
33. Hubbard EM, Ramachandran VS. Neurocognitive mechanisms of synesthesia. Neuron. 2005; 48:509–
20. PMID:16269367
34. Flor H, Nikolajsen L, Jensen TS. Phantom limb pain: a case of maladaptive CNS plasticity? Nature Reviews Neuroscience. 2006; 7(11):873–81. PMID:17053811
35. Asher JE, Lamb JA, Brocklebank D, Cazier J-B, Maestrini E, Addis L, et al. A whole-genome scan and fine-mapping linkage study of auditory-visual synesthesia reveals evidence of linkage to chromosomes 2q24, 5q33, 6p12, and 12p12. The American Journal of Human Genetics. 2009; 84(2):279–85. doi:10. 1016/j.ajhg.2009.01.012PMID:19200526
36. Banissy MJ, Muggleton N, Tester V, Janik AB, Davenport A, Franklin A, et al. Synaesthesia for color is linked to improved color perception, but reduced motion perception. Psychological Science. 2013; 24 (12):2390–7 doi:10.1177/0956797613492424PMID:24091549
37. Terhune DB, Murray E, Near J, Stagg CJ, Cowey A, Kadosh RC. Phosphene perception relates to visual cortex glutamate levels and covaries with atypical visuospatial awareness. Cereb Cortex. 2015: bhv015.
38. Terhune DB, Tai S, Cowey A, Popescu T, Kadosh RC. Enhanced cortical excitability in grapheme-color synesthesia and its modulation. Curr Biol. 2011; 21(23):2006–9. doi:10.1016/j.cub.2011.10.032PMID: 22100060
39. Watson MR, Akins KA, Spiker C, Crawford L, Enns JT. Synesthesia and learning: a critical review and novel theory. Frontiers in Human Neuroscience. 2014; 8. doi:10.3389/fnhum.2014.00098
WOS:000332148700002.
40. Yon D, Press C. Back to the future: synaesthesia could be due to associative learning. Frontiers in Psy-chology. 2014; 5. doi:10.3389/fpsyg.2014.00702WOS:000338795300001.
41. Parise CV, Knorre K, Ernst MO. Natural auditory scene statistics shapes human spatial hearing. Pro-ceedings of the National Academy of Sciences of the United States of America. 2014; 111(16):6104–8.
doi:10.1073/pnas.1322705111WOS:000334694000081. PMID:24711409
42. Schuster HG, Plenz D, Niebur E. Criticality in neural systems: John Wiley & Sons; 2014. 43. Shew WL, Plenz D. The functional benefits of criticality in the cortex. The neuroscientist. 2013; 19
(1):88–100. doi:10.1177/1073858412445487PMID:22627091
44. Stanley HE. Introduction to Phase Transitions and Critical Phenomena. Oxford1987.
45. Scheffer M, Bascompte J, Brock WA, Brovkin V, Carpenter SR, Dakos V, et al. Early-warning signals for critical transitions. Nature. 2009; 461:53–9. doi:10.1038/nature08227PMID:19727193
46. Shriki O, Alstott J, Carver F, Holroyd T, Henson RN, Smith ML, et al. Neuronal avalanches in the resting MEG of the human brain. Journal of Neuroscience. 2013; 33(16):7079–90. doi:10.1523/JNEUROSCI. 4286-12.2013PMID:23595765
47. Arviv O, Goldstein A, Shriki O. Near-Critical Dynamics in Stimulus-Evoked Activity of the Human Brain and Its Relation to Spontaneous Resting-State Activity. The Journal of Neuroscience. 2015; 35 (41):13927–42. doi:10.1523/JNEUROSCI.0477-15.2015PMID:26468194
49. van Leeuwen TM, den Ouden HEM, Hagoort P. Effective Connectivity Determines the Nature of Sub-jective Experience in Grapheme-Color Synesthesia. Journal of Neuroscience. 2011; 31(27):9879–84.
doi:10.1523/jneurosci.0569-11.2011WOS:000292524400011. PMID:21734279
50. Seth AK. A predictive processing theory of sensorimotor contingencies: Explaining the puzzle of per-ceptual presence and its absence in synesthesia. Cognitive Neuroscience. 2014; 5(2):97–118. doi:10. 1080/17588928.2013.877880WOS:000337242400004. PMID:24446823
51. Friston KJ, Kiebel S. Predictive coding under the free-energy principle. Philosophical Transactions of the Royal Society B-Biological Sciences. 2009; 364(1521):1211–21. doi:10.1098/rstb.2008.0300
WOS:000264662000005.