ACPD
8, 1239–1259, 2008Site contamination at an Arctic research
station
G. S. W. Hagler et al.
Title Page
Abstract Introduction
Conclusions References
Tables Figures
◭ ◮
◭ ◮
Back Close
Full Screen / Esc
Printer-friendly Version
Interactive Discussion
EGU
Atmos. Chem. Phys. Discuss., 8, 1239–1259, 2008 www.atmos-chem-phys-discuss.net/8/1239/2008/ © Author(s) 2008. This work is licensed
under a Creative Commons License.
Atmospheric Chemistry and Physics Discussions
Evaluating local anthropogenic impact on
remote Arctic monitoring stations: a case
study at Summit, Greenland
G. S. W. Hagler1, M. H. Bergin1,2, E. A. Smith1, M. Town3, and J. E. Dibb4
1
School of Civil and Environmental Engineering, Georgia Institute of Technology, Atlanta, GA 30332 USA
2
School of Earth and Atmospheric Sciences, Georgia Institute of Technology, Atlanta, GA 30332 USA
3
Department of Atmospheric Sciences, University of Washington, Box 351640, Seattle, WA 98195-1640 USA
4
Climate Change Research Center, Institute for the Study of Earth, Oceans, and Space, University of New Hampshire, Durham, NH 03824 USA
Received: 7 December 2007 – Accepted: 15 December 2007 – Published: 25 January 2008
ACPD
8, 1239–1259, 2008Site contamination at an Arctic research
station
G. S. W. Hagler et al.
Title Page
Abstract Introduction
Conclusions References
Tables Figures
◭ ◮
◭ ◮
Back Close
Full Screen / Esc
Printer-friendly Version
Interactive Discussion
EGU Abstract
Summit, Greenland is a remote Arctic research station allowing for field measurements at the highest point of the Greenland Ice Sheet. Due to the current reliance on diesel generators for electricity at Summit, unavoidable local emissions are a potential con-tamination threat to the measurement of combustion-related species in the air and
5
snow. The effect of fossil-fuel combustion on particulate elemental carbon (EC) is as-sessed by a combination of ambient measurements (∼1 km from the main camp), a
series of snow pits (up to 20 km from Summit Camp), and Gaussian plume modeling. Ambient measurements indicate that the air directly downwind of the research station generators experiences particulate absorption coefficient (closely related to EC) values
10
that are up to a factor of 200 higher than the summer 2006 non-camp-impacted ambient average. Local anthropogenic influence on snow EC content is also evident. The aver-age EC concentration in 1-m snow pits in the “clean air” sector of Summit Camp are a factor of 1.8–2.4 higher than in snow pits located 10 km and 20 km to the north (“down-wind”) and south (“up(“down-wind”) of the research site. Gaussian plume modeling performed
15
using meteorological data from years 2003–2006 suggests a strong angular depen-dence of anthropogenic impact, with highest risk to the northwest of Summit Camp and lowest to the southeast. Along a transect to the southeast (5 degree angle bin), the modeled frequency of significant camp contribution to atmospheric EC (i.e. camp-produced EC>2006 summer average EC) at a distance of 0.5 km, 10 km, and 20 km
20
is 1%, 0.2%, and 0.05%, respectively. According to both the snow pit and model re-sults, a distance exceeding 10 km towards the southeast is expected to minimize risk of contamination. These results also suggest that other remote Arctic monitoring sta-tions powered by local fuel combustion may need to account for local air and snow contamination in field sampling design and data interpretation.
ACPD
8, 1239–1259, 2008Site contamination at an Arctic research
station
G. S. W. Hagler et al.
Title Page
Abstract Introduction
Conclusions References
Tables Figures
◭ ◮
◭ ◮
Back Close
Full Screen / Esc
Printer-friendly Version
Interactive Discussion
EGU
1 Introduction
Since its inception in 1989, the United States National Science Foundation research station at the highest point of the Greenland Ice Sheet (elevation: 3200 m), “Summit Camp”, has been an extremely valuable research site. The immense effort placed into providing electricity, communications, and shelter at this remote location have paid
5
off in access to rare field measurements supporting numerous scientific disciplines (e.g. glaciology, atmospheric chemistry, and paleoclimatology). While many field mea-surements at Summit are naturally immune to post-1989 camp activity at Summit sta-tion (e.g. deep ice core studies), numerous research studies involve measurements that may be vulnerable to camp emissions such as atmospheric monitoring or
sam-10
pling of shallow snow pits. Impacts on the local environment by the Summit research site likely include a modification in nearby snow accumulation as camp structures alter natural drifting patterns, the introduction of foreign bacteria by visiting researchers and their related refuse, and the contamination of the local environment due to emissions from camp fossil fuel burning (camp generators, heavy equipment, snowmobiles, and
15
aircraft).
The focus of our research team’s effort at Summit Camp was to measure carbona-ceous particulate matter (organic and elemental carbon) in the air and snow. These species are of interest as markers of natural and anthropogenic emissions reaching the Greenland Ice Sheet (e.g. fossil fuel combustion and biomass burning), both in
am-20
bient sampling and as a paleorecord of previous source activity. While carbonaceous particulate species have been measured in several past field studies at Summit, no thorough investigation into the potential contamination from camp fossil fuel combus-tion has taken place. Although Summit Camp seeks to minimize human impacts on the pristine environment (e.g. sleeping in unheated tents during the summer season),
cur-25
ACPD
8, 1239–1259, 2008Site contamination at an Arctic research
station
G. S. W. Hagler et al.
Title Page
Abstract Introduction
Conclusions References
Tables Figures
◭ ◮
◭ ◮
Back Close
Full Screen / Esc
Printer-friendly Version
Interactive Discussion
EGU
loads. To protect the designated “clean air” sector located south of camp, staffand re-searchers cease vehicular use during northerly winds. However, the camp generators are in continuous use and intermittent (every 2–3 weeks during the spring to summer and every 2–3 months during late-summer to early-spring) supply aircraft arrivals occur regardless of wind direction. As these emitting sources could potentially contaminate
5
our atmospheric sampling for organic and elemental carbon, protective measures were integrated into our atmospheric sampling protocol during the field season (cessation of sampling during air traffic and ongoing sector control at all other times). In addition, given that elemental carbon (EC) is expected to be a stable tracer of local combustion emissions, six snow pits were sampled for EC and Gaussian plume modeling was
per-10
formed to better understand the footprint of camp contamination. While this study is focused primarily on carbonaceous species, this research is expected to be applicable to other atmospheric species of interest that may be impacted by camp emissions at Summit, Greenland.
2 Methods
15
Extensive sampling of the air and snow for particulate carbonaceous species took place at a research site located approximately 1 km from Summit, Greenland during the sum-mer of 2006. The field methods are described by Hagler et al. (2007a, b), so the sampling procedures will be only briefly discussed. Atmospheric sampling included near-real-time (minutes to hours) measurement of the aerosol absorption coefficient
20
(σap) using a Particle Soot Absorption Photometer (PSAP). Using a calculated mass absorption coefficient of 24 m2g−1(Hagler et al., 2007b),σ
ap was converted to an
esti-mated EC concentration.
In addition to the ongoing atmospheric sampling forσap, a sector control system was put in place to flag time periods when wind patterns created a potential contamination
25
(Camp-ACPD
8, 1239–1259, 2008Site contamination at an Arctic research
station
G. S. W. Hagler et al.
Title Page
Abstract Introduction
Conclusions References
Tables Figures
◭ ◮
◭ ◮
Back Close
Full Screen / Esc
Printer-friendly Version
Interactive Discussion
EGU
bell Scientific Inc., CR200 Datalogger), and two modified power strips that provided the capability to shut offtime-integrated atmospheric filter sampling. Under periods of stagnation (wind speed<0.5 m/s) or during northerly winds that may transport camp emissions to our southerly research site, the sector control system would shut off inte-grated samples and assign a “flag” variable the value of 0 (flag=1 during “on” periods).
5
The sector control program ran and reacted every 10 minutes (a compromise between the need for a short response time and the desire to minimize the cycling off/on of sampling pumps).
The potential impact of Summit camp on snow-phase EC was investigated through a series of six 1-m snow pits that were dug and sampled over a two-week period in
10
the month of July. Two snow pits were co-located in the “clean air” region of Summit, a region to the south of the camp that has additional protection of reduced camp vehicular emissions during northerly winds. The remaining four snow pits were located at 10 and 20 km to the north and south of Summit. Each snow pit was sampled at 20 cm increments (5 total layers) for particulate elemental and organic carbon (Hagler et al.,
15
2007a). Duplicates were sampled at two layers in each snow pit.
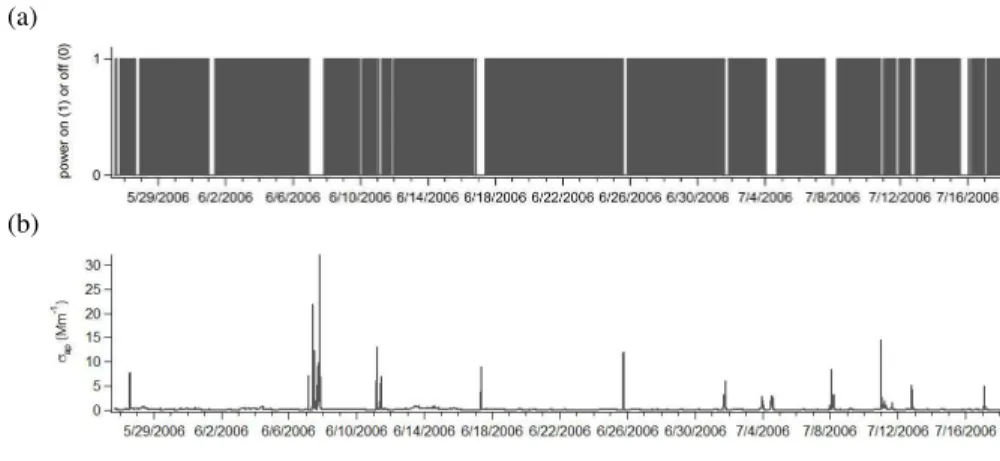
To better understand the impact of Summit camp activity on the local atmosphere and to interpret our snow pit samples, a Gaussian plume model was applied to estimate the regional footprint of Summit camp contamination. The camp emission rate of EC was estimated by assessing concentration spikes inσap that occurred throughout the
sum-20
mer, ranging∼2–30 Mm−1(compared with the summertime average of 0.15 Mm−1). A
moderate spike of 14.5 Mm−1that occurred on 10 July was selected as a “best guess”
for its mid-range concentration and the absence of flight traffic on that day, with the source emission rate calculated assuming this was a centerline plume concentration hitting the satellite ambient sampling station located 1 km from camp. The measured
25
σap was converted to an EC concentration using a previously calculated mass absorp-tion efficiency coefficient of 24 m2g−1(Hagler et al, 2007b), and a camp emission rate
ACPD
8, 1239–1259, 2008Site contamination at an Arctic research
station
G. S. W. Hagler et al.
Title Page
Abstract Introduction
Conclusions References
Tables Figures
◭ ◮
◭ ◮
Back Close
Full Screen / Esc
Printer-friendly Version
Interactive Discussion
EGU
reflection using Eq. (1)–(4).
C(x,0,0)= Q
π uσyσz exp "
−H
2
2σz2 #
(1)
Where:x=1 (km)
T H=0.01745(18.3330−(1.8096) ln(x)) (2)
σy =465.11628(x) tan(T H) (3)
5
σz =453.85(x)2.1166 (4)
Equations for the dispersion coefficients, σy and σz, are from the U.S. EPA Industrial Source Complex (ISC3) Dispersion Models (U.S. EPA OAQPS, 1995) for the Pasquill Stability Category B (moderate wind speed, daytime conditions). Assuming ground-level emissions (H=0) and inputting the measured wind velocity (u) at the time of the
10
spike, Q was estimated to be 8.64×10⁷ng s−1. Keeping the emissions rate and the
stability category (B) constant, the Gaussian plume model was calculated over the past four years (2003–2006) using available meteorology data collected by ETH Zurich (hourly 1-m wind speed and direction at Summit Camp) and binning wind angles into 15 degree increments. Given that the wind sensors performed poorly during extremely low
15
temperatures (T <−35◦C), only limited meteorology data was available during the winter
season of each year. For each meteorology data point, the camp plume’s centerline concentration was calculated at distances (x) from Summit ranging up to 30 km, at 0.5 km increments. For the remainder of the compass angle bins that did not have a plume from camp at that time instance, the concentration value was set to 0. Final
20
ACPD
8, 1239–1259, 2008Site contamination at an Arctic research
station
G. S. W. Hagler et al.
Title Page
Abstract Introduction
Conclusions References
Tables Figures
◭ ◮
◭ ◮
Back Close
Full Screen / Esc
Printer-friendly Version
Interactive Discussion
EGU
3 Results and discussion
3.1 Absorption coefficient and sector control
Throughout the field campaign at Summit, Greenland in the summer of 2006, the need for a sector control system to protect multi-day integrated samples was readily appar-ent. Sampling time periods flagged for contamination concern were often associated
5
with brief extreme spikes in the absorption coefficient, reaching up to 30 Mm−1, a
fac-tor of 200 higher than the summertime average of 0.15 Mm−1 (Fig. 1). Additionally,
it appears that the sector control wind speed and direction parameters selected were effective, with every major concentration spike coinciding with a “flag/shut-off” time period (Fig. 1). Thus, it is expected that previously reported filter measurements for
10
carbonaceous particulate matter (Hagler et al., 2007b) are free from any major camp contamination.
Altogether, sector control flagged 21% of the sampling time during 26 May–18 July 2006. During this time period, the majority of the shut-down time was due to wind direction rather than wind speed as stagnant conditions (wind speed<0.5 m s−1) were 15
rare (<5% of the summer). Using the available wind data for years 2003–2006 (Fig. 2), it can be seen that wind directions are generally dominated by southerly and moderate-speed winds. Applying the same sector control criteria over this longer period of time, wind direction (>288 or <45 degrees) and low wind speed would lead to an approxi-mate 15% and 4% shut-offtime, respectively. Together, the sector control parameters
20
applied to 2003–2006 would have induced a total 19% loss in sampling time, similar to our summer 2006 experience. Therefore, the long-term use of a sector-control sys-tem to support sampling atmospheric species that may be contaminated by Summit camp emissions is expected to result in a∼20% loss of sampling time. Given that the
wind angle criteria used to “flag” time periods is very conservative and that research
25
ACPD
8, 1239–1259, 2008Site contamination at an Arctic research
station
G. S. W. Hagler et al.
Title Page
Abstract Introduction
Conclusions References
Tables Figures
◭ ◮
◭ ◮
Back Close
Full Screen / Esc
Printer-friendly Version
Interactive Discussion
EGU
constituting 1.6% of the total sampling period (Fig. 1). This demonstrates that a higher precision sector control system would likely cause only minor interruptions in ambient sampling.
3.2 Snow pits
While it seems to be feasible to avoid camp contamination in atmospheric samples by
5
adding in a sector control system, there is unfortunately no similar method available to prevent the deposition of camp emissions to surface snow. To minimize snow contam-ination, camp staffmembers eliminate all vehicular emissions during northerly winds. However, the camp electricity depends on continuous use of diesel generators. In ad-dition, supply flights to the research site take place independent of wind direction. It
10
is of concern that these emissions may impact measurements made of carbonaceous particulate matter in post-1989 snow.
To evaluate the footprint of Summit Camp emissions on surrounding snow, a series of 1-m snow pits were dug and sampled in the clean air sector of Summit and at distances up to 20 km north and south of camp (Table 1). Assessing the snow pit profiles, the
15
two co-located snow pits near Summit Camp appear to be at a generally higher EC concentration than those located at 10 km or further from camp (Fig. 3). Given the coarseness of sampling (20 cm increments) and the difficulty in precisely collecting identical snow layers across multiple pits, a more clear way to compare the snow pit concentrations is to average over the entire depth sampled. In terms of the average
20
EC concentration per pit, a marked difference between the Summit Camp snow pits and those at remote sites is observed (Fig. 4). The average EC concentration of the Summit Camp pits (0.53µg kg−1 snow) is a factor of 1.8–2.4 higher than EC levels
in snow sampled at 10 and 20 km away from camp. One possible explanation of the higher EC measured near Summit Camp is a difference in snow accumulation rates
25
ACPD
8, 1239–1259, 2008Site contamination at an Arctic research
station
G. S. W. Hagler et al.
Title Page
Abstract Introduction
Conclusions References
Tables Figures
◭ ◮
◭ ◮
Back Close
Full Screen / Esc
Printer-friendly Version
Interactive Discussion
EGU
higher EC loading found closer to Summit suggests that future snow pit sampling for species believed to also have camp sources, or secondarily affected by camp pollution, should be performed at some distance from Summit. As snow pits at 20 km are at a similar EC concentration to those at 10 km, it appears that the footprint of Summit is confined to within 10 km. In addition, the snow pits north of Summit camp (average
5
EC of 0.28µg kg−1) are not substantially higher than those to the south (average EC of
0.26µg kg−1), suggesting that the increased camp activity during southerly winds does
not translate to long-distance impacts on snow concentrations.
Given the difference in camp vs. distant (10 or 20 km) snow pits, one conclusion is that our reported carbonaceous snow concentrations in the clean air sector of camp
10
(Hagler et al., 2007a, b) may have an upward bias. However, it is difficult at this point to determine whether this is an appropriate conclusion, as the impact of camp on snow in the “clean air” sector is likely dependent on the co-occurrence of precipitation and wind direction from camp, as well as on wind speed and surface snow history. Our atmospheric sampling results indicate that camp contamination is highly variable. As
15
seen in the sector control observations, there are a number of periods flagged for camp contamination that did not experience spikes inσap; and, when spikes did occur, they were not at a consistent concentration (Fig. 1). The observed variability inσap during flagged time periods is likely due to a number of factors, including plume dispersion un-der changing atmospheric conditions, wind direction relative to our ambient monitoring
20
site, and variable source emission rates (e.g. supply aircraft traffic). 3.3 Gaussian plume modeling
To further understand the air sampling and snow pit results, we estimated the transport of Summit camp plumes to the surrounding snow using a Gaussian plume model. This model was selected because the Summit camp diesel generators are co-located
25
ACPD
8, 1239–1259, 2008Site contamination at an Arctic research
station
G. S. W. Hagler et al.
Title Page
Abstract Introduction
Conclusions References
Tables Figures
◭ ◮
◭ ◮
Back Close
Full Screen / Esc
Printer-friendly Version
Interactive Discussion
EGU
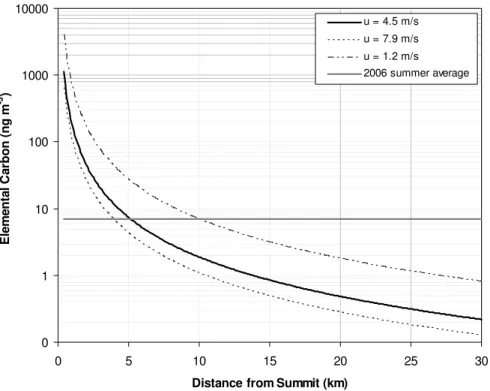
distance and direction from camp. Looking at the worst case scenario of a centerline plume concentration, it can be seen that for the typical range of wind speeds very high EC concentrations (>1000 ng m−3) are estimated within close proximity to camp,
dropping rapidly within the first few kilometers of distance (Fig. 5). Using the sector-controlled summer 2006 average concentration of EC of 7 ng m−3(Hagler et al., 2007b) 5
as a reference point, it can be seen that for the average wind speed camp contribution to ambient EC falls below the 2006 average at 5 km from camp, or to 10% of the 2006 average at approximately 16.5 km. However, for lower (higher) speed winds, it can be seen that the lesser (greater) dispersion leads to a slower (faster) decline in EC concentrations and a need to travel ∼30 km (12.5 km) to reach the 10% contribution 10
level.
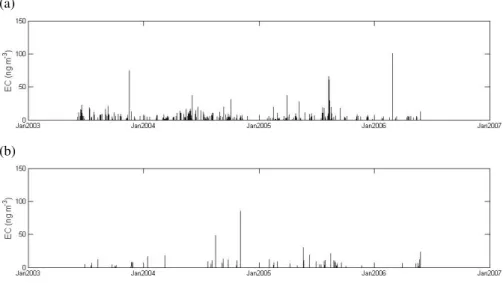
While camp plumes can pose a major contamination threat if directly passing over a sampling area, it is important to keep in mind the relative frequency of camp impact in any one direction. At 10 km in the northwest direction of camp, prevailing winds lead to frequent concentration spikes over years 2003–2006 (Fig. 6a). In the opposite
15
direction, model results show that camp-related concentration spikes are still evident but far fewer in number (Fig. 6b). As snow contamination for particulate species are mainly controlled by the occurrence of wet deposition events (Bergin et al., 1995), not all atmospheric concentration spikes are expected to translate to snow contamination. However, a greater frequency of camp plumes traveling in a certain direction certainly
20
increases the risk of sample contamination.
In order to determine “safe” distances and angles for future field work near Summit, the frequency of major camp plume events (i.e. camp contribution exceeding 2006 av-erage EC concentrations) is modeled over all angles and at distances up to 30 km from camp (Fig. 7). It appears that the highest risk of significant camp impact (3% of the
25
time for a given 5 degree angle bin) occurs at a close proximity to camp (0.5 km) in the northwest to north direction of camp. Meanwhile, the southeast direction receives significant camp impact at 0.5 km only ∼0.5% of the time over a given 5 degree
ACPD
8, 1239–1259, 2008Site contamination at an Arctic research
station
G. S. W. Hagler et al.
Title Page
Abstract Introduction
Conclusions References
Tables Figures
◭ ◮
◭ ◮
Back Close
Full Screen / Esc
Printer-friendly Version
Interactive Discussion
EGU
all directions from camp. At 10 km and 20 km from camp, the maximum (minimum) frequency of significant camp impact reduces to about 1% (0.2%) and 0.2% (0.05%) of the time, respectively. Although there are a number of assumptions influencing the Gaussian plume model estimates, it is interesting that the model results are in a similar range of the summer 2006 observed frequency of camp-relatedσap spikes (1.6%) at
5
∼1 km southwest of Summit Camp. In interpreting the model results, it is important
to point out that the estimated impact of camp contamination depends not only on the camp emission rate but also the typical ambient concentration of the species of interest. Also, it should be noted that the model does not take into account the increased camp activity during southerly winds, which may lead to more highly concentrated plumes
10
transported northward.
In general, it appears that the Gaussian modeling supports the insignificant diff er-ence in average EC concentrations between snow pits located at 10 km vs. 20 km and North vs. South. Since the frequency of significant camp contamination is already re-duced to<1% of the time per 5 degree angle bin over all directions (Fig. 7), the distance
15
1-m snow pits (equal to∼1 year of snowfall) likely avoided a major camp plume event.
The model also indicates that snow contamination at 1 km distance even in the “clean air sector” south of camp is more likely than any point>10 km away given the more highly concentrated plumes close to camp.
4 Conclusions
20
In all remote and pristine sampling environments, the impact of research site activities on the local environment needs to be taken into consideration to ensure the accuracy of field measurements. At Summit, Greenland, it appears that camp emissions can greatly impact nearby EC concentrations in the air and snow. Extreme and short-term spikes in the absorption coefficient occurred numerous times throughout the summer
25
ACPD
8, 1239–1259, 2008Site contamination at an Arctic research
station
G. S. W. Hagler et al.
Title Page
Abstract Introduction
Conclusions References
Tables Figures
◭ ◮
◭ ◮
Back Close
Full Screen / Esc
Printer-friendly Version
Interactive Discussion
EGU
control system would be a successful means of avoiding camp combustion-related pollution. While longer-term sampling may have a reduction in sampling time by∼20% (conservative estimate), loss in sample time for shorter field studies will heavily depend on wind patterns and thus may have a considerably higher or lower fraction of down-time compared to the long-term estimate.
5
In terms of snow sampling, Gaussian plume modeling and snow pit results point to a distance of approximately 10 km towards the SE as a good “rule of thumb” to minimize risk of camp impact (0.2% frequency of significant camp plume events). To translate this result to other species potentially impacted by camp generator emissions (e.g. specific organic molecules, isotopes of carbon or nitrogen, sulfate), one needs to
10
consider the generator emission rate of a particular species relative to its expected am-bient background concentration. Given a lower generator emission rate and/or higher background concentration compared to EC, the “safe” distance may be closer to Sum-mit camp; and, the converse would be true given a higher emission rate and/or lower background concentrations.
15
While integrating sector control systems into atmospheric studies and traveling far distances to perform snow sampling can improve the quality of field sampling at Sum-mit, a reduction in camp emissions would be a second (and preferable) means to re-duce the anthropogenic footprint at such a remote location. A greater reliance on non-emitting power sources (e.g. wind or solar) may be potential technologies to consider,
20
as well as improved energy efficiency in camp structures and fuel-powered vehicles.
Acknowledgements. The authors are grateful for the field support and detailed information on camp power generation from Veco Polar Resources. We thank the New York Air National Guard 109th Airlift Wing for transport of goods and personnel to Summit, Greenland. Financial sup-port for this research came from the National Science Foundation and graduate fellowships to 25
ACPD
8, 1239–1259, 2008Site contamination at an Arctic research
station
G. S. W. Hagler et al.
Title Page
Abstract Introduction
Conclusions References
Tables Figures
◭ ◮
◭ ◮
Back Close
Full Screen / Esc
Printer-friendly Version
Interactive Discussion
EGU References
Bergin, M. H., Jaffrezo, J.-L., Davidson, C. I., Dibb, J. E., Pandis, S. N., Hillamo, R., Maen-haut, W., Kuhns, H. D., Makela, T.: The contributions of snow, fog, and dry deposition to the summer flux of anions and cations at Summit, Greenland, J. Geophys. Res., 100(D8), 16 275–16 288, doi:10.1029/95JD01267, 1995.
5
Dibb, J. E. and Fahnestock, M.: Snow accumulation, surface height change, and firn densifi-cation at Summit, Greenland: Insights from 2 years of in situ observation, J. Geophys. Res., 109, D24113, doi:10.1029/2003JD004300, 2004.
Hagler, G. S. W., Bergin, M. H., Smith, E. A., Dibb, J. E., Anderson, C., and Steig, E. J.: Partic-ulate and water-soluble carbon measured in recent snow at Summit, Greenland, Geophys. 10
Res. Lett., 34, L16505, doi:10.1029/2007GL030110, 2007a.
Hagler G. S. W., Bergin, M. H., Smith, E. A., and Dibb, J. E.: A summer time series of par-ticulate carbon in the air and snow at Summit, Greenland, J. Geophys. Res., 112, D21309, doi:10.1029/2007JD008993, 2007b.
U.S. EPA OAQPS: User’s Guide for the Industrial Source Complex (ISC3) Dipersion Models, 15
ACPD
8, 1239–1259, 2008Site contamination at an Arctic research
station
G. S. W. Hagler et al.
Title Page
Abstract Introduction
Conclusions References
Tables Figures
◭ ◮
◭ ◮
Back Close
Full Screen / Esc
Printer-friendly Version
Interactive Discussion
EGU Table 1.1-m snow pit locations near Summit, Greenland.
Snow pit description Date sampled Coordinates
20 km North of Summit 26 June 2006 N72◦ 44′, W38◦ 12′
10 km North of Summit 25 June 2006 N72◦ 40′, W38◦ 26′
Summit Camp I, in clean air sector 20 June 2006 N72◦ 34′, W38◦ 27′
Summit Camp II, in clean air sector 22 June 2006 N72◦ 34′, W38◦ 27′
10 km South of Summit 29 June 2006 N72◦ 30′, W38◦ 40′
ACPD
8, 1239–1259, 2008Site contamination at an Arctic research
station
G. S. W. Hagler et al.
Title Page
Abstract Introduction
Conclusions References
Tables Figures
◭ ◮
◭ ◮
Back Close
Full Screen / Esc
Printer-friendly Version
Interactive Discussion
EGU (a)
(b)
ACPD
8, 1239–1259, 2008Site contamination at an Arctic research
station
G. S. W. Hagler et al.
Title Page
Abstract Introduction
Conclusions References
Tables Figures
◭ ◮
◭ ◮
Back Close
Full Screen / Esc
Printer-friendly Version
Interactive Discussion
EGU Fig. 2.Wind direction and speed during years 2003–2006. Data represents approximately 2/3
ACPD
8, 1239–1259, 2008Site contamination at an Arctic research
station
G. S. W. Hagler et al.
Title Page
Abstract Introduction
Conclusions References
Tables Figures
◭ ◮
◭ ◮
Back Close
Full Screen / Esc
Printer-friendly Version
Interactive Discussion
EGU Fig. 3.Snow phase elemental carbon concentration in 1-m snow pits near and far from Summit,
ACPD
8, 1239–1259, 2008Site contamination at an Arctic research
station
G. S. W. Hagler et al.
Title Page
Abstract Introduction
Conclusions References
Tables Figures
◭ ◮
◭ ◮
Back Close
Full Screen / Esc
Printer-friendly Version
Interactive Discussion
ACPD
8, 1239–1259, 2008Site contamination at an Arctic research
station
G. S. W. Hagler et al.
Title Page
Abstract Introduction
Conclusions References
Tables Figures
◭ ◮
◭ ◮
Back Close
Full Screen / Esc
Printer-friendly Version
Interactive Discussion
EGU
0 1 10 100 1000 10000
0 5 10 15 20 25 30
Distance from Summit (km)
E
le
m
e
n
ta
l C
a
rb
on (
ng m
-3 )
u = 4.5 m/s u = 7.9 m/s
u = 1.2 m/s
2006 summer average
ACPD
8, 1239–1259, 2008Site contamination at an Arctic research
station
G. S. W. Hagler et al.
Title Page
Abstract Introduction
Conclusions References
Tables Figures
◭ ◮
◭ ◮
Back Close
Full Screen / Esc
Printer-friendly Version
Interactive Discussion
EGU
(a)
(b)
ACPD
8, 1239–1259, 2008Site contamination at an Arctic research
station
G. S. W. Hagler et al.
Title Page
Abstract Introduction
Conclusions References
Tables Figures
◭ ◮
◭ ◮
Back Close
Full Screen / Esc
Printer-friendly Version
Interactive Discussion
EGU Fig. 7. Estimated fraction of time (%) that camp contribution at a specific angle and distance