ISSN 1517-7076 artigo e11863, 2017
Autor Responsável: Thayara Ceregatti Data de envio: 08/09/2016 Data de aceite: 06/03/2017
10.1590/S1517-707620170003.0197
Electrical and thermal properties of
PLA/CNT composite films
Thayara Ceregatti 1, Paloma Pecharki 1, Wagner M. Pachekoski2 Daniela Becker1 ,Carla Dalmolin1*
1
Centro de Ciências Tecnológicas – CCT, Universidade do Estado de Santa Catarina - UDESC e-mail: [email protected]
[email protected]; [email protected]; [email protected]; 2
Centro Joinville, Universidade Federal de Santa Catarina - UFSC e-mail: [email protected]
ABSTRACT
Conducting polymers presents many potential applications such as biosensors and biofuelcells. However, to be used in those devices, a thin film must be deposited onto a conducting and biocompatible substrate. In this work, carbon nanotubes (CNT) were mixed in a poly (lactic acid) – PLA – matrix with different composi-tions (from 0.25 to 5.0 %) in order to form conducting composites suitable to the deposition of a conducting polymer. Thermal properties of PLA/CNT composites were evaluated by Thermogravimetry (TG) and Dif-ferenctial Scanning Calorimetry (DSC), and the electrical properties were evaluated by 2-probe method and by Electrochemical Impedance Spectroscopy (EIS). Thermal analysis showed and influence of CNT quanti-ties on PLA crystallization, which also showed an influence on conductivity of the tested materials. Besides, the conductivity of PLA/NTC 1% film showed similar values of the conducting polymer (Pani) itself. Keywords: poly (lactic acid), carbon nanotubes, electrical properties, conducting polymers.
1. INTRODUCTION
Polyaniline (Pani) is a conducting polymer largely studied for applications such as biosensors, supercapaci-tors, organic cells, etc., due to their reversible oxidation/reduction reactions, high theoretical capacity and the possibility to prepare thin and flexible films [1]. For all those applications, a thin film must be deposited onto a conducting substrate. On the other hand, deposition of Pani onto a biomaterial is interesting for its use in biosensors and biofuel cells. In this case, substrate must be a biocompatible material with good mechanical properties to support the conducting polymer film and, also, some conductivity is necessary in order to guar-antee the electrical contact for redox reactions. Several composites have been proposed as substrates to im-prove Pani performance and mechanical properties. However, conducting composites of biodegradable, bio-compatible polymer and carbon nanotube seems to be the most attractive for a polyaniline-based biosensor [2].
Poly (lactic acid) – PLA – is a biodegradable polymer synthesized from renewable resources through bioconversion and polymerization, known for its ease processability and it is already commercially available. PLA based composites are receiving more attention, such as the investigation of the morphological and elec-trical properties of different PLA based polymer composites. But then, carbon nanotubes (CNTs) have gained main interest as nanofillers due to their high electric and thermal conductivity. Taking advantage of their electrical conductivity, some authors have attempted using CNTs to elaborate conductive PLA-based nano-composites [3]. Low percolation thresholds have been achieved, corresponding to the formation of a conduc-tive network structure within the PLA, by establishing a relation between the aspect ratio of carbon nano-tubes and the formation of percolating networks in PLA/CNT nanocomposites in terms of rheology, electrical conductivity and mechanical properties. The final properties of those PLA composites not only depend on the filler dispersion and concentration, but also on dimensional structure of particles themselves [4,5].
polymerization of aniline, and its adherence and electrochemical properties were evaluated.
2. MATERIALS AND METHODS
Multiwall carbon nanotubes, named as CNT, were provided by Chengdu Organic Chemicals Co. and charac-terized in previous works [6]. Poly(lactic acid) – PLA – (Ingeo 3251D) was provided by the company Na-tureWorks®; and Aniline (VETEC) was distilled under vacuum prior to use. All other chemicals were rea-gent grade and used as received.
PLA/CNT nanocomposites samples were produced with different filler contents: 0.25%; 0.50%; 0.75%; 1.0%; 2.0% and 5.0% (m/m).The melt mixing process was performed in a Haake torque rheometer with a 50 cm3 mixing chamber and standard rotors, operated at 120°C and 50 rpm for 10 minutes. The nano-composites were compressed and molded using a hydraulic press at 120°C for 5 minutes by applying a pres-sure of 16 MPa and cooled with water to room temperature to produce films with thickness of 0.30 0.02 mm.
Polyaniline was synthetized by oxidative polymerization of aniline (VETEC, distilled under reduced pressure) carried out in a 0.5 M aqueous solution of H2SO4 and 0.2 M of ammonium persulfate – (NH4)2S2O8
– (VETEC), while the reaction temperature was kept at 0∼5 °C using an ice water bath, and the reaction time was fixed at 5 h [7]. The resulting PANI powder were dried in for 24 h after being washed with deionized water and used for conductivity tests in order to compare with results for PLA/CNT films.
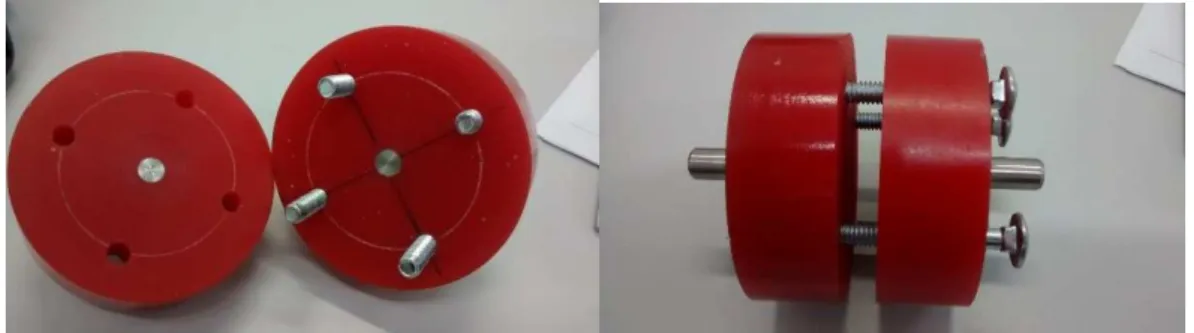
The melting and crystallization temperature and crystallinity degree were obtained by differential scanning calorimetry (DSC), in a Netzsch DSC 200 F3device. The samples were heated from 25°C to 200°C at a rate of 10°C/mim, held at that temperature for 2min, then air cooled to -10°C (cooling rate of 80°C/mim) before second heating scan from -10°C to 200°C at 10°C/mim (under nitrogen atmosphere). All the thermal parameters were determined from second heating scans. The crystallinity degree (Xc) was determined as show in Garlotta [8]. The weight loss was obtained by thermogravimetric analysis (TG), in a Netzsch STA 449 C device with a heating rate of 10 °C/min from 25 °C to 600 °C (under nitrogen atmosphere). A Jeol JSM-6710F Field emission electron microscope was used for morphological studied. The samples were frac-tured under liquid nitrogen and the surfaces were coated with gold to avoid charge by the electron beam. Room temperature DC conductivity measurements were performed using a two-probe method. AC conduc-tivity was also measured by Electrochemical Impedance Spectroscopy using an AUTOLAB PGSTAT20 po-tentiostat / galvanostat with a frequency analyzer (FRA). The blocking electrode method was used, where a thin film was inserted between two stainless steel electrodes at open circuit potential, as shown in Figure 1. A DC perturbation of 10 mV (r.m.s.) was applied in the frequency range of 1 Hz to 10 kHz. The specific con-ductance (conductivity) was calculated by normalizing the concon-ductance with the contact area of the elec-trodes (S = 3,14 cm2) and sample thickness (l = 0.30 mm).
Figure 1: Electrochemical cell built for EIS and two-probe measurements. Sample is centered in contact with stainless
steal electroctes (at left) and when the cell is closed (at right), working and reference terminals are plugged on both steal connectors.
3. RESULTS AND DISCUSSION
3.1 Morphology
Figure 2 shows FEG micrographs for PLA/CNT nanocomposites. The quantity of CNT increases proportion-ally to the nanocomposites composition, and samples presented a homogenous morphology, with apparent good distribution and small carbon nanotubes agglomerates.
(a)
(b)
(c)
(d)
(e)
(f)
Figure 2: FEG micrographs at 1000x of PLA/CNT varying CNT concentration. (a) 0.25%; (b) 0.50%; (c) 0.75%; (d)
1.0%; (e) 2.0% and (f) 5.0%.
3.2 Thermal Characterization
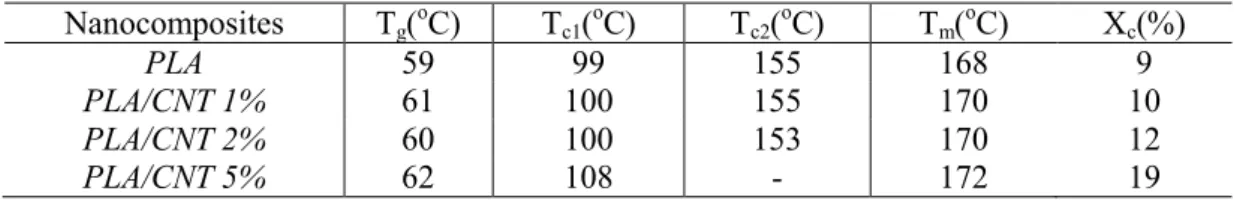
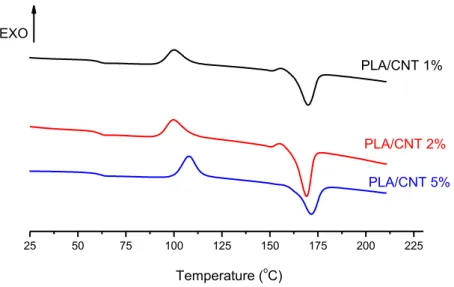
Figure 3 shows DSC results for PLA/CNT composites with higher CNT compositions (1.0%, 2.0% and 5.0%), when main differences are better visualized. Thermal properties, including crystallinity, glass transi-tion temperatures (Tg), crystallizatransi-tion and melting temperatures (Tc1, Tc2 and Tm) are quantified in Table 1 and compared with neat PLA, already studied in our group[9].
Table 1: Thermal properties measured by DSC for neat PLA and PLA nanocomposites.
Nanocomposites
T
g(
oC)
T
c1(
oC)
T
c2(
oC)
T
m(
oC)
X
c(%)
PLA
59
99
155
168
9
PLA/CNT 1%
61
100
155
170
10
PLA/CNT 2%
60
100
153
170
12
PLA/CNT 5%
62
108
-
172
19
No significant modifications where observed in the Tg and Tm of PLA with the carbon nanotube addi-tion. On the other hand, CNT contend showed an influence in crystallization, especially in the PLA/CNT 5% composition. PLA presents two crystallization temperatures, the second one right before Tm, assigned as recrystallization of imperfect crystals to more perfect ones [10]. This behavior was also observed for compo-sitions with 1% and 2% of CNT. Nevertheless, when a higher quantity of nanofiller was added (5%), second
Tc disappear, indicating that polymer matrix doesn’t have enough mobility to recrystallization into the wider
25 50 75 100 125 150 175 200 225
Temperature (oC)
PLA/CNT 1%
PLA/CNT 2%
PLA/CNT 5% EXO
Figure 3: DSC profiles for PLA/CNT nanocomposites with 1.0%, 2.0% and 5% compositions.
Also, crystallization degree of PLA increases with the CNT content in the nanocomposites. Higher concentration of nanofiller could mean a higher concentration of nucleating agent, which promotes higher quantities of cristallyzation nuclei and increasing the crystallization degree. In other words, DSC profiles of the nanocomposites indicates that CNT is acting as a nucleating agent for PLA matrix.
Figure 4 presents the onset degradation temperature (Tonset) obtained by thermogravimetric analyses. There is an increase on degradation temperature when neat PLA and PLA/CNT nanocomposites are com-pared, but no relation could be established with CNT concentration in the three studied compositions. An increase in the thermal stability of PLA is expected in PLA/CNT nanocomposites when CNT dispersion and distribution in the polymeric matrix can build an interconnected structure that provides a thermally conduc-tive path, responsible for an interfacial thermal resistance and energy dispersion [11].
0 1 2 5
330 340 350
T
on
se
t
(
o
C)
338 oC
344 oC
345 oC
347 oC
CNT %
Figure 4: Onset degradation temperature for PLA nanocomposites obtained by TG.
3.3 Electrical Characterization
of the equipment. Results for compositions with higher content of CNT, where percolation was achieved, are given below.
Figure 5 shows the shifting of the DC conductivity of PLA/CNT nanocomposites with the content of CNT. Although the presence of CNT have contributed with electrical conductivity with quantities of 1% or higher, the increase of CNT content in the samples drastically decreases their electrical conductivity. This behavior is seen for PLA/CNT 2% and PLA/CNT 5%. On the other hand, PLA/CNT 1% presents a conduc-tivity of 44 mS/cm, as higher as Pani itself, which was measured as 50 mS/cm in the same conditions.
0 2 4 6
-4 -2 0 2 log ( /m S. c m -1 ) % CNT
Figure 5: DC conductivity of PLA/CNT nanocomposites with different compositions.
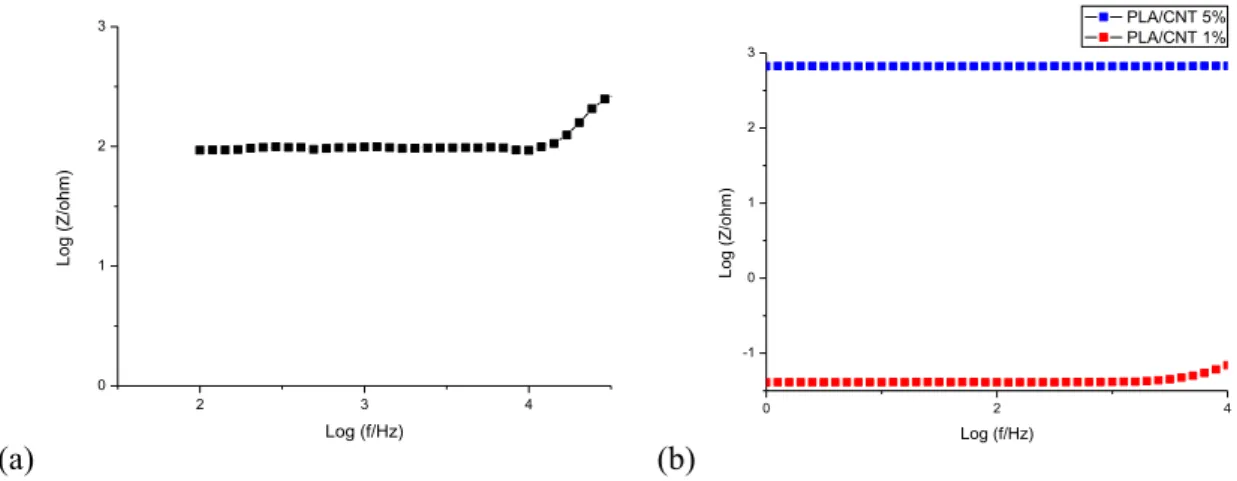
Similar behavior was observed in the AC impedance spectra. Figure 6 shows Bode plots (impedance module vs. frequency) for PLA/CNT nanocomposites and polyaniline. Both Pani and PLA/CNT nanocompo-sites behaves as pure resistors at low frequencies, where impedance is constant in this frequency region. This means that both Pani and PLA/CNT substrates promote electron flow with low resistance when a potential difference is applied. The behavior expected for insulating polymers such as PLA would be similar as a ca-pacitor, where the potential applied between two electrodes would promote polarization, and a linear de-crease of impedance with frequency [12].
(a)
2 3 4
0 1 2 3 L o g (Z /o h m) Log (f/Hz)
(b)
0 2 4
-1 0 1 2 3 L o g (Z /o h m) Log (f/Hz) PLA/CNT 5% PLA/CNT 1%
Figure 6: Bode plots (log Z vs. log f) for (a) polyaniline and (b) PLA/CNT nanocomposites.
Conductivity of these materials were calculated by considering sample dimensions. The value found for Pani was 90 mS/cm, as for PLA/CNT 1% and PLA/CNT 5% was 85 mS/cm and 0.20 mS/cm, respective-ly.
expected to promote electrical conduction. On the other hand, DSC results have showed that CNT is acting as a nucleating agent, and nanocomposites with higher concentration of nanofiller presented higher crystalliza-tion degree and low chain mobility. Somehow, the benefic effect of CNT on the electrical conductivity in PLA nanocomposites is hindered by its effects on the polymeric matrix, specially when higher quantities of CNT are added.
Based on conductivity results, PLA/CNT 1% nanocomposite was chosen as substrate for chemical deposition of Pani. The electric conductivity of this nanocomposite found for two probe method and EIS was 46 mS/cm and 85 mS/cm, respectively. Since conductivity results were similar for both Pani itself as Pani deposited onto PLA/CNT 1%, it is expected that this nanocomposite may act as a conducting polymer elec-trode for polyaniline applications.
4. CONCLUSIONS
Nanocomposites of PLA and CNT were produced with different compositions aiming a good substrate for polyaniline deposition, which can keep the conductivity properties of the conducting polymer. Thermal and morphological studies show significant modifications on the PLA matrix with higher CNT contents, indicat-ing an influence of polymer crystallization on the electrical properties of the nanocomposites.
Measurable values of electrical conductivity could be achieve only on nanocomposites with CNT con-centration above 1%. However, in the higher concon-centrations, there is a decrease in the material conductivity, probably to CNT effect on the PLA crystallization and chain mobility.
Based on these results, PLA/CNT 1% nanocomposite was chosen for polyaniline deposition, showing a similar electric behavior of the pure conducting polymer.
5. ACKNOWLEDGMENTS
Authors acknowledge EMBRAPA for PLA donation and the financial support by UDESC, FAPESC and CNPq.
6. BIBLIOGRAFIA
[1] JANÁKY, C., VISY, C. “Conducting polymer-based hybrid assemblies for electrochemical sensing: a materials science perspective”, Analytical and Bioanalytical Chemistry, v. 405, pp. 3489-3311, 2013. [2] MILAKIN, K. A., KOROVIN, A. N., MOROZ, E. V., et al., “Polyaniline-Based Sensor Material for Po-tentiometric Determination of Ascorbic Acid”, Electroanalysis, v. 25, pp.1323-1330, 2013.
[3] RAQUEZ, J. –M., HABIBI,Y., MURARIU, M., et al., “Polylactide (PLA)-based nanocomposites”, Pro-gress in Polymer Science, v. 38, pp.1504-1542, 2013.
[4] LI, Y., LIU, H., DAI, K., et al., “Tuning of vapor sensing behaviors of eco-friendly conductive polymer composites utilizing ramie fiber”, Sensors and Actuators B: Chemical, v. 31, pp.1279-1289, 2015.
[5] WU, D., LY, Q., FENG, S., et al., “Polylactide composite foams containing carbon nanotubes and carbon black: Synergistic effect of filler on electrical conductivity”, Carbon, v. 95, pp.380-387, 2015.
[6] BELLO,R. H. Efeitos da funcionalização química em nanotubos de carbono e nanoplateletes de grafeno por silanização em matriz epóxi. Dissertação de M.Sc., Universidade do Estado de Snata Catarina – UDESC, Joinville, Santa Catarina, Brasil, 2015.
[7] WANG, J., LIU, X., CHOI, H. –S., et al., “Conducting polymer films fabricated by oxidative graft copol-ymerization of aniline on poly(acrylic acid) grafted poly(ethylene terephthalate)”, Journal of Physics Chem-istry B, v. 112, pp.14829-14835, 2008
[8] GARLOTTA, D., “A literature review of poly(lactic acid)”, Journal of Polymers and the Environment, v. 9, pp. 63-84, 2001.
[9] DECOL, M., Nanocompósitos de poli(ácido lático), poli(ε-caprolactona) e nanotubos de carbono. Dis-sertação de mestrado, Universidade do Estado de Snata Catarina, UDESC, Joinville, Santa Catarina, Brasil, 2015.
[11] LIZUNDIA, E., SARASUA, J. R., D'ANGELO, F., et al., “Biocompatible poly (L-lactide) / MWCNT nanocomposites: morphological characterization, electrical properties, and stem cell interaction” , Macromo-lecular Bioscience, v. 12, pp. 870-881, 2012.