*e-mail: [email protected]
1. Introduction
Surface treatments in commercially available materials require a well clean surface in order to avoid the development of undesirable characteristics and proprieties during and after surface treatments. Most industrial cleaning processes involve the use of hazardous and non-degradable chemicals that, in most cases, with a considerable waste generation, demand spending to dispose1. Plasma based surface cleaning uses a mixture of ions, electrons, neutrals and excited species to interact with the compounds on a surface, leading to chemical and physical interactions. Previous works already showed2-11 the ability to reduce the amount of carbon based residues on metallic surfaces and is already used as pre-treatment in plasma nitriding process for example11.
However, there are still dificulties with this technique, as
the large chemical variety of existent organic contaminants, which leads to the functionalization of organic residues and formation of polymeric compounds that show resistance to degradation11. To overcome those dificulties, more research is necessary, because there are many ways to produce active species as well the plasma itself, and so, there are many ways to increase the reactions that leads to degradation instead of polymerization.
This work aims to evaluate the inluence of the applied
RF power in the plasma treatment of an organic substance. Increasing the value of this variable directly affects the discharge characteristics, i.e. increase in the density and
energy of charged and excited species, increase of electrons density and temperature, and aids to change the discharge mode from capacitively coupling (E-mode) to inductively coupling (H-mode)12-15. Several authors already observed that when applied power is increased in the treatment of organic material, mass variation rate (MVR) increases as well, but there are important chemical and physical
modiications in the treated material that generate dificulties
to maintain a considerable etching rate2-4,7,9,16.
In the present work a simple organic molecule, the Stearic Acid, was used as a contaminant model to investigate
the inluence of the applied RF power to the plasma on the
degradation of the treated material, when the temperature is controlled and reactive (Ar-O2) and non-reactive (Ar) gas mixtures are used.
2. Experimental
The stearic acid (SA) has been used in recent studies as model of organic contaminant16-19. This molecule (C
18H36O2) is a linear chain of 18 carbons with an acid function on the extremity, so the reactions pathways are restricted to interaction of the plasma with the C-C, C-H, C=O and C-O-H functions.
In the present work, samples of approximately 1 g stearic acid – SA (>97% purity) were melted and poured
into a heated Telon® crucible, and left to cold down at
room temperature. All mass measurements, before and after the treatments, were made with the treated material
Evaluation of Sample Temperature and Applied Power on Degradation of Stearic
Acid in Inductively Coupled Radio Frequency Plasma
Carlos Eduardo Fariasa, José Carlos Bianchia, Paulo Roberto de Oliveiraa, Paulo César Borgesa, Euclides Alexandre Bernardellib, Thierry Belmontec, Márcio Mafraa*
aFederal University of Technology – UTFPR, Curitiba, PR, Brazil
bFederal Institute of Paraná – IFPR, Foz do Iguaçu, PR, Brazil
cInstitut Jean Lamour, Nancy, France
Received: February 7, 2014; Revised: September 17, 2014
Plasma cleaning is a promising technology in surface treatments, despite technological interest its use is limited because its mechanisms still are not entirely understood. This work aims to evaluate how the applied power of an inductively coupled RF discharge at 13,56 MHz, with Ar and Ar+10%O2 atmospheres, affects its capabilities to etch an organic molecule. Mass variation rate was used as
direct characterization of degradation process and attenuated total relection-Fourier transform infrared spectroscopy (ATR-FTIR) was performed to search for residual molecular modiications.
Additionally, optical emission spectroscopy (OES) measurements were performed to monitor the offer of active species in the gaseous volume. In experimental conditions was possible attain mass reduction from sample, with higher mass loss rate when applied power is increased. Material characterization
shows the possibility of attain a high etch rate, while no structural modiications were detected, if the
temperature is controlled.
still inside the crucible. The crucible mass loss was found to be negligible.
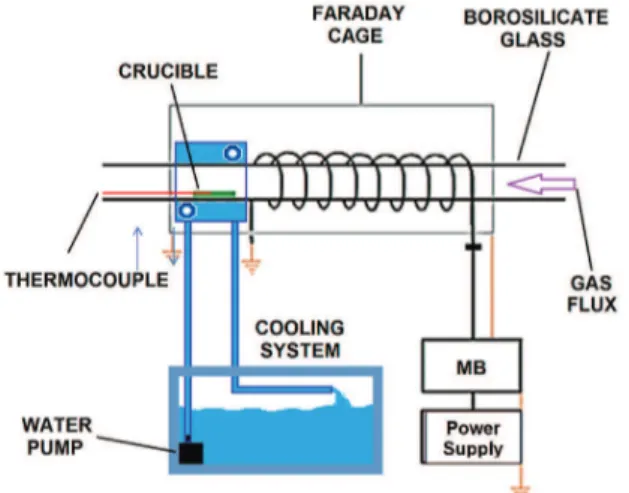
Experimental setup is depicted in Figure 1. The reactor is a borosilicate glass tube with 34 mm inner diameter
and 650 mm long, ixed by two brass holders. The plasma
is generated by a 9 turns copper coil connected to a RF 13,56 MHz power source via a matching box (MB). To avoid RF interference in sensitive electrical components, a faraday cage was built around the reactor. All metallic parts of the experimental setup are grounded to avoid electrical damaging by the electromagnetic wave.
A water recirculation system, at approximately 0 °C (ice and liquid water equilibrium temperature), was used to cool down the sample. The samples were positioned in the middle of the cooling system (CS) for better cooling
eficiency. Even using this cooling system, the exposition
to the plasma was found to be able to heat the sample. To avoid the melting of the sample, which occurs at 342,7 K, the exposition to the plasma was interrupted
during 5 minutes at each 5 minutes of treatment. These interruptions are important because in some experimental conditions, especially in the presence of oxygen, heating of the sample leads to melting. Because the treatment pressure was 300 mTorr, when SA melts it immediately starts to boil. When bubbles collapse on the sample surface, and throw small particles of SA away from the crucible to gas phase and to the reactor walls, compromising MVR measurements.
During the plasma-off period the gas low and the pressure
chamber were conserved.
The treatments were made in the 25W to 100W applied power range (with 400 V of peak-to-peak alternated tension), with 25 W steps. Two gas atmospheres were employed: pure Argon, to identify the effect of ion bombardment, and Argon (99,999% pure) + 10% Oxygen (99,99% pure), where chemical reactions can play a role. Other treatment
conditions are pressure at 300 ± 20 mTorr and gas low rate
at 100 sccm, with both kept constant during the experiments.
Attenuated total relection-Fourier transform infrared
spectroscopy (ATR-FTIR) was performed on a Varian 640-IR infrared spectrometer to investigate chemical
modiications on SA before and after exposition to plasma.
The experimental conditions were monitored by means of OES, using a 550 mm monochromator Horiba Jobin-Yvon iHR550, with spectral resolution of 0,015 nm.
3. Results
3.1. Argon discharge
When argon is the only carrier gas, with and without the cooling system (CS), two well-distinguished behaviors were observed in the treatment of stearic acid, as shown in Figure 2.
Without using the CS it is possible to observe a dependency of MVR with the applied power. If the 75 W point is not considered, a logarithmic growth of MVR is observed with the increase of the applied power. However, at 75 W an experimental perturbation zone in the discharge was produced. In this condition, striations were observed Figure 1. Experimental setup.
Figure 2. Mass variation rate of stearic acid samples treated in RF Argon plasma during 30 min, with and without the use of CS. Error
in plasma, and consequently the MVR average value is reduced. Also at this point, a remarkable increasing in the dispersion of results was observed. It is possible to assume that when striations were formed, the RF power coupling is reduced leading to a lower average energy and number of active species generated in plasma, and as consequence the ability of the plasma to etch the sample is reduced as well. The instability of this phenomenon can be seen by its bigger error bar when compared with the others experimental data. With the use of the CS, the MVR shows a different behavior, with lower etching rates. In this condition the MVR is almost constant with the applied power. However, it is well known that geometric changes in the experimental apparatus can causes important differences in the glow discharge. In this particular case, the cooling system, based
in water low, can absorb a considerable amount of the RF
applied power. In order to verify this assumption, optical
emission spectroscopy (OES) measurements were made, following Argon line emissions at 750,4 and 811,4 nm in treatment conditions turning the cooling system on after 20 minutes of 50 W of applied power. The results, presented in the Figure 3 show the stability of the system, even when the CS is turned on. Based on this result, it could be said that the offer of charged species is not affected by the CS and so the observed MVR variance could be explained by the sample temperature.
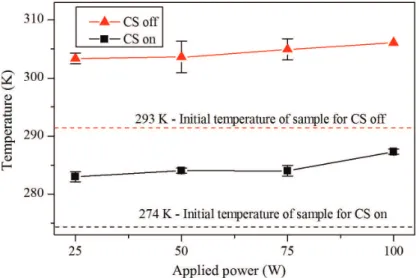
It could be supposed that without the CS, increases in the applied power leads to a higher plasma temperature, and as a consequence, the sample is heated. On the other hand, when the CS is running, we would expect a lower sample temperature since the generated heat could be removed by
the CS. This latter supposition was conirmed by measured
temperatures from sample, in Figure 4, where a considerable 20 K difference of temperature can be observed.
Figure 3. OES spectroscopy of 750.4 and 811.4 nm Ar I line emissions through time with a Ar plasma with 50W of applied power. The CS was turned on after 20 minutes.
Also, from Figure 5 it could be related that the heating with and without CS are closely the same to similar applied powers, with an increase on the temperature of about 10 ± 1 K in most cases.
When the stearic acid melting point is considered, this difference seems to become more important. At temperature values near to the stearic acid melting point, the secondary bonds between the organic chains becomes furthermore weak, leading to a high etching rate. In this case, SA can be
etched with and/or without chain modiication.
At this point, FTIR analysis as can be seen in the Figure 6, taken from the sample surface exposed to the
plasma, shows no modiication on SA chemical structure
compared with its original, even after 60 minutes (not presented results) of continuous exposition to Ar plasma. From this result it could be assumed that there was no
chemical modiication of the sample when exposed to Ar
plasma, neither creation of new functional groups. Even considering a possible contamination by the feed gas and
by desorption from the chamber walls, it was observed that there is not enough residual molecules to be detected by FTIR analysis.
Since there is a negative MVR with Ar plasma and
no residual chemical modiications of SA molecule were
detected, it could presupposed that SA molecules are cracked and/or sputtered from surface by impacts of energetic Ar atoms, Ar ions and electrons. In this way, higher temperatures of SA molecules would reduce the amount of energy necessary to remove organic molecules from sample surface, due to its already higher vibrational energy and thus weaker secondary bonds between SA molecules.
3.2. Argon-oxygen discharge
When gas composition is modified by introducing
oxygen at 10% in total low, a quite different behavior is
observed. At 100 W of applied power, even with CS on, the sample melts in less than 10 minutes of plasma exposition. Because of that, the treatments with Ar+10%O2 were
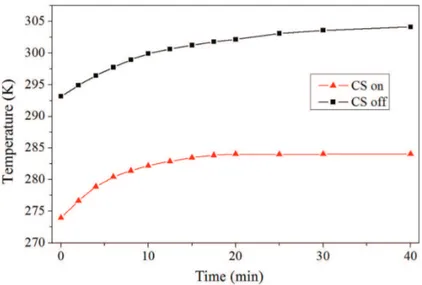
Figure 5. Sample temperature evolution with (on) and without (off) CS on exposition to Ar plasma with 50 W of applied power.
interrupted in steps by turning the plasma off by 5 minutes after each 5 minutes of treatment. This process route was
suficient to avoid sample melting.
Since it was observed, from pure argon experiments, that temperature shows a major importance in MVR measurements, an investigation was made to verify the
inluence of step on/off in both temperature and MVR.
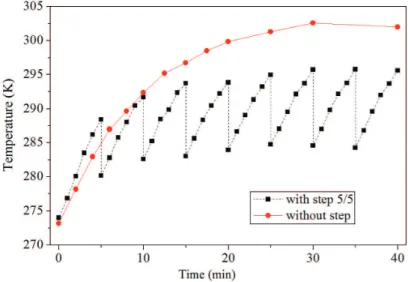
Figure 7 shows the evolution of the sample temperature through time, with Ar+O2 plasma at 50 W of applied power and using the CS. In both conditions, sample temperature rise from its initial equilibrium value with the CS (approximately 274 K) reaching without step a value of 303 ± 1 K after 30 minutes of treatment and with steps values between 283 and 293 K during most treatment time.
Figure 8 compares the MVR measurements of samples exposed to Ar+O2 plasma at 50 W of applied power and using the CS, with and without the use of steps. In both cases the MVR shows an increase in value through time until 10 minutes and after shows a continuous value.
Figure 7. Sample temperature with Ar+10%O2 gas mix through time, with and without the use of step on/off.
Figure 8. MVR measurements with Ar+10%O2 gas mix through time with and without the use of step on/off.
When both Ar+10%O2 plasma treatments with and without steps were compared with the pure argon treatment, an additional heating is noticed and is attributed to the recombination of oxygen species over the sample surface, as well as, to the probable existence of exothermal reactions, as found by Mafra et al.20.
From Figure 8 it could be found that even when the sample reach a higher temperature (as shown in Figure 7), with the introduction of oxygen in gas mix, the MVR keeps unchanged. Based on these results, it can be attributed that the presence of oxygen generates a different degradation
pathway where the temperature shows a lower inluence.
Also, is possible to observe from Figure 8, that MVR reaches a steady state condition after 10 min of plasma exposition, even when sample temperature only reach an equilibrium condition after 30 minutes of plasma treatment (Figure 7).
Reactions from the irst 10 minutes of plasma exposition
are related to a non-balanced equilibrium between
an equilibrium condition between them is reached and kept constant until 60 minutes (not presented results).
In the treatment of SA in DC plasma, with Ar and Ar+O2, Bernardelli et al.16 found a more important etching rate at the beginning of the treatment. In this case a production of more resistant compounds was the reason to explain that behavior. The results of Figure 8 not only show the opposite, but reached MVR in the present work, over 60 minutes of treatment, was kept close to Bernardelli et al.16 maximum, in which MVR quickly drops from about 24 mg/ (m².s) to 10 mg/(m².s) after 10 minutes of treatment. This different behavior can be attributed to a lower production of more resistant compounds while the sample was kept on the solid state, when compared with the Bernardelli et al.16.
Initially it was thought that a non-treated sample should present low resistance to plasma degradation, and as
consequence, show a higher MVR in the irst minutes. But
it shows the opposite, meaning that there are some different chemical and physical mechanisms that controls plasma
degradation in the irst minutes.
It is known17,21,22 that to generate degradation with oxygen it is necessary to create radicals from SA molecules, and it would take some time to create volatile compounds from the original SA molecule16-19. In this way, since radicals generation rate it is presumed to be constant, as suggested by MVR (Figure 8) and temperature (Figure 7) results, but the volatile compounds generation rate shows a time dependence, a constant MVR only will be reached once the surface of sample is covered with both reactions in equilibrium rate.
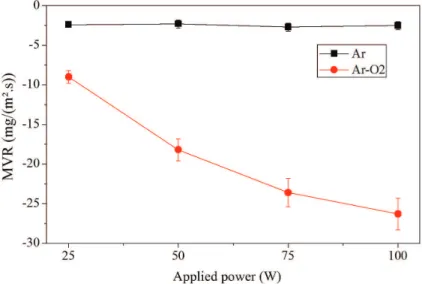
The Figure 9 shows the influence of the applied power over the MVR, for Ar+10%O2. For comparison, the MVR evolution of the sample treated in pure argon (found in Figure 2) is again plotted. In these conditions the MVR shows a very different behavior from pure argon treatments, where the MVR was unchanged from 25 to 100W, the oxygen containing treatments shown a very intense increasing of the MVR with the RF delivered
power. MVR values with Ar-O2 is more than 3 times the value with pure Ar at 25 W of applied power, and up to more than 10 times at 100 W. Oxygen atoms are known by its ability to abstract hydrogen atom from hydrocarbon molecules, generating radicals. Since radical formation is the initial step on hydrocarbons degradation mechanism, it’s expected that when the concentration of oxygen atoms is increased by an increase on the applied power, higher MVR values would appear, as in fact is observed in Figure 9. Also, the electron and ions density is increased, and the electron energy distribution function (EEDF) becomes more energetic, when the plasma power is increased23. It can be concluded that this increase in MVR with Ar+10%O2 is related to a synergic effect of ion and electron bombardment and chemical etching by oxygen species.
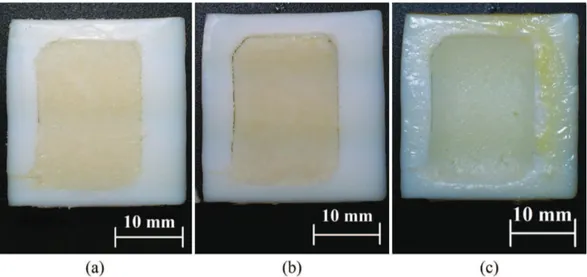
In Figure 10 it could be observed the visual aspect of the samples before and after plasma exposition. Figure 10a shows the visual aspect of sample before plasma exposure. Figure 10b and 10c show those samples that were exposed to a Ar+10%O2 plasma at 50 W of applied power with and without CS respectively. No visual changes were observed on the samples which treatment avoided the liquid phase formation (with CS). On the other hand, samples that were let to melt (not considered for MVR measurements), without
use of both CS, show visible modiication on its structure,
color and viscosity, as can be seen in Figure 10c. The melted sample changes from a slightly yellow solid to a partially solid with a viscous, sticky and yellow liquid within.
To investigate chemical changes on SA structure with Ar-O2 plasma, a FTIR spectra of not treated and after Ar-O2 plasma at 50 W applied power, with and without CS, is made and showed in Figure 11. In accordance with the changes on the visual aspect (Figure 10), the only sample that showed
modiication on FTIR spectra was the one that was let to
melt (without CS). In details, two regions are showed:
irst, between 1600 and 1800 cm–1 there is an increase on 1700 cm–1 peak, of the C=O bond of carboxylic acids, on the sample that was treated without CS; on the region from
1100 to 1500 cm–1 was observed an increase on the main peaks and with displacement for some of them.
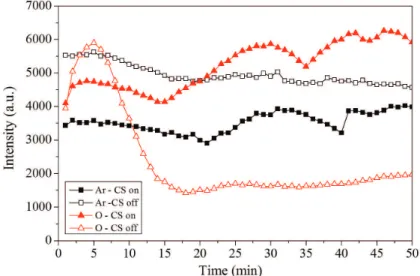
It was also observed a visual change on the color of the discharge after the sample position when melt of SA occur without CS. To verify how the plasma is changed during the treatment, OES was realized with and without CS in a Ar-O2 plasma at 50 W of applied power. The most intense lines of Ar at 811,4 nm and O at 844,6 nm through time are showed on Figure 12.
When CS was turned on and the melting of the sample surface was avoided, the O line (844,6 nm) and the Ar line (811,4 nm) have a quite similar, and regular evolution. But when the CS was turned off, the liquid formation occurred between 8-11 minutes in the studied conditions. As can be observed, the O line (844,6 nm) shows a decrease in intensity after 8 minutes of plasma exposition while the Ar
line (811,4 nm) don’t show any signiicant modiication,
meaning that when sample melts the consume of oxygen atoms is increased.
Figure 10. Visual aspect of samples exposed to Ar+10%O2 plasma with 50 W of applied power. (a) before treatment, (b) with CS and after 1 hour (c) without CS after 1 hour.
Figure 11. FTIR spectra of pure SA and samples treated with Ar-O2 plasma at 50 W of applied power, with (on) and without (off) CS.
It could be related that when SA melt, it also becomes
most sensible to chemical modiication and the viscosity of the luid allows that the bulk material came to the surface,
renovating surface molecules with not-treated material, keeping a high consume of oxygen atoms.
On some experiments with Ar+10%O2 plasma without step 5/5 but with CS on, when the sample partially melted it was possible on some measurements to observe a positive, but inconstant, MVR value. Lucki et al. related this phenomenon to functionalization of the organic molecule with oxygen atoms24. This condition of positive MVR was
dificult to be repeated since it requires that just a thin ilm
of SA melt, while the SA bellow surface remains solid. Otherwise material ejection from bubbles collapse, due to boiling, would lead to a negative MVR. For this reason, it was not possible to determine this grafting rate to compare with others experimental conditions.
from reactor, the liquid part return to a solid state. After long exposition times (longer than 10 minutes) the transformed portion of the sample remains liquid after air exposition. These results indicate a transformation process of SA with oxygen grafting, where different products can be generated in the time. This last result together with FTIR (Figure 11) and OES (Figure 12) lead to a conclusion that sample temperature control is the main key to keep a high mass loss of SA on Ar-O2 plasma. Also, when liquid formation occur, SA molecules functionalize with oxygen faster, showing increase on the oxygen related peaks on FTIR (Figure 11) and on the decrease of oxygen emission lines after sample position as shown by OES (Figure 12). However more experiments are needed to clarify the evolved reaction pathways when the temperature is controlled.
4. Conclusions
SA exposition to Ar and Ar+10%O2 plasma discharges showed capability to attain mass reduction from sample in both conditions. As expected, increases on applied power, on both gases, lead to higher chemical and physical reactions between the sample and the plasma species, obtaining higher
etching rates, modiications and material removal. But,
when sample temperature is considered altogether, different behaviors can be noticed. When the samples are treated in
pure Ar plasma, no chemical modiications were observed
by FTIR. In this case increases on the sample temperature tend to increase the observed MVR, by making it easier to remove SA molecules through impact of energetic Ar atoms. However, when oxygen is present on the gas mixture, temperature increases are enough to melt the sample, which promotes functionalization with the creation of new oxygenated function as observed by FTIR and suggested by OES. On the other hand, with lower temperatures and with Oxygen, it was possible to attain more degradation reactions over functionalization as suggested by a higher
MVR, and no modiication on FTIR and OES analyses. In
this way, it is clear that sample temperature is an essential control variable when the treatment objective is to degrade a solid organic residue. Analysis of plasma treatment towards plasma cleaning shows that this kind of process depends on many variables to achieve a good equilibrium
of chemical and physical reactions to result in an eficient
rate of contaminant removal.
Acknowledgments
The authors wish to thank the CAPES/COFECUB, a joint Brazilian/French project (Ph 697/10), and Brazilian CNPq project nº479593/2012-4 for support.
The authors are also thankful for C.E.F.’s scholarship grant from Brazilian CAPES.
Figure 12. OES spectroscopy of 811.4 and 844.6 nm Ar I and O respectively line emissions through time with a Ar-O2 plasma with 50W of applied power.
References
1. Chalk DB. Classification and selection of cleaning processes.
In: ASM International Handbook Committee. ASM
Handbook: surface engineering. ASM International; 1994. p. 3-17. ASM Handbook, v. 5.
2. Kersten H, Steffen H and Behnke JF. Investigations on plasma-assisted surface cleaning of aluminum contaminated with lubricants. Surface and Coatings Technology. 1996; 86-87:762-768. http://dx.doi.org/10.1016/S0257-8972(96)03030-7.
3. Korzec D, Rapp J, Theirish D and Engemann J. Cleaning of metal parts in oxygen radio frequency plasma: Process study. Journal of Vacuum Science & Technology. A, Vacuum, Surfaces, and Films. 1994; 12(2):369. http://dx.doi.org/10.1116/1.579249.
4. Li H, Belkind A, Jansen F and Orban Z. An in situ XPS study of oxygen plasma cleaning of aluminum surfaces. Surface and Coatings Technology. 1997; 92(3):171-177. http://dx.doi. org/10.1016/S0257-8972(97)00079-0.
planar low-pressure microwave discharges. Surface and Coatings Technology. 1995; 74-75:59-62. http://dx.doi. org/10.1016/0257-8972(95)08221-2.
6. Kegel B and Schmid H. Low-pressure plasma cleaning of metallic surfaces on industrial scale. Surface and Coatings Technology. 1999; 112(1-3):63-66. http://dx.doi.org/10.1016/ S0257-8972(98)00766-X.
7. Fessmann J and Grünwald H. Plasma treatment for cleaning of metal parts. Surface and Coatings Technology. 1993; 59(1-3):290-296. http://dx.doi.org/10.1016/0257-8972(93)90099-A.
8. Petasch W, Kegel B, Schmid H, Lendenmann K and Keller HU. Low-pressure plasma cleaning: a process for precision cleaning applications. Surface and Coatings Technology. 1997; 97(1-3):176-181. http://dx.doi.org/10.1016/S0257-8972(97)00143-6.
9. Steffen H, Schwarz J, Kersten H, Behnke JF and Eggs C. Process control of RF plasma assisted surface cleaning.
Thin Solid Films. 1996; 283(1-2):158-164. http://dx.doi. org/10.1016/0040-6090(96)08535-5.
10. Belkind A, Krommenhoek S, Li H, Orban Z and Jansen F. Removal of oil from metals by plasma techniques. Surface and Coatings Technology. 1994; 68-69:804-808. http://dx.doi. org/10.1016/0257-8972(94)90257-7.
11. Grün R. Combination of different plasma assisted processes with pulsed d.c.: cleaning, nitriding and hardcoatings. Surface and Coatings Technology. 1995; 74-75:598-603. http://dx.doi. org/10.1016/0257-8972(95)08310-3.
12. Conrads H and Schmidt M. Plasma generation and plasma sources. Plasma Sources Science & Technology. 2000; 9(4):441-454. http://dx.doi.org/10.1088/0963-0252/9/4/301.
13. Godyak VA. Nonequilibrium EEDF in gas discharge plasmas.
IEEE Transactions on Plasma Science. 2006; 34(3):755-766. http://dx.doi.org/10.1109/TPS.2006.875847.
14. Kim SS, Chung CW and Chang HY. Theoretical investigation of the evolution of electron energy distribution functions in inductively coupled discharges. Thin Solid Films. 2003; 435(1-2):72-77. http://dx.doi.org/10.1016/S0040-6090(03)00375-4.
15. Edamura M and Benck EC. Effects of voltage distribution along an induction coil and discharge frequency in inductively coupled plasmas. Journal of Vacuum Science & Technology. A, Vacuum, Surfaces, and Films. 2004; 22(2):293. http://dx.doi. org/10.1116/1.1641052.
16. Bernardelli EA, Souza T, Maliska AM, Belmonte T and Mafra M. Plasma etching of stearic acid in Ar and Ar-O2 DC
discharges. Materials Science Forum. 2010; 660-661:599-604. http://dx.doi.org/10.4028/www.scientific.net/MSF.660-661.599.
17. Bernardelli EA, Mafra M, Maliska AM, Belmonte T and Klein AN. Influence of neutral and charged species on the plasma degradation of the stearic acid. Materials Research. 2013; 16(2):385-391. http://dx.doi.org/10.1590/S1516-14392013005000008.
18. Bernardelli EA, Souza T, Mafra M, Maliska AM, Belmonte T and Klein AN. Modification of stearic acid in Ar and Ar-O2 pulsed DC discharge. Materials Research. 2011; 14(4):519-523. http://dx.doi.org/10.1590/S1516-14392011005000068.
19. Bernardelli EA, Belmonte T, Duday D, Frache G, Poncin-Epaillard F, Noel C, et al. Interaction Mechanisms Between Ar–O2 Post-Discharge and Stearic Acid II: Behaviour of Thick Films. Plasma Chemistry and Plasma Processing. 2011; 31(1):205-215. http://dx.doi.org/10.1007/s11090-010-9264-1.
20. Mafra M, Belmonte T, Poncin-Epaillard F, da Silva Sobrinho AS and Maliska AM. Role of the Temperature on the Interaction Mechanisms Between Argon–Oxygen Post-Discharge and Hexatriacontane. Plasma Chemistry and Plasma Processing. 2008; 28(4):495-509. http://dx.doi.org/10.1007/s11090-008-9140-4.
21. Belmonte T, Bernardelli EA, Mafra M, Duday D, Frache G, Poncin-Epaillard F, et al. Comparison between hexatriacontane and stearic acid behaviours under late Ar—O2 post-discharge.
Surface and Coatings Technology. 2011; 205(2):S443-S446. http://dx.doi.org/10.1016/j.surfcoat.2011.03.041.
22. Wertheimer MR, Fozza AC and Holländer A. Industrial processing of polymers by low-pressure plasmas: the role of VUV radiation. Nuclear Instruments & Methods in Physics Research. Section B, Beam Interactions with Materials and Atoms. 1999; 151(1-4):65-75. http://dx.doi.org/10.1016/S0168-583X(99)00073-7.
23. Godyak VA. Nonequilibrium EEDF in gas discharge plasmas.
IEEE Transactions on Plasma Science. 2006; 34(3):755-766. http://dx.doi.org/10.1109/TPS.2006.875847.