a Weighted HITS Algorithm
Tsuyoshi Deguchi1, Katsuhide Takahashi1,2, Hideki Takayasu3,4, Misako Takayasu1*
1Department of Computational Intelligence and Systems Science, Interdisciplinary Graduate School of Science and Engineering, Tokyo Institute of Technology, Midori-ku, Yokohama, Japan,2Department of Economics, Kokugakuin University, Shibuya-ku, Tokyo, Japan,3Sony Computer Science Laboratories, Shinagawa-ku, Tokyo, Japan, 4Graduate School for Advanced Mathematical Sciences, Meiji University, Tokyo, Japan
Abstract
We investigate the economic hubs and authorities of the world trade network (WTN) from1992to2012, an era of rapid economic globalization. Using a well-defined weighted hyperlink-induced topic search (HITS) algorithm, we can calculate the values of the weighted HITS hub and authority for each country in a conjugate way. In the context of the WTN, authority values are large for countries with significant imports from large hub countries, and hub values are large for countries with significant exports to high-authority countries. The United States was the largest economic authority in the WTN from1992
to2012. The authority value of the United States has declined since2001, and China has now become the largest hub in the WTN. At the same time, China’s authority value has grown as China is transforming itself from the ‘‘factory of the world’’ to the ‘‘market of the world.’’ European countries show a tendency to trade mostly within the European Union, which has decreased Europe’s hub and authority values. Japan’s authority value has increased slowly, while its hub value has declined. These changes are consistent with Japan’s transition from being an export-driven economy in its high economic growth era in the latter half of the twentieth century to being a more mature, economically balanced nation.
Citation:Deguchi T, Takahashi K, Takayasu H, Takayasu M (2014) Hubs and Authorities in the World Trade Network Using a Weighted HITS Algorithm. PLoS ONE 9(7): e100338. doi:10.1371/journal.pone.0100338
Editor:Frederic Amblard, University Toulouse 1 Capitole, France
ReceivedJune 27, 2013;AcceptedMay 26, 2014;PublishedJuly 22, 2014
Copyright:ß2014 Deguchi et al. This is an open-access article distributed under the terms of the Creative Commons Attribution License, which permits unrestricted use, distribution, and reproduction in any medium, provided the original author and source are credited.
Funding:This work was supported by the Grant-in-Aid for Scientific Research (C), Grant Nmber 24540395. The funders had no role in study design, data collection and analysis, decision to publish, or preparation of the manuscript.
Competing Interests:The authors have the following interests: Hideki Takayasu is employed by Sony Computer Science Laboratories. This does not alter the authors’ adherence to all the PLOS ONE policies on sharing data and materials.
* Email: [email protected]
Introduction
Attempts to describe the patterns of international trade -who sells what to whom- have been a major preoccupation of international economists [1]. Studying the world trade network (WTN) is important not only for understanding the entire picture of world trade, but also for learning about the structure of the international economic system. With the globalization of the world economy in the last two decades, the structure of world trade has changed dramatically. World trade as a whole is increasing: the total value of world trade has quadrupled in the last two decades. However, the value of trade among advanced nations has grown only moderately, if at all. For example, trade between Japan and North American Free Trade Agreement (NAFTA) members has not grown at all during this period. However, trade between advanced countries and emerging countries has increased sharply. For instance, the value of trade between China and the European Union (EU) in 2008was five times larger than it was1990[2]. Newly emerging economies, including those of China, Korea, and members of the Association of South East Asian Nations (ASEAN), have become driving forces of expanding world exports. China has become the largest exporter in the WTN, replacing the United States. Is the United States losing its influence as China gains more power in the WTN? If so, on what evidence we can make such a determination?
In economic study, the word ‘‘hub’’ is not strictly defined, but it is conventionally used to indicate countries that have a large
number of outgoing links with a large amount of trade - that is, they export large amounts of goods and services to other countries. An economic hub country typically imports raw materials, parts, and intermediate goods from other countries, assembles final goods, and exports these goods to consumer-driven countries. For example, Japan was a typical economic hub country in the1990s, importing raw materials and exporting automobiles and electron-ics to the United States and Europe. Now, China seems to have become the world’s foremost economic hub. We examine these assertions by applying the concepts of hub and authority used in social network analysis.
Social network studies have been conducted on the structure of international trade networks since World War II. The original idea of a world trade network can be traced to the studies of the League of Nations in 1942, which employed graphs called sociograms
[3,4]. Recently, sociograms have been utilized numerically and computationally in the field of complex network analysis [5,6]. In
research in recent years has been the investigation of the effects of ranking algorithms on the performance and behavior of networked systems. In 2011, Ermann and Shepelyansky found that the PageRank approach gives a ranking that is independent of the trade amount of a given country [19]. Wei and Liu recently employed the weighted hyperlink-induced topic search (HITS) algorithm to characterize the world trade network [20]. HITS was originally introduced by Kleinberg to rate the importance of a node in a complex directed network using authority and hub values [21,22]. In its original meaning, a node with a high authority value is pointed to by many other nodes with high hub values, and a node with a high hub value points to many nodes with high authority values. This algorithm has been used as a tool for the characterization of the network structure of homepages, and it has been applied to various economic areas, such as the analysis of money-flow networks among Japanese business firms [23,24]. Using the 1962–2000 trade dataset compiled by the United States’ National Bureau of Economic Research (NBER), Wei and Liu concluded that the ‘‘impact ranking’’ (equivalent to authority ranking) of the United States was decreasing and that the influence of China and Japan was increasing up to2000[20].
In this paper, we introduce the quantitative measures of the hub to clarify the WTN’s topology changes more exactly in terms of network science. To do this, we purchase and analyze the International Monetary Fund’s (IMF) Direction of Trade Statistics dataset for the period 1992–2012 [25]. In the WTN, countries are nodes and the links are the exports and imports among them, where the weight of a link is defined as the annual amount of trade. Following the development of complex network studies, we introduce two definitions of ‘‘hub’’: the ‘‘HITS hub,’’ which characterizes the network without weights, and the ‘‘weighted HITS hub,’’ which considers the weights. With these mathematically defined hubs, we can quantitatively discuss the WTN’s economics hubs and their changes over time. As an export and an import always make a pair, we also introduce ‘‘HITS authority’’ and ‘‘weighted HITS authority’’ as counter-parts of the concepts of the ‘‘HITS hub’’ and ‘‘weighted HITS hub’’ to characterize the role of imports in the WTN. Note that these network quantities generally take large values for large countries; however, they are not simply proportional to the amount of exports or imports: for some countries, these quantities take larger values depending on the WTN location.
Measuring Influence in WTN
Dataset
The data used in our study were compiled from the Direction of Trade Statistics (DOTS) by the International Monetary Fund. All the data can be downloaded or purchased in the form of CD-ROM from the official web site of the IMF [25]. DOTS provide information on bilateral trade relationship, exports and imports, between any pairs of countries or regions monthly and yearly from1992to2012measured in US dollar. Theoretically the amount of export of country A to country B should be the same as the amount of import of country B from country A, however, there are small differences in these numbers. In the following data analysis we show results calculating all quantities based on the export yearly data as we checked that the results do not change by calculating based on the import yearly data.
The DOTS data includes regions like Europe and Africa, however, we pay attention only to countries. Some countries were newly founded and some had disappeared because of political upheaval during this period. Technically speaking, we
treated these disappeared or newly established countries in the following way. In the process of compiling our dataset, we eliminated the entries of countries which had already gone before 1992 even though they still survive nominally in the original data. They are East Germany, USSR, Yemen Arab Republic and PD Yemen. We treated Belgium and Luxemburg separately since 1997 because they were consolidated before that in the IMF data. In the same way we dealt with Czech Republic and Slovakia Republic separately since1993. Former Yugoslavian countries were treated as well in the same way. Through these procedures we identified 183–187
countries in each year which indicates the number of nodes in our paper.
PageRank Algorithm and HITS Algorithm
In this section, we show the algorithms used in this study. First, to describe the method, we define the weighted network matrix,
W, whose component, wi j, represents the annual amount of exports of goods (products) from countryito countryjmeasured in millions of US dollars. By definition,wii~0. We also introduce the binary network matrix, A, whose component ai j~1 when
wi jw0andai j~0whenwi j~0.
We introduce PageRank, which characterizes the importance of a node in the network by considering random diffusion [26,27]. PageRank is defined as the eigenvector of the following Google matrix:
gi j~q
ai j X
ai j
z(1{q)1
N ð1Þ
Here, N is the number of nodes and q~0:85 is a positive parameter introduced to ensure the existence of a unique solution by the Perron-Frobenius theorem. Denoting the Google matrix by
G, the PageRank vector, z~(z1,. . .,zN) , is obtained by repeating the following iteration until convergence:
z(tz1)~G z(t) ð2Þ
where,tis the number of iterations, the super-script>denotes the transpose of a vector or a matrix, and the initial condition is
given by zi(0)~
1
N for all i. We also introduce a modified
PageRank, the weighted PageRank, which is defined in the same way by replacingai j withwi jin equations (1) and (2).
Next, we introduce the HITS algorithm to define the HITS hub and authority. The HITS authority vector,x~(x1,. . .,xN) , and the HITS hub vector,y~(y1,. . .,yN) , are defined by the limit of the following set of iterations:
x(tz1)~c(t)A y(t) ð3Þ
y(tz1)~d(t)Ax(tz1) ð4Þ
wherec(t)andd(t)are normalization factors to make the sums of all elements become unity,
XN
i~1
xi(tz1)~1, XN
i~1
yi(tz1)~1 ð5Þ
The initial values of the iterations arexi~
1
Nandyi~
1 Nfor all i. As is known from this formulation, the HITS authority vector,x, is the eigenvector for the matrix A A; similarly, the HITS hub vector,y, is the eigenvector for the matrix AA . As the matrix elements ofAare non-negative, the elements ofxandyare also non-negative. As is known from this definition, a node has a larger value of HITS authority if it has more links from those nodes with larger HITS hub values; similarly, a node has a larger value of HITS hub if it is linked to those nodes with larger HITS authority values. The weighted HITS hub and weighted HITS authority are defined in exactly the same way, replacingAwithW in Eq. (3) and (4).
We also define the shares of export/import for comparison with these hub/authority values by the following ratios: the amount of export/import divided by the whole amount,
Share of Exporti~
XN j~1wij XN
i~1 XN
j~1wij
,
Share of Importi~
XN j~1wji XN
i~1 XN
j~1wji
ð6Þ
Feasibility of the weighted HITS in the WTN
First, we show that the weighted HITS algorithm is more appropriate than the original HITS algorithm. Focusing on the top20exporter countries in the WTN, we easily find that nearly all of these countries have connected with each other in the21 -year period. This means that the top20nodes comprise an almost-complete network. As a result, the HITS hub and HITS authority values calculated by the original HITS algorithm vary little among these top countries. For example, Korea and the United States are characterized by similar HITS values, although the trade export magnitude of the United States is more than2:87times greater than that of Korea. In Figure 1, we show the rank plots of the values calculated by the original HITS algorithm and the weighted HITS algorithm of the WTN for the year2012. We find that the original HITS algorithm fails to represent the differences among the top20countries, while the weighted HITS algorithm reflects their differences. We judge that the weighted HITS values are a better characterization than the original HITS values.
The same discussion holds for the original PageRank algorithm and the weighted PageRank algorithm. In the case of WTN, neglect of the weights makes the top-ranked countries nearly identical, which is not favorable for WTN characterization. Comparing the weighted HITS and weighted PageRank in the case of WTN, the weighted HITS is more nontrivial, as it reflects the two-link network structure, while the weighted PageRank only reflects the one-link network structure. Therefore, in this paper, we focus on the weighted HITS as a mathematical definition of economic hub and authority.
Here, we discuss the query dependency of the HITS algorithm, as some papers indicate that PageRank is better than HITS because HITS is a query-dependent algorithm and PageRank is a query-independent algorithm [19,28]. Query dependency is an important concept in homepage ranking algorithms. It means that the scheme assigning a score to a node depends on the context of the homepage network. In the case of WTN, we analyze all the Figure 1. PageRank and Hub/Authority.Comparison of distributions of various network quantities in the year2012. Authority (blue), Hub (red), PageRank (green); the binary cases and the weighted cases are represented by triangles and circles, respectively.
nodes and links, as the number of nodes is only about 200. Thus, we analyze the network with the HITS algorithm globally, and there is no query-dependent problem in this case.
WTN data for the past 21 years
By examining the WTN over time, we can observe its evolution. Figure 2 shows the trade relationships among the top10exporters in the world in1992. The width of the links is weighted by the export value in US dollars. The wider the links, the larger the exports. Apparently, there exist strong trade relationships among
European countries (Great Britain, France, Germany, Belgium-Luxembourg, the Netherlands, and Italy). Strong ties between the United States and Japan and between the United States and Canada can also be observed. It is evident that the nexus of world trade was located in the advanced Western nations in1992. Until the Soviet Union collapsed in December 1991, the world economic system was divided into East and West. Both Cold War powers were separated politically and economically for more than forty years. In2002, China appeared as a major exporter (see Figure 3). The rapid and historic economic growth of China began Figure 2. WTN among the top 10 countries in 1992.For each country, the top three exports/imports are indicated by the arrows. The countries are placed clockwise in order of total annual export, beginning with the United States. Colors specify the regions; the North America (yellow), Europe (blue), and East Asia (red). Abbreviations are as follows, ‘‘USA = United States’’, ‘‘DEU = Germany’’, ‘‘JPN = Japan’’, ‘‘FRA = France’’, ‘‘GBR = United Kingdom’’, ‘‘ITA = Italy’’, ‘‘NLD = Netherlands’’, ‘‘CAN = Canada’’, ‘‘BEL-LUX = Belgium-Luxembourg’’ and ‘‘HKG = Hong Kong.’’
doi:10.1371/journal.pone.0100338.g002
with its economic reform in December1979. China’s subsequent accession to the World Trade Organization (WTO) in2001had a large impact on the world trade structure, and China’s emergence has changed the global balance of economic and political power. The direction and composition of world trade are dynamic, reflecting the changing economic and political relations in international society. In 2012, the differences between China and other countries became more distinct than they were in2002
(see Figure 4). The competitiveness of products, industries, and
firms affects a country’s exports substantially. In 2012, Korea became one of the world’s top 10 exporters because of its strengthened international competitiveness. With the emergence of China, Korea, and the ASEAN countries, it is obvious that the center of world trade has shifted toward Asia. In the debate on the rise and fall of nations, economists and policymakers have often highlighted global trade imbalances, especially the United States’ huge trade deficit and the China’s enormous trade surplus. Some have argued that the huge US trade deficit reflects the waning Figure 3. WTN among the top 10 countries in 2002.This figure follows the same format as Figure2. Abbreviations are as follows, ‘‘USA = United States’’, ‘‘DEU = Germany’’, ‘‘JPN = Japan’’, ‘‘FRA = France’’, ‘‘CHN = China’’, ‘‘GBR = United Kingdom’’, ‘‘CAN = Canada’’, ‘‘ITA = Italy’’, ‘‘NLD = Netherlands’’ and ‘‘BEL = Belgium.’’
competitiveness of US products, and that the United States is losing its high status and influential position (as ahegemon, in the jargon of international politics) in the WTN.
Hubs in the WTN
Here, we show the results and discuss the relationship between the weighted HITS hub values and the shares of the world exports for each country as listed in Table 1. We also discuss the changes in economic hub values shown in Table 2 and Figure 5, in which China was first in2012 after being thirteenth in 1992. China’s export value began to increase dramatically with its accession to
the WTO in2001. In particular, China’s exports to the United States, the largest weighted HITS authority, have increased remarkably since 2001. This explains the sharp rise in China’s weighted HITS hub value. Korea rose from twelfth to seventh by strengthening its international competitiveness and supplanting Japanese exports throughout the global market. Japan’s weighted HITS hub value was highest in1992, but it subsequently declined for the following reasons. 1) Exports from Japan to the United States and European countries were constrained by trade frictions. 2) Japanese firms emphasized production for local consumption instead of for exports. 3) Exports from Japan decreased because of Figure 4. WTN among the top 10 countries in 2012.This figure follows the same format as Figure2. Abbreviations are as follows, ‘‘CHN = China’’, ‘‘USA = United States’’, ‘‘DEU = Germany’’, ‘‘JPN = Japan’’, ‘‘NLD = Netherlands’’, ‘‘FRA = France’’, ‘‘KOR = Republic of Korea’’, ‘‘ITA = Italy’’, ‘‘CAN = Canada’’ and ‘‘HKG = Hong Kong.’’
doi:10.1371/journal.pone.0100338.g004
Table 1.The Weighted HITS Hub Values and Shares of World Exports in 2012.
Country Hub Value Share in the World Exports
P.R. China 0.1532 0.1184
Canada 0.0842 0.0267
Mexico 0.0699 0.0217
Japan 0.0587 0.0442
United States 0.0529 0.0893
Germany 0.0504 0.0775
Republic of Korea 0.0343 0.0311
Hong Kong 0.0323 0.0255
Netherlands 0.0247 0.0373
Saudi Arabia 0.0239 0.0207
France 0.0227 0.0324
United Kingdom 0.0210 0.0239
Singapore 0.0198 0.0230
Italy 0.0197 0.0284
Belgium 0.0189 0.0250
India 0.0154 0.0171
Russian Federation 0.0142 0.0252
Australia 0.0141 0.0146
Switzerland 0.0133 0.0132
Brazil 0.0130 0.0138
doi:10.1371/journal.pone.0100338.t001
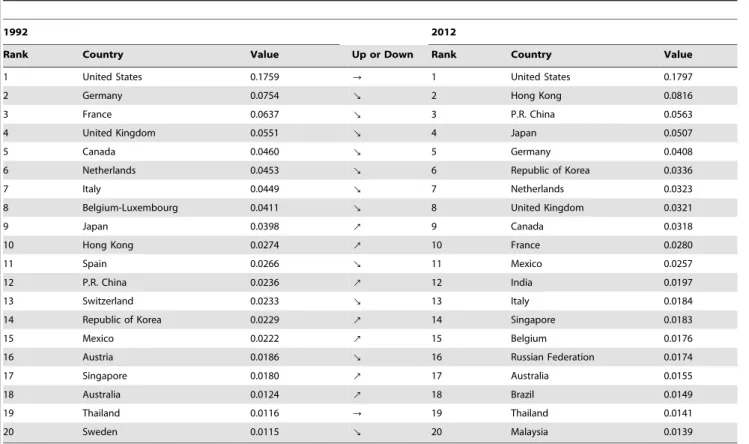
Table 2.Weighted HITS Hub Value Ranks in 1992 and 2012 (top 20).
1992 2012
Rank Country Value Up or Down Rank Country Value
1 Japan 0.1181 : 1 P.R. China 0.1532
2 Canada 0.0983 ? 2 Canada 0.0842
3 Germany 0.0915 : 3 Mexico 0.0699
4 United States 0.0717 : 4 Japan 0.0587
5 France 0.0552 : 5 United States 0.0529
6 United Kingdom 0.0502 : 6 Germany 0.0504
7 Italy 0.0451 : 7 Republic of Korea 0.0343
8 Hong Kong 0.0376 ? 8 Hong Kong 0.0323
9 Netherlands 0.0375 ? 9 Netherlands 0.0247
10 Mexico 0.0350 8 10 Saudi Arabia 0.0239
11 Belgium-Luxembourg 0.0335 : 11 France 0.0227
12 Republic of Korea 0.0239 8 12 United Kingdom 0.0210
13 P.R. China 0.0185 8 13 Singapore 0.0198
14 Switzerlad 0.0183 : 14 Italy 0.0197
15 Singapore 0.0178 8 15 Belgium 0.0189
16 Spain 0.0160 : 16 India 0.0154
17 Saudi Arabia 0.0149 8 17 Russian Federation 0.0142
18 Sweden 0.0132 : 18 Australia 0.0141
19 Austria 0.0114 : 19 Swizerland 0.0133
20 Malaysia 0.0114 : 20 Brazil 0.0130
the long-standing appreciation of Japan’s currency [29–31]. Consequently, Japan’s exports to countries with high weighted HITS authority values have become relatively small in the WTN. In contrast to China’s rise, Japan’s apparent fall reflects the so-called Lost Decade, during which Japan experienced a long-term economic downturn. Germany has shown a slight downward trend. The United States stagnated in the first half of the2000s, but the data suggest a possible recovery. The decline of the weighted HITS hub values of European countries is notable. The weighted HITS hub values of most European countries have decreased over the last two decades (see Table 2). This trend can be explained by the fact that exports from European countries have tended to concentrate within the European Union following the establishment of a common market. This is a well-known trade diversion effect.
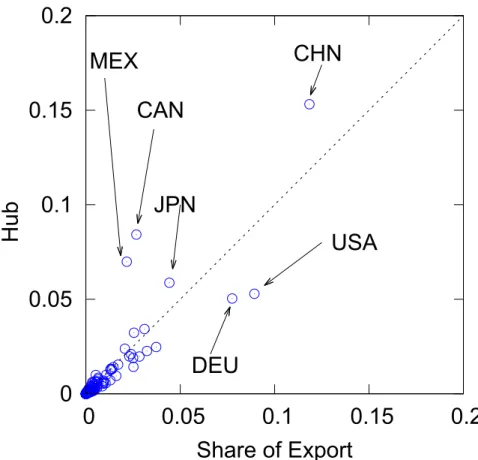
Figure 6 demonstrates this relationship by showing the correspondence between the weighted HITS hub values and the trade share of each country in world exports. The horizontal axis indicates the shares of exports, while the corresponding hub values are plotted on the vertical axis. The scatter of points does not always cluster around the dotted45-degree line (it is supposed to be on the 45-degree line if the hub values and the share are proportionate). This means that the weighted HITS hub values and the shares are proportional as the link structure of WTN affects the weighted HITS values in some way. While China’s share of world exports is0:1184(11:84%), its hub value is0:1532, which is significantly larger than if it were in due proportion, which suggests that China is more influential in actuality than the trade statistics suggest.
Authority in the WTN
Next, we examine the weighted HITS authority values and shares of imports in the WTN (see Tables 3 and 4 and Figure 7). The United States has maintained the highest value since 1992. Hong Kong and China rank second and third, respectively, in
2012. The weighted HITS authority value of the United States
rose remarkably in the late 1990s during the economic boom known as theNew Economy, which was led by the IT industry. Its weighted HITS authority value rose to a record high in2000, by far the largest in the WTN. It seemed that the United States had established hegemon status in the world political economy. However, itshegemonyhas weakened since2001, while emerging countries have experienced dramatic economic growth. Although the United States has maintained its status as the most influential country in the WTN up to the present, its dominance is not as overwhelming as before (see Figure 7).
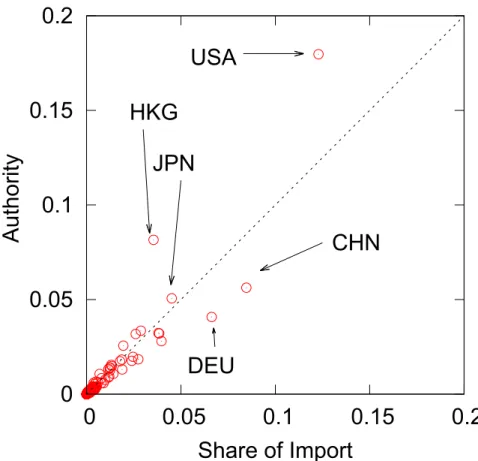
Now we examine the relationship between a country’s weighted HITS authority value and its share of world imports. Figure 8 shows that the data points do not fall on the45-degree line. We find that the weighted HITS authority and the share are not necessarily proportional, just as in the hub case. While the United States’ share of world imports is0:1229 (12:29%), its weighted HITS authority value is0:1797, which is significantly larger than if it were in due proportion, implying that the United States is more influential than the trade statistics would suggest (see Table 3).
Suggested explanation for the Hub-Authority correlation
A node with larger value of HITS authority is considered to be a large importing country in which demand for foreign goods (products) is significantly large, a big ‘‘consumer’’ in the world market. On the other hand, a node with larger value of HITS hub is interpreted to be a large exporting country which has a large capacity of supplying goods, a big ‘‘factory’’ in the world market. By definition value of HITS authority and HITS hub are interrelated. They are strengthening and reinforcing each other. The higher the hub, the higher the authority, and vice versa. Consequently, the hub value and authority value become higher than our simple observation on exporting share of each country to a trading partner (see Figure 9 and 10).
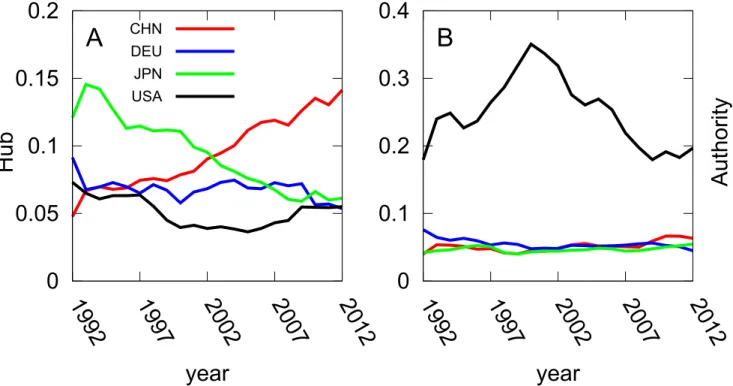
Firstly, we examine the relation to the highest weighted authority country, the United States. In this case, Canada and Mexico offer a good example as exporters. Their shares of the Figure 5. Transition of Exports Shares in the period 1992–2012 shown in panel (A). (B) Transition of the weighted HITS Hub
China (red), Germany (blue), Japan (green) and the United States (black). explains the sharp rise in China’s weighted HITS hub value.
doi:10.1371/journal.pone.0100338.g005
Hubs and Authorities in the World Trade Network
Figure 6. Comparison of the weighted HITS Hub Value and Trade Share in Global Exports in 2012. doi:10.1371/journal.pone.0100338.g006
Table 3.The Weighted HITS Authority Values and Shares of World Imports in 2012.
Country Authority Value Share in the World Imports
United States 0.1797 0.1229
Hong Kong 0.0816 0.0355
P.R. China 0.0563 0.0847
Japan 0.0507 0.0451
Germany 0.0408 0.0663
Republic of Korea 0.0336 0.0288
Netherlands 0.0323 0.0381
United Kingdom 0.0321 0.0385
Canada 0.0318 0.0260
France 0.0280 0.0397
Mexico 0.0257 0.0195
India 0.0197 0.0246
Italy 0.0184 0.0274
Singapore 0.0183 0.0187
Belgium 0.0176 0.0240
Russian Federation 0.0174 0.0177
Australia 0.0155 0.0131
Brazil 0.0149 0.0133
Thailand 0.0141 0.0125
Malaysia 0.0139 0.0122
Table 4.Weighted HITS Authority Value Ranks in 1992 and 2012 (top 20).
1992 2012
Rank Country Value Up or Down Rank Country Value
1 United States 0.1759 ? 1 United States 0.1797
2 Germany 0.0754 : 2 Hong Kong 0.0816
3 France 0.0637 : 3 P.R. China 0.0563
4 United Kingdom 0.0551 : 4 Japan 0.0507
5 Canada 0.0460 : 5 Germany 0.0408
6 Netherlands 0.0453 : 6 Republic of Korea 0.0336
7 Italy 0.0449 : 7 Netherlands 0.0323
8 Belgium-Luxembourg 0.0411 : 8 United Kingdom 0.0321
9 Japan 0.0398 8 9 Canada 0.0318
10 Hong Kong 0.0274 8 10 France 0.0280
11 Spain 0.0266 : 11 Mexico 0.0257
12 P.R. China 0.0236 8 12 India 0.0197
13 Switzerland 0.0233 : 13 Italy 0.0184
14 Republic of Korea 0.0229 8 14 Singapore 0.0183
15 Mexico 0.0222 8 15 Belgium 0.0176
16 Austria 0.0186 : 16 Russian Federation 0.0174
17 Singapore 0.0180 8 17 Australia 0.0155
18 Australia 0.0124 8 18 Brazil 0.0149
19 Thailand 0.0116 ? 19 Thailand 0.0141
20 Sweden 0.0115 : 20 Malaysia 0.0139
doi:10.1371/journal.pone.0100338.t004
Figure 7. Transition of Imports Shares from 1992–2012 shown in panel (A). (B) Transition of Authority Values from 1992–2012 China (red), Germany (blue), Japan (green) and the United States (black). The authority value of the United States
1990s because of the advent of the New Economy, which was driven by the IT revolution. It began to decline in the
2000. doi:10.1371/journal.pone.0100338.g007
Hubs and Authorities in the World Trade Network
increased in the latter half of the for the four major countries:
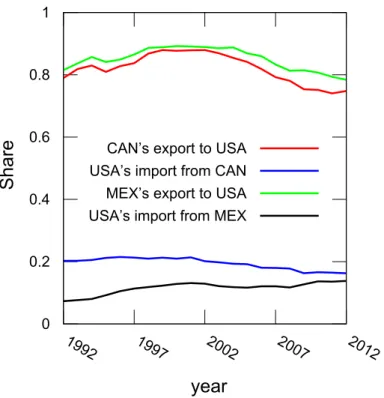
global exports are just 2–3% percent, but their economic hub values are disproportionately high. In terms of weighted HITS hub score, Canada remained the second highest in the ranking, while Mexico rose from tenth to third with the establishment of NAFTA in1994, which gave Canada and Mexico easier access to the market of the United States, the country with the high weighted HITS authority value in the world. This means that Canada and Mexico are in a special position because of their relations with the United States. This reflects the fact that the weighted HITS hub values are affected by the network structure of world trade. Figure 9 lists the major exporting countries to the United States along with their weighted HITS hub values (upper number) and percentage of exports to the United States (lower number). For instance, Canada’s weighted HITS hub score is
0:0842, and 74:80% of its exports are to the United States. Mexico’s weighted HITS hub score is0:0699, and78:40% of its exports are to the United States. With this figure, we can verify that Canada’s and Mexico’s shares of exports to that of the United States are remarkably higher than other countries’. We also find that this tendency has held for 21 years, as demonstrated in Figure 11.
On the other hand, we check the relation to the highest weighted HITS hub country, mainland China. In this case, Hong Kong offers a good example as an importer. We can elucidate this fact more clearly by comparing Hong Kong to Japan. Hong Kong’s weighted HITS authority value is0:0816, while its import share is only 0:0355. Japan’s weighted HITS authority value is
0:0507and its import share is0:0451. What causes the differences? The share of imports from China is the answer (Figures 10 and 12). Figure 10 shows the weighted HITS authority of China’s
major export countries and the percentage of imports from China and Figure 12 shows the time evolution of Hong Kong’s and Japan’s import shares for overall trade from China. From these figures, we can confirm that Hong Kong’s import share from China changed drastically in21years. During this period, Hong Kong’s authority ranking position increased from tenth to second (see Table 4). On the other hand, in the case of Japan, the moderate change of its share raised its ranking from ninth to fourth (see Table 4). Hong Kong’s rapid change implies that it has taken advantage of transit trade. In other words, Hong Kong has grown into a China’s most important export channel to the world. From these examples, we find that the weighted HITS hub and authority values are larger than the shares of the export/import ratio in each country if the main contributor’s conjugate weighted HITS value is high.
Emergence of China
As our final topic, we consider the changes of China. The most striking change over the last two decades in the WTN has been the rise of China. China has become the largest weighted HITS hub country. Hong Kong and China ranked second and third respectively (and Macao is eighty-second), for authority in2012. This means that many countries with high hub values have increased their exports to Hong Kong and China as both have become able to afford to import huge amounts of foreign goods. China has increased its purchasing power for foreign goods because of the rapid increase of its national income. In other words, China has become one of the world’s most important markets.
What if we put China, Hong Kong and Macao together in order to observe the hub and authority of greater China? Figure 13 shows the transition of the weighted HITS hub (13A) and authority (13B) after merging China, Hong Kong and Macao. Comparing Figures 13A and 5B, the combined hub value is nearly twice as high as the export value in the1990s and almost same in the2010s. Furthermore, the weighted HITS authority value does not change much after consolidating their trade data (see Figures 13B and 7B). This is because bilateral trade between
China and Hong Kong is very large and their internal trade has a greater effect on them than on other countries. Thus the large amount of trade between China and Hong Kong cancels out when the two nodes are merged.
Conclusion
We introduced the weighted HITS hub and authority as mathematical definitions of the economic hub and authority. With Figure 9. Major Exporters to the United States; Hub Values and Export Shares.The upper number is the weighted HITS hub value and the lower number is the share of exports to the United States. Abbreviations are as follows, ‘‘CAN = Canada’’, ‘‘MEX = Mexico’’, ‘‘CHN = China’’, ‘‘JPN = Japan’’, ‘‘GBR = United Kingdom’’, ‘‘DEU = Germany’’, ‘‘BRA = Brazil’’, ‘‘KOR = Republic of Korea’’, ‘‘NLD = Netherlands’’ and ‘‘HKG = Hong Kong’’ and ‘‘USA = United States.’’
doi:10.1371/journal.pone.0100338.g009
these values, we elucidated the changes of WTN over the last21
years. The United States has been the largest economic authority in the global trade network and the largest destination of world exports. The authority value of the United States increased in the latter half of the1990s because of the advent of the New Economy, which was driven by the IT revolution. It began to decline in the wake of the burst of the IT Bubble in2000. On the other hand, China has changed the structure of the WTN, particularly since
2001, by dramatically increasing its trade volume and number of
trading partners. China’s rise is reflected in the weighted HITS network analysis. China now has the world’s largest hub value and the third largest authority value. In terms of changes of its hub and authority value, China is transforming itself from the ‘‘factory of the world’’ to the ‘‘market of the world.’’ Korea’s authority value places it in the top6, reflecting its increased national income and high economic growth. European countries fell in the ranking of authority values, reflecting the increased difficulty for outsiders to export to EU countries: EU countries benefit from free trade by Figure 10. Major Export destinations of China; Authority Values and Import Shares.The upper number is the weighted HITS authority value and the lower number is the share of imports from China. Abbreviations are as follows, ‘‘USA = United States’’, ‘‘HKG = Hong Kong’’, ‘‘JPN = Japan’’, ‘‘KOR = Republic of Korea’’, ‘‘DEU = Germany’’, ‘‘NLD = Netherlands’’, ‘‘IND = India’’, ‘‘GBR = United Kingdom’’, ‘‘RUS = Russian Federation’’ and ‘‘SGP = Singapore’’ and ‘‘CHN = China.’’
non-tariff or preferential tax schemes within the EU region, but outsiders cannot. Thus, EU countries have tended to trade more with other EU countries. This is called the trade diversion effect, a consequence of regional economic integration. Japan’s authority value increased slowly in2000–2012, but its hub value declined.
These changes are consistent with Japan’s change from an export-driven economy in its high economic growth era in the latter half of the twentieth century to a more mature, more balanced nation. Mexico and Canada have larger hub values than linearly expected from their exports because of their relations with the United Figure 11. Changes of Export and Import Shares from Canada/Mexico to the United States.Export Share means the share of Canada/ Mexico’s exports to the United States and Import Share means the share of the United States’ imports from Canada/Mexico.
doi:10.1371/journal.pone.0100338.g011
Figure 12. Changes of Export and Import Shares from China to Hong Kong/Japan.Export Share means the share of China’s exports to Hong Kong/Japan and Import Share means the share of Hong Kong/Japan’s imports from China.
doi:10.1371/journal.pone.0100338.g012
States. The hub value of Mexico grew rapidly in this era, indicating that NAFTA, which was established in1994, has had an impact on the amount of trade and the link structure. We also find that the Hong Kong’s weighted authority becomes larger because of its relation with China. This suggests that Hong Kong has grown as into one of the most important export channels in the world. Hypothetically, the virtual integration of China, Hong Kong and Macao does not make a substantial impact on weighted values, and particularly has less impact on authority value. This is because the huge amount of trade between China and Hong Kong cancels out when the two nodes are merged.
In this paper we showed time evolution of world trade in terms of hub-authority, and we found that some of typical behaviors are consistently explained by changes in countries and international relations. As these changes are rather slow taking several years typically, it will be a promising next work to make a numerical model which can predict hub-authority values in the near future.
Author Contributions
Conceived and designed the experiments: TD KT HT MT. Performed the experiments: TD. Analyzed the data: TD. Wrote the paper: TD KT HT MT.
References
1. Krugman PR, Obstfeld M, Melitz M (2011) International Economics (9th Edition). Prentice Hall.
2. Ministry of Economy, Trade and Industry of Japan (2011) White Paper on International Economy and Trade 2011.
3. Benedictis LD, Tajoli L (2011) The World Trade Network. The World Economy 34: 1417–1454.
4. League of Nations (1942) The World Trade Network. Princeton University Press.
5. Newman M (2010) Networks: An Introduction. New York, NY, USA: Oxford University Press, Inc.
6. Caldarelli G (2007) Scale-Free Networks: Complex Webs in Nature and Technology. Oxford University Press.
7. Serrano MA, Bogun˜a´ M (2003) Topology of the world trade web. Phys Rev E 68: 015101.
8. Li X, Jin YY, Chen G (2003) Complexity and synchronization of the World trade Web. Physica A: Statistical Mechanics and its Applications 328: 287–296. 9. Garlaschelli D, Loffredo MI (2004) Fitness-Dependent Topological Properties of
the World Trade Web. Phys Rev Lett 93: 188701.
10. Garlaschelli D, Loffredo MI (2005) Structure and evolution of the world trade network. Physica A: Statistical Mechanics and its Applications 355: 138–144. 11. Garlaschelli D, Di Matteo T, Aste T, Caldarelli G, Loffredo MI (2007) Interplay
between topology and dynamics in the World Trade Web. The European Physical Journal B 57: 159–164.
12. Fagiolo G, Reyes J, Schiavo S (2009) World-trade web: Topological properties, dynamics, and evolution. Phys Rev E 79: 036115.
13. Fagiolo G, Reyes J, Schiavo S (2010) The evolution of the world trade web: a weighted-network analysis. Journal of Evolutionary Economics 20: 479–514. 14. Barigozzi M, Fagiolo G, Garlaschelli D (2010) Multinetwork of international
trade: A commodityspecific analysis. Phys Rev E 81: 046104.
15. He J, Deem MW (2010) Structure and Response in the World Trade Network. Phys Rev Lett 105: 198701.
16. Barigozzi M, Fagiolo G, Mangioni G (2011) Identifying the community structure of the international-trade multi-network. Physica A: Statistical Mechanics and its Applications 390: 2051–2066.
17. Squartini T, Fagiolo G, Garlaschelli D (2011) Randomizing world trade. I. A binary network analysis. Phys Rev E 84: 046117.
18. Squartini T, Fagiolo G, Garlaschelli D (2011) Randomizing world trade. II. A weighted network analysis. Phys Rev E 84: 046118.
19. Ermann L, Shepelyansky DL (2011) Google matrix of the world trade network. arXiv preprint arXiv:11035027.
20. Wei W, Liu G (2012) Bringing Order to the World Trade Network. In: IPEDR Proceedings. Singapore: IACSIT Press, 28, p. 88.
21. Kleinberg JM (1999) Authoritative sources in a hyperlinked environment. J ACM 46: 604–632.
22. Easley D, Kleinberg JM (2010) Networks, Crowds, and Markets: Reasoning About a Highly Connected World. New York, NY, USA: Cambridge Univ Press.
23. Ohnishi T, Takayasu H, Takayasu M (2009) Hubs and Authorities on Japanese Inter-Firm Network: Characterization of Nodes in Very Large Directed Networks. Progress of Theoretical Physics Supplement 179: 157–166. Figure 13. Hub and Authority Values of Greater China after Merging Hong Kong and Macao into China.
24. Miura W, Takayasu H, Takayasu M (2012) The origin of asymmetric behavior of money flow in the business firm network. The European Physical Journal Special Topics 212: 65–75.
25. International Monetary Fund, Direction of Trade Statistics website. Available: http://www.imf.org/external/data.htm. Accessed: 2014 Jun 27.
26. Brin S, Page L (1998) The anatomy of a large-scale hypertextual Web search engine. Computer Networks and ISDN Systems 30: 107–117.
27. Page L, Brin S, Motwani R, Winograd T (1999) The PageRank Citation Ranking: Bringing Order to the Web. Technical Report 1999–66, Stanford InfoLab. Available: http://ilpubs.stanford.edu: 8090/422/.
28. Henzinger M (2001) Hyperlink analysis for the Web. Internet Computing, IEEE 5: 45–50.
29. Noland M (1995) US-Japan Trade Friction and its Dilemmas for US policy. World Economy 18: 237–267.
30. Kawai M, Urata S (1998) Are trade and direct investment substitutes or complements? An empirical analysis of Japanese manufacturing industries. Economic development and cooperation in the Pacific Basin: Trade, investment, and environmental issues: 251–293.
31. Takahashi K, Urata S (2010) On the use of FTAs by Japanese firms: further evidence. Business and Politics 12.