ECONOMIC EVALUATION:
LIFE CYCLE OF THE
NATIONAL GAMES ROAD
MRS. VIDYA NITIN PATIL
Lecturer in Civil Engineering Department AISSMS’s Institute of Information Technology,
Kennedy Road Pune 411 001. [email protected]
ABSTRACT: In response to the growing importance of sustainable undertaking, purchasing and building,
designers, consultants and pavement managers now tend to make more rational decisions than before when comparing the pros and cons of the construction, maintenance and management of various types of road pavements. Asphalt and concrete pavements offer specific advantages that need to be compared when selecting the most favorable option for long-life pavements. Financial decisions can be based on life cycle cost. Life Cycle Cost analysis is to arrive at such an economic equitable assessment of competing design alternatives and it further useful for budget planning. The paper describes life cycle cost analysis of the assets of road pavement by using present worth method. The information regarding the user cost and vehicle operating cost as per IRC recommendation is also discussed in detail.
KEYWORDS: Life cycle, life cycle management, life cycle costing, economic evaluation, present worth method,
vehicle operating cost.
1.0 INTRODUCTION:
Each of the components and their sub components has been analysed on the basis of life cycle management by optimising the expenditure on maintenance, renewal and capital developments. Pavements consist of approximately 60% of the total asset value (Ramesh 1999). For this reason more modelling and research has been undertaken for pavements.
The funding requirements from the analysis of each component provide the net predicted funding required each year covered by the plan.The life cycle analysis has also established that approximately 15% of the pavement infrastructure is in a high risk category beyond the 1st ten years of the plan and ramping up of renewal expenditure will be required in the future to maintain service levels (Fwa 2001).
Capital works that is the construction or acquisition of new assets, although treated separately, interact with optimised whole of life and maintenance strategies. This effect has been taken into account as each component was analysed.
2.0 SCOPE & BACKGROUND:
The cost of construction of pavement is a major criterion for choice of pavement type, flexible or rigid, particularly when the funds are scarce and the government funding is limited. It is therefore required to examine the economics of various pavement types not only for the initial construction cost but also for the life cycle costs which includes the discounted maintenance and overlay costs that are incurred during the design life of the pavement. The cost of pavement thus includes a) initial construction Cost b) Maintenance and Rehabilitation/Strengthening Costs. The choice of appropriate economically advantageous pavement type, flexible or rigid, is made by carrying out Life Cycle Cost (LCC) analysis which takes in to account the initial investment cost plus the maintenance/ rehabilitation cost over the design life of the pavement structure. Life cycle cost analysis is a procedure by which a pavement design alternative will be selected which will provide a satisfactory level of service at the lowest cost over design life. The economic analysis methods used most commonly for this purpose include present worth, annualized cost, and rate of return. The analysis is most sensitive to the factors of inflation, discount rate, and analysis period. In the subsequent paragraphs an attempt has been made to study the long-term economic viability of pavement types using Present-Worth method of analysis.
3.0 METHODS OF ECONOMIC EVALUATIONS:
involvement, institution development, and negotiation between stakeholders. We frequently perform economic evaluation. Virtually any consumer, business or public policy decision involves some sort of economic analysis. For minor decisions it may be sufficient to perform such analysis in your head or to use standard guidelines, but when making major decisions it is helpful to follow a more explicit and comprehensive process to insure that all significant impacts (costs, benefits and equity effects) are considered. Economic evaluation can be performed well, or it can be performed badly. Transportation decisions are frequently criticized for inadequate and biased economic analysis. There are various methods of economic analysis that are applicable to the evaluation of alternative pavement design strategies.
i. Equivalent uniform annual cost method, often simply termed the “ Annual cost method” ii. Present worth method for
a) Cost b) Benefits, or
c) Benefits minus costs, usually termed the “net present worth” or “ net present value method” iii. Rate- of – return method
iv. Benefit- cost ratio method v. Cost – effectiveness method
3.1 Life Cycle Cost Analysis:
The life cycle of any component is defined as the period of time that the component remains able to sustain the desired level of service. This is the period when regular maintenance is undertaken to maintain serviceability until renewal becomes necessary. The life cycle for the component ends when it is no longer economic to maintain the component and thus the maximum economic design life has been reached. Life cycles may be extended by rehabilitation (Novick 2003).
Life cycle cost analysis as defined by Indian Standard 13174 Part I, “Life cycle Cost Analysis is a method to arrive at such an economic and equitable assessment of competing design alternatives”. It takes into account every significant element of cost over the total entire operating life, expresses in monetary units applicable to a given base date. Given equal levels of performance the Life Cycle Cost comparison will then itself enable decisions being made. Where levels of performance vary, the Life cycle Costing can be related to specific units of performance in such a way as to enable optimum decisions.
The pavement has 4 main cost components (IS: 13174 Part II 1994) Cost of construction
Cost of Right of Way Road user Cost Cost of maintenance. Salvage value
Life cycle cost analysis is applied when an agency undertakes a project and is seeking to determine the lowest life-cycle-cost (i.e., most cost-effective means) to accomplish the project's objectives. Life cycle cost analysis enables the analyst to make sure that the selection of a design alternative is not based solely on the lowest initial costs, but also considers all the future costs (appropriately discounted) over the project's usable life. Life cycle cost analysis is used appropriately to select from among design alternatives that would yield the same level of performance or benefits to the project's users during normal operations. If benefits vary among the design alternatives (e.g., they would accommodate different levels of traffic), then the alternatives cannot be compared solely on the basis of cost. Rather, the analyst would need to employ benefit-cost analysis (BCA), which measures the monetary value of life-cycle benefits as well as costs. Accordingly, Life cycle cost analysis should be viewed as a distinct; cost is only a subset of BCA (Arditi1996). Even with these restrictions, however, Life cycle cost analysis has many useful applications.
3.2 Cost of Construction:
This includes construction of main asset components like road pavement, bridges, culverts and railways over bridges, bridge approaches and miscellaneous items, which form part of the road. It also includes cost of construction of different asset components like divider, footpath, cycle track, traffic signals, electrification, cross drainage works etc. As pavement alone carries 60% cost of the total asset cost, valuation of the pavement shall be considered (Ramesh 1999).
3.3 Cost of Right of Way:
3.4 Road user Cost:
The road improvements mainly benefit those owners and users who travel the road and expressway. These benefits are in the form of road user benefits such as vehicle operating costs saving, value of travel time, saving in accident costs, saving in maintenance costs (CRRI 1882) where as the social benefits are in the form of preference item of comfort, convenience, satisfaction and lessening of travel strains on users, improvement in general economy and growth (Rosenberge 2000). Also on road improvements, higher average speeds can be maintained which may lead to saving of fuel consumption. Tyre last longer on improved road surfaces and there is a reduction in wear and tear of vehicles. The vehicle operation cost components are depending on fuel lubricant, tyres, spare parts, maintenance, labour, depreciation wages of crew and fixed costs including overheads, administration, and interest on borrowed capital.
Vehicle operation cost for parts, tyres increases with roughness of the pavement. There is significant cost difference between paved and unpaved road and for smooth and rough pavement of the same type. Increase in the roughness ultimately results in the increase in fuel consumption. Other causes of high user costs are delay cost resulting through slow traffic movement caused by construction and maintenance activities and extra cost due to closing of section of road during major repairs. Vehicle operation cost also increases when a longer alternative route is used and where traffic is stopped by construction, maintenance or rehabilitation.
3.5 Cost of maintenance:
There are various maintenance operations which are carried out for a road. Maintenance of pavement structure, shoulders, drainage, erosion, vegetation plus snow and ice control are some of the major categories. For pavement economic analysis only those categories of maintenance which directly affect the performance of a pavement should be considered. This normally includes maintenance of pavement surface, shoulders and related drainage.
Maintenance Costs are the estimation of all costs which are essential to maintain the pavement investment at a desirable specified level of service. The level of maintenance i.e. the type and extent of maintenance operations, determines the rate of loss of riding quality or serviceability index (Roge 2004).
This work is generally undertaken to extend the service life of the existing facility. This includes placement of additional surfacing material and / or other work necessary to return an existing roadway, including shoulders to a condition of structural or functional adequacy. This could include the partial removal and replacement of the pavement structure (Ramesh 1999).
Pavement rehabilitation includes activities in restoration and rehabilitation of a pavement. Cost data required to calculate the rehabilitation costs is the same as that is required for the initial constructions .Rehabilitation of the pavement is generally carried out -
a) When the pavement has existed for years and long term improvements are needed this type of rehabilitation will be similar to new construction.
b) The second situation is difficult to identify due to in ability to accurately predict the time of rehabilitation in future. Pavement performance studies have to be used for accurate prediction.
Rehabilitation cost includes future overlays and or upgrading which is necessary when the riding quality of
a pavement decreases to a certain minimum level of acceptability index (PSI) of 2.5. Pavement rehabilitation work shall not include normal periodic maintenance activities. Periodic maintenance is
interpreted to include such items as resurfacing less than some specified inch thickness or of short length patching, filling potholes, sealing cracks and joints or repair of minor failures and undersealing of concrete slabs other than as an essential part of rehabilitation and other work intended primarily for preservation of the existing roadway( MOST 1989).
3.6 Salvage Value:
Due to the nature of pavement it is always not possible that each alternative have its life used up precisely at the end of the analysis period. One or more alternative may have some remaining value of life at a time (IS: 13174 Part II 1994).
4.0 STEPS TO COMPUTE ROAD USER COST (AS PER IRC SP 30): Step 1) Collect following data,
a)Traffic volume of each class of vehicles b)Traffic growth rate
c)Roughness of pavement surface d)Pavement width
e)Geometry (rise and fall or curvature)
f)Congestion factor (for computation of vehicle operation cost )
Step 2) Project traffic volumes of al category of vehicles to the year of the computation of Vehicle operation cost.
Step 3) Update the vehicle operation values to that year.
Step 4) Calculate VOC for time and distance related costs by multiplying values from Step 2 and 3.
5.0 EQUATIONS FOR ECONOMIC ANALYSIS BY PRESENT WORTH METHOD:
The present worth of costs method is directly comparable to the equivalent uniform annual cost method for comparable condition e.g. costs, discount rates and analysis periods. The present worth method can consider costs alone, benefits alone, or costs and benefits together. It involves the discounting to all future sums to the present, using an appropriate discount rate. The factor for discounting either costs or benefits is
Pwf in = 1 / (1+ i) n
Where, Pwf in = present worth factor for particular i & n.
i = discount rate.
n = number of years to when the sum will be expanded or saved.
The present worth of costs is used in the equivalent uniform annual cost method when additional capital expenditures occur before the end of the analysis period i.e. when the service life is less than the analysis period and future rehabilitation such as overlays or seal coats is needed .
It is questionable for pavement whether or not to consider non user benefits and indirect user benefits can be measured adequately. Perhaps it is reasonable to consider only direct user benefits until such time as the state of the art is sufficiently advanced to allow the other factors to be measured.
The net present value method follows from the foregoing methods because it is simply the difference between the present worth of benefits and the present worth of costs. Obviously, benefits must exceed costs if a project is to be justified on economic grounds. The equation for net present value is :-
NPV = TPWB x1 n - TPWC x1n
Where NPV = net present value of road x1
TPWB x1 n = total present worth of benefits for road x for an analysis period of n years.
TPWC x1n = total present worth of costs for road x1 for an analysis period of n years.
The net present value method is preferred for the transportation field. Although there are some limitations to the method, the advantages outweigh the disadvantages. Thus it is preferred approach for evaluating alternative pavement strategies when public investments are involved. There are a number of advantages inherent in the net present value method that makes it perhaps the most feasible for the road field in comparison to the “traditional” annual cost and benefit – cost methods (David 2002).
6.0 LIFE CYCLE COST ANALYSIS OF NATIONAL GAME ROAD IN PUNE:
National Game Road in Pune is selected for study. The details of this road are given in Table no 6.1. The LLC analysis is done for single alternative in this paper. The same methodology can be used for number of designs for selection of the best alternative (Desai 2008).
The most common method used for such analysis is present worth, which discounts costs incurred at any time back to the present this requires the use of a discount rate to reduce the value of future currency in relation to present currency to account for the time value of money. This rate takes into account the fact that money earns money through accrued interest over and above the inflation rate. The discount rate used in the analysis is 7%.
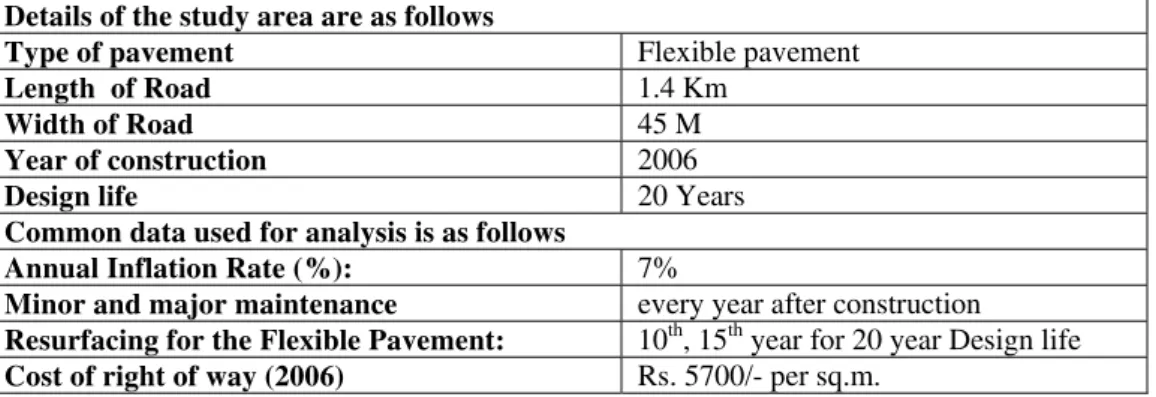
Table 6.1: Details of analysis and study area Details of the study area are as follows
Type of pavement Flexible pavement
Length of Road 1.4 Km
Width of Road 45 M
Year of construction 2006
Design life 20 Years
Common data used for analysis is as follows
Annual Inflation Rate (%): 7%
Minor and major maintenance every year after construction Resurfacing for the Flexible Pavement: 10th, 15th year for 20 year Design life Cost of right of way (2006) Rs. 5700/- per sq.m.
1 Capital cost and cost of right of way:
2. Maintenance cost:
Minor and major maintenance are to be done every year after construction and resurfacing is done on 10th and 15th year of road.
i. Maintenance Cost (Minor and Major):
Pavement maintenance costs are computed for the National Game road, Pune. Minor and Major Maintenance cost increases with the age of the pavement. To simplify the calculations, an annually increasing (linear) maintenance cost has been assumed.
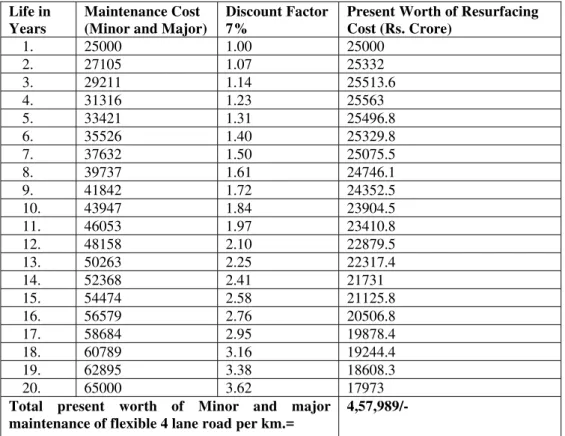
For Flexible pavement these values are Rs. 25000 to 65000 from 1st year after construction to 20th year after construction. These maintenance figures are per km for a 4 lane facility road i.e. 45m wide flexible pavement. A sample calculation to determine present value of the Different costs at today’s worth by considering inflation rate 7%. For this the present worth method is used. The same thing is presented in simple format in the Table 6.2. Discounting the maintenance costs to present worth is as follows,
Maintenance cost for Flexible Pavement:
= (25000/1.070 + 29444/1.071 + 33889/1.072+…….+65000/1.079) + (25000/1.0710 + 35000/1.0711 + … + 65000/1.0714) + (25000/1.0715 + 35000/1.0716 + …+ 65000/1.0719) = Rs.4,57,989/- per Km.
ii. Resurfacing cost:
Flexible pavement requires resurfacing(s) at 10 and 15 years. The total cost for the resurfacing including shoulder upgrading and for the flexible pavement resurfacing is Rs.85,92,000/- per km i.e. for 45m wide road. This is at today’s rates but the work will not be done now, so this cost must be converted to present worth using 7 % Discount Factor and the LCC can be determined as below:
= 85,92,000/1.0710 +85,92,000/ 1.0715 = Rs.74,81,873/- per km
Using a discount rate of 7 %, this amount is as shown in table No Table 6.3. The total maintenance costs are calculated and presented in Table 6.4
iii. Vehicle Operation Cost:-
Vehicle Operation Cost has been expressed as the benefits in terms of VOC saving for vehicular traffic using the project road and time saving for passengers and goods in transit for the analysis period of 20 years.
The VOC computation takes into account pavement characteristics, geometric conditions and vehicle characteristics. The time saving for passengers vehicles has been derived using an average occupancy of 3.23 persons for car and 45 persons for bus. The value of time for passengers and goods considered in the analysis has been based on earlier studies carried out in recent years. For the average car passenger, time value has been taken as Rs. 30 per hour and for the average bus passenger as Rs. 10 per hour. For goods in transit the time value is worked out to Rs. 2.5 per hour for L.G. V. Rs. 6.0 per hour for HCV and Rs.10.0 per hour for multi axle vehicle.
Whereas it is quite easy and straightforward to calculate agency costs, it is sometimes difficult to calculate user costs because some of the parameters used in this operation such as the value of time or of an accident are controversial. According to David 1999 vehicle operating costs for a road project are not more than 55%. There are limitations on determination of the vehicle operating cost because of lack of availability of data required to determine the same (David 2002).
iv. Salvage Value
The final item in such cost analysis is salvage value at the end of the performance period, which in this instance is 20 years. In any event, discounting back from as far out as 20 years results in a reduction to only 13 % of the capital cost.
v. Result & Discussion of Life Cycle Costs of the Road:
Table 6.2: Present Worth of Minor and Major Maintenance cost for Flexible Pavement
Life in Years
Maintenance Cost (Minor and Major)
Discount Factor 7%
Present Worth of Resurfacing Cost (Rs. Crore)
1. 25000 1.00 25000
2. 27105 1.07 25332
3. 29211 1.14 25513.6
4. 31316 1.23 25563
5. 33421 1.31 25496.8
6. 35526 1.40 25329.8
7. 37632 1.50 25075.5
8. 39737 1.61 24746.1
9. 41842 1.72 24352.5
10. 43947 1.84 23904.5
11. 46053 1.97 23410.8
12. 48158 2.10 22879.5
13. 50263 2.25 22317.4
14. 52368 2.41 21731
15. 54474 2.58 21125.8
16. 56579 2.76 20506.8
17. 58684 2.95 19878.4
18. 60789 3.16 19244.4
19. 62895 3.38 18608.3
20. 65000 3.62 17973
Total present worth of Minor and major maintenance of flexible 4 lane road per km.=
Table No 6.3 Maintenance and Resurfacing Cost for Flexible Pavements in Rs. Per km
Table 6.4: Total Maintenance cost for Flexible Pavement
6.5 Summary of Life cycle cost of the National Games Road Life cycle cost of the National Games Road
a) Construction cost of Road / Km. 8.22 Crore Rs.
b) Cost of Right of way (Rate- Rs. 5,700/- & Area-63000 Sq.m.) 35.91 Crore Rs.
c) Maintenance cost 1.86 Crore Rs.
d) Salvage value (13%) 1.07 Crore Rs.
SN Year Maintenance Activity Maintenance Resurfacing
Cost Rs / km Cost Rs / km
0 2006 Construction -- --
1 2007 Maintanance 25000
2 2008 Maintanance 25332
3 2009 Maintanance 25513.6
4 2010 Maintanance 25563
5 2011 Maintanance 25496.8
6 2012 Maintanance 25329.8
7 2013 Maintanance 25075.5
8 2014 Maintanance 24746.1
9 2015 Maintanance 24352.5
10 2016 Resur& Maint 23904.5 4367737
11 2017 Maintanance 23410.8
12 2018 Maintanance 22879.5
13 2019 Maintanance 22317.4
14 2020 Maintanance 21731
15 2021 Resur& Maint 21125.8 3114136
16 2022 Maintanance 20506.8
17 2023 Maintanance 19878.4
18 2024 Maintanance 19244.4
19 2025 Maintanance 18608.3
20 2026 Maintanance 17973
21 2027 Reconstruction of the road
Total cost for 20 years ( Rs. /Km) 457989 74,81,873
Total Cost for 1.4 km length ( Rs.) 6,41,184/- 1,04,74,622
Maintenance cost + Resurfacing cost for 20 years for 1.4 km
length ( Rs.) 1,85,97,679/-
Maintenance cost + Resurfacing cost for 20 years for 1.4 km
length Crore 1.86 Crore Rs.
Life in Years
Resurfacing Cost Discount Factor 7% Present Value of Resurfacing Cost (Rs.)
10 8592000 1.97 4367737
15 8592000 2.76 3114136
Total Rs. 7481873
7.0 CONCLUSION:
The present worth of life cycle cost of the National game road is 47.06 Crore Rs. Life Cycle Cost Analysis is the useful tool in the following situations,
1)To assist in phasing the road program over a period of time depending upon availability of the resources. 2)Compare mutually exclusive schemes and select. To determine whether a scheme under a consideration is worth investment at all.
3)To evaluate alternative strategies such as stage construction or full construction alternative. Specifications such as flexible pavement or rigid pavement, alternate policies such as increased outlay on maintenance or increased outlay on rehabilitation, alternative design standards and alternative policy options on axle load. The data of the Life Cycle cost analysis can be use as an input to the Pavement Management System.
References:
[1] Arditi, D., and Messiha, H. M. (1996). ‘‘Life-cycle costing in municipal construction projects.’’ J. Infrastruct. Sys., 2(1), 5–14. [2] David Arditi, Member, ASCE, and Hany Mounir Messiha. (2002). Life Cycle Cost analysis (LCCA) in Municipal Organizations.
Journal of infrastructure systems / march, 1-10.
[3] Desai Vidya, Raval P.M. (2008). Sustainable road asset management plan. Proceeding of International conference, Best practice of relief congestion on mixed traffic urban streets in developing contries, IIT Madras, Chennai, India, 201-210. Sept. 12-15.
[4] Fwa, T., and Sinha, K. (2001). ‘‘Pavement performance and life-cycle cost analysis.’’ J. Transp. Engrg., 117(1), 33–46.
[5] Indian Road Congress Mannual: 82 (1982). Code of practice for Maintenance of Flexible pavements, The Indian Road Congress, Jamnagar House, Shahajahan Road, New Delhi.
[6] Indian Standard 13174 part I (1991).Life Cycle Costing – Terminology, Bureau of Indian Standard, New Delhi, India. [7] Indian Standard 13174 part II (1994). Life Cycle Costing - Methodology Bureau of Indian Standard, New Delhi, India.
[8] Novick, D. (2003). ‘‘Life cycle considerations in infrastructure management.’’ FHWA Life Cycle Cost Symp., Federal Highway Administration, Washington, D.C.
[9] Ramesh C. R., A Veeraragavan, R., Sridhar J. L. & Chandrashekhar L. S.( 1999). Life Cycle Costing of Pavements for Planning Maintenance budget. Indian Road Congress Journal, pp 323- 352, May.
[10] Roger B. (2004) Best practice management plan for infrastructure assets- Asset Management system. ASCE Journal of Transportation Engineering, Vol 117 Pp 33-45.
[11] Rosenberg, N. (2000). ‘‘Technical issues in the use and application of life cycle cost analysis.’’ FHWA Life Cycle Cost Symp., Federal Highway Administration, Washington, D.C.
[12] Todd Litman(2001). “What’s it worth? Economic Evaluation For Transportation Decision-Making.” Internet Symposium on Benefit-Cost Analysis Transportation Association Of Canada.
[13] Vanier D.J. And Danyl N.H. (2005) Municipal Infrastructure Investment Planning: Asset Management. In Habitat International Journal, Vol.20, No.3, pp.405-420, September.