INDICATORS
in decisions ofTECHNOLOGY
INNOVATION
of technology innovation
by
Print on Demand 2017 – Gedruckt auf FSC-zertifiziertem Papier
ISBN 978-3-7315-0478-8
This document – excluding the cover, pictures and graphs – is licensed under a Creative Commons Attribution-Share Alike 4.0 International License (CC BY-SA 4.0): https://creativecommons.org/licenses/by-sa/4.0/deed.en
The cover page is licensed under a Creative Commons
Attribution-No Derivatives 4.0 International License (CC BY-ND 4.0): https://creativecommons.org/licenses/by-nd/4.0/deed.en Impressum
Karlsruher Institut für Technologie (KIT) KIT Scientific Publishing
Straße am Forum 2 D-76131 Karlsruhe
KIT Scientific Publishing is a registered trademark of Karlsruhe Institute of Technology.
Reprint using the book cover is not allowed.
Abstract
This book presents the result of the research conducted to understand the role of indicators in decisions of technology innovation. A gap was detect-ed in the literature of innovation and technology assessment about the use and influence of indicators in this type of decision. It was important to address this gap because indicators are often frequent elements of innova-tion and technology assessment studies. The research was designed to determine the extent of the use and influence of indicators in decisions of technology innovation, to characterize the role of indicators in these deci-sions, and to understand how indicators are used in these decisions. The latter involved the test of four possible explanatory factors: the type and phase of decision, and the context and process of construction of evidence. Furthermore, it focused on three Portuguese innovation groups: public researchers, business research, development and innovation (R&D&I) leaders and policymakers. The research used a combination of methods to collect quantitative and qualitative information, such as surveys, case studies, and social network analyses.
innovation and technology assessments studies, in particular when contex-tualised, described in detail, and with discussion upon the options made.
Table of contents
Abstract ... i
List of figures ... v
List of tables ... vii
List of acronyms ... ix
Preamble ... xi
1 Introduction ... 1
2 Theoretical framework ... 7
2.1 Evidence and indicators ... 7
2.1.1 The use of evidence ... 8
2.1.2 The rise of quantification ... 13
2.1.3 Merits and limitations of indicators ... 19
2.1.4 The role of indicators... 27
2.2 Decisions of technology innovation ... 42
2.2.1 Technology innovation ... 42
2.2.2 Innovation actors ... 45
2.2.3 Decision process ... 54
2.2.4 Types of decisions of technology innovation ... 68
2.3 Conclusion ... 71
3 Methods ... 75
3.1 Surveys ... 80
3.1.1 Self-administered questionnaires ... 84
3.1.2 Standardized interviews ... 87
3.2 Case studies ... 87
3.3 Complementary interviews ... 92
4 Results ... 93
4.1 What is the influence of indicators?... 93
4.1.2 Influence ... 94
4.2 What is the role of indicators? ... 99
4.3 How are indicators used? ... 107
4.3.1 Type of decision ... 107
4.3.2 Phase of decision ... 112
4.3.3 Context and process of construction of evidence ... 117
5 Conclusions and discussion ... 161
Bibliography ... 173
Annexes Annex 1 – Questionnaires ... 209
Questionnaire of the researchers group ... 210
Questionnaire of the business R&D&I leaders group ... 213
Questionnaire of the policymakers group ... 216
Annex 2 – Supplementary figures ... 219
The Mobi.E core-periphery ... 220
The Mobi.E factions ... 221
The INL core-periphery... 222
The INL factions ... 223
Annex 3 – Supplementary tables ... 225
Annex 4 – Ucinet files ... 231
Ucinet Log 1 – Multiple Cohesion measures Mobi.E ... 232
Ucinet Log 2 – Multiple Centrality Measures Mobi.E ... 233
Ucinet Log 3 – Core-Periphery Mobi.E ... 235
Ucinet Log 4 – Factions Mobi.E ... 237
Ucinet Log 5 – Multiple Cohesion measures INL ... 240
Ucinet Log 6 – Multiple Centrality measures INL ... 241
Ucinet Log 7 – Core-Periphery INL ... 243
List of figures
Figure 2.1: Decisions of technology innovation ... 58 Figure 2.2: Zones of decision-making by certainty and
agreement. ... 65 Figure 4.1: The most relevant types of influences in the
decisions by group ... 98 Figure 4.2: Sociogram of the network of decision-making
in Mobi.E. ... 123 Figure 4.3: Sociogram of the decision-making process of INL. ... 148
Figure A.1: Core and periphery in the network of decision
of Mobi.E. ... 220 Figure A.2: Factions in the network of decision of the Mobi.E. ... 221 Figure A.3: Core and a periphery in the network of decision
List of tables
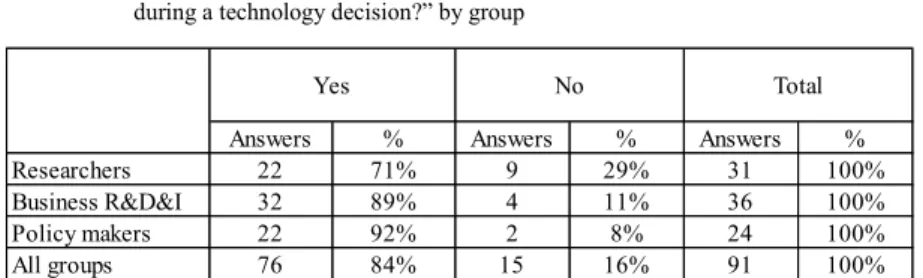
Table 3.1: Summary of the analytical model ... 76 Table 4.1: Number and percentage of answers to the question
“Did you use indicators during a technology
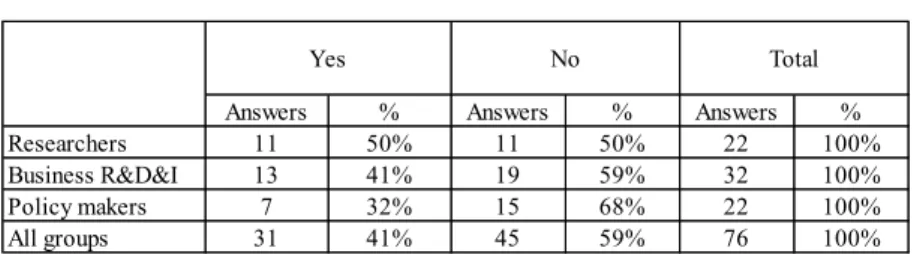
decision?” by group ... 94 Table 4.2: Number and percentage of answers to the question
“Do you think that indicators were more influential
than social relations during the technology
decision?” by group ... 95 Table 4.3: The use and influence of indicators in decisions
by group ... 95 Table 4.4: The most important influences in the decisions
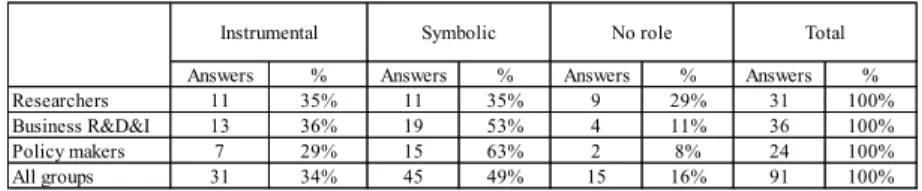
by group ... 97 Table 4.5: The role of indicators in decisions of technology
innovation by group ... 100 Table 4.6: Number and percentage of answers to the question
“Do you consider indicators more influential to the
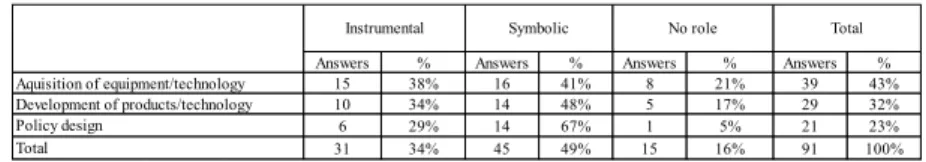
decision than social relations?” by type of decision ... 107 Table 4.7: The role of indicators by type of decisions ... 108 Table 4.8: Answers and percentages of responses to the
question “Please select three types of indicators
most relevant to your decision” by type of decision ... 109 Table 4.9: Number and percentage of answers that agreed that
indicators were more influential than social
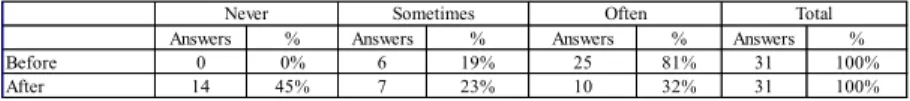
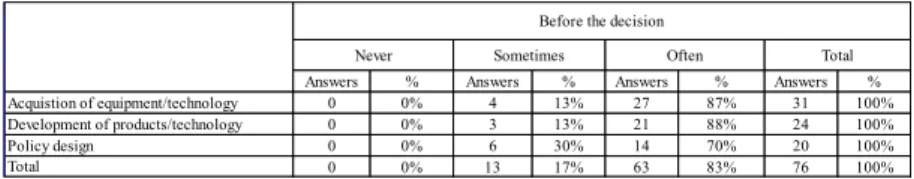
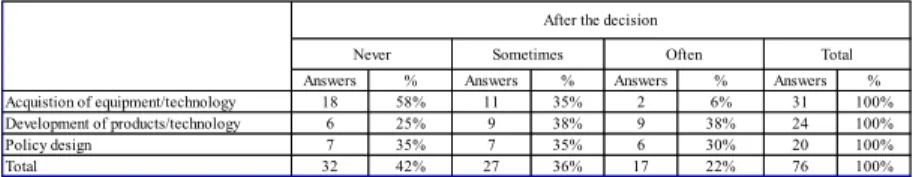
relations before and after the decision ... 114 Table 4.10: Number and percentage of intensity in the use of
indicators before decision by type of decision ... 115 Table 4.11: Number and percentage of the intensity of the use
Table 4.13: Individual centrality measures of the Mobi.E
decision makers ... 127 Table 4.14: Cohesion measures in the decision network of INL ... 150 Table 4.15: Centrality measures for the matrix of relations in
the decision network of INL ... 152 Table 4.16: Comparison between parameters of network
cohesion of Mobi.E and INL ... 158 Table 4.17: Individual eigenvector centrality and betweeness
and their normalized values in the Mobi.E and
INL networks ... 159
Table A.1: Number and percentage of answers who totally agree with the purpose of indicators by type of
decision ... 226 Table A.2: Sociomatrix of the influence between decision
makers of Mobi.E ... 227 Table A.3: Sociomatrix of the influence between decision
makers of INL ... 228 Table A.4: Number and distribution of individuals and females
List of acronyms
BEV Battery electric vehicle
CEIIA Centro de Excelência e Inovação para a Indústria Automóvel
CEO Chief Executive Officer
CI1 to CI4 Complementary Interviews
CO2 Carbon dioxide
EDP Energias De Portugal SA
EIS European Innovation Scoreboard
Mobi.E Electric mobility case
EU European Union
Eurostat Statistical Office of the European Commission
EV Electric Vehicle
GDP Gross Domestic Product
I1to I26 Interviews
ICE Internal Combustion Engine
ICT Information and Communications Technology
ILO International Labour Organization
IRR Internal Return Rate
MRI Magnetic resonance imaging
INL Nanotechnology laboratory case
NIS National Innovation System
OCDE Organisation for Economic Co-operation and Development
OEM Original equipment manufacturer
PI1 to PI12 Preliminary Interviews
R&D Research and Development
R&D&I Research and Development and Innovation
S&T Science and Technology
STI Science and Technology Indicators
TA Technology Assessment
TPP Technological Product and Process
UNDP United Nations Development Programme
UNESCO United Nations Educational, Scientific and Cultural Organization
USA United States of America
VLA Net Present Value
Preamble
This book is the revised output of my doctoral research, developed between 2010 and 2015. It contains the efforts to navigate in a topic still largely unknown to the general audience. When I started the project, research about the way indicators were used in technology innovation was not on the agenda of many researchers and policymakers. Three years later, however, a research group published results about sustainable develop-ment. The topic was sufficiently close to technology innovation to lead me to rewrite some chapters of this book. Presently, the use of indicators to understand technology innovation continues to lack research efforts. The publication of this book aims, therefore, to partially fill this gap, providing the reader with an overview of what is known and what was discovered about a topic central to our technology-intensive contemporary societies.
I would like to acknowledge the institutions who supported this book, namely Fundação para a Ciência e a Tecnologia (PhD scholarship SFRH/BD/76200/2011), the Institute for Technology Assessment and System Analysis of the Karlsruhe Institute of Technology, the Interdisci-plinary Centre of Social Sciences CICS.NOVA of Universidade Nova de Lisboa (UID/SOC/04647/2013) and Direção-Geral de Estatísticas da Educação e Ciência. I also would like to express my gratitude to my PhD supervisors – Professor Dr. António Brandão Moniz of Universidade Nova de Lisboa and Professor Dr. Manuel Laranja of Universidade de Lisboa - for their academic guidance and long-standing support for my work. Last but not least, I would like to express my deepest appreciation to Rita Luzes Torres, my family and many other friends for their continuous and relent-less support to conclude this book.
Lisbon, August 2017
1
Introduction
Indicators exist as a human effort to simplify understanding and govern-ance of reality. They are conceptual instruments used to measure, evaluate and help with decisions by summarizing characteristics or highlighting what is happening in reality. Their use in human history can be traced back, at least, to fourteenth century historical records regarding the management of the Venetian sugar trade with Cyprus (Maddison 2001). Later, the rise of science played an important role in stimulating the need for quantification through an emphasis on objectivity, the written word, rigor, precision and transparency (Shor 2008). More recently, and particularly since the 1930s, the use of indicators increased with the intensification of science and the emergence of a real culture of objectivity. In the 1970s, the “social indic a-tors movement” was born in reaction to the economic alignment of this quantification culture. Since then, the use of indicators as a way of reason-ing has spread to several areas of knowledge and human endeavour. In fact, they can be seen in the management of companies, administration of states, military works, healthcare, scientific production and accounting, among others (Fioramonti 2014; Porter 1995; Power 1997). Presently, there are thousands of indicators alone in the area of social sciences (Fioramonti 2014), and many more can be found in other fields to support understand-ing and governance of modern societies.
(Gudmundsson and Sørensen 2012; Sébastien and Bauler 2013). Until now, little is known in relation to other innovation areas and actors.
This gap in the innovation literature can be problematic for four main reasons. First, the role of indicators in innovation is important to under-stand how decisions are made and actors behave. In fact, literature should identify the ways indicators are included in the decision and, at the same time, capture the behaviour of different decision makers when using them. More knowledge about the use of indicators is also important in innovation policies because they are intended to act upon the innovation system, changing the environment where private and public researchers develop their innovations. Additionally, existing knowledge about the influence of indicators in sustainable policy is not enough to allow generalizations in other areas of innovation and actors of the innovation system. Moreover, innovation policies have obvious implications for socio-economic devel-opment through action upon the socio-economic system, where innovations can interact and promote economic growth. Therefore, there is the need for more research to enable a discerned use of indicators and to improve actions upon the innovation system.
This gap in the literature is also problematic to technology assessment studies for several reasons. First, technology assessment frequently relies on indicators to address relevant societal questions about technology (Barré 2001). For example, in a technology assessment study about the potential and impacts of cloud computing services, Leimbach et al. (2014) used indicators about the type of use and the type of cloud services in order to understand and explain the adoption and usage patterns of companies and consumers. Second, indicators are not neutral instruments to analyse technology problems, because they are selected by criteria that express values and interests of those who propose a specific description of a prob-lem. For example, it is significantly different to observe an indicator of a CO2 footprint of a product than to analyse the whole chain of different risk
“security of livelihood” in a sustainability problem introduces a specific description of a selected problem, which is in this way placed as a key problem against which strategies for its solution are to be defined. Fourth, technology assessment needs a transparent and thoughtful relation with indicators because it can not only lead to new alternative technology options, but also create space for controversies between stakeholders that use a limited set of indicators. For example, the debate about risks of nuclear power plants shifted in the moment the indicator of climate neutral-ity came in, because nuclear fission previously seemed to be an environ-mentally friendly technology. Fifth, the applicability of indicators used and proven in established fields needs reflection while transferring them to a new or emergent technology, as conditions can change significantly and there might be changes in methodology or new empirical test settings relevant for uncover possible harm or damage. Sixth and last, the study of how indicators are involved in policy-making can help technology assess-ment practitioners to understand the policy process. This can also help to differentiate from the scientific and business processes, to develop public participation practices and to improve scientific communication of find-ings. These insights about the policy process can also help to identify stakeholders that influence the decisions, as well as to determine their role in the decision process. In essence, the knowledge gap is problematic to technology assessment because studies frequently rely on indicators, the selection of indicators is not neutral, they can open alternatives and contro-versies, and their study can improve knowledge about policy processes.
an-swers to the three research questions will provide new findings to the literature about indicators in decisions of technology innovation.
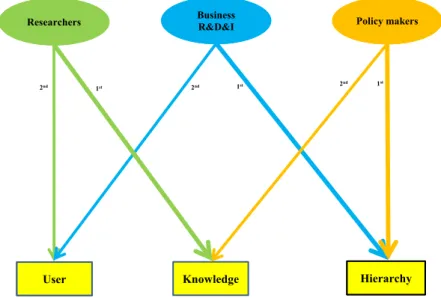
The research questions focused specifically on three groups of actors and four types of decisions. First, the work dealt with three Portuguese technol-ogy innovation groups that significantly invested in technoltechnol-ogy innovation. These groups are: a research group composed of public researchers and academics; a business group comprised of leaders of research, development and innovation departments in companies; and policymakers related to technology innovation. Second, research concentrated on the four types of decisions of technology innovation, namely: acquisition of equipment or a specific technology; development of a product or a specific technology; purchase of property rights; and design of policies (e.g. programs, measures, actions and projects).
There was one noteworthy difficulty in conducting this research. The variety of definitions of indicators is significant (Heink and Kowarik 2010), making it difficult to frame the object of analysis across innovation groups and sectors. On one hand, indicators may be selected to characterize the efforts undertaken by countries, regions or companies. They usually cover resources devoted to research and development (R&D), innovation, patenting, technology balance of payments, international trade in
R&D-intensive industries, etc. For example, the publication “Innovation Union Scoreboard” uses three indicators to measure the availability of a
highly-skilled and educated workforce: “New doctorate graduates”; “Population
aged 30-34 with completed tertiary education”; and “Population aged 20
educa-tion). Therefore, there was the need to adopt a definition of indicators broad enough to encompass the meanings they can have in different inno-vation activities.
The present work contains four more chapters. The following chapter presents the theoretical framework underpinning this research in two different blocks. The first subchapter discusses the role of evidence and indicators in decision-making. It first examines the use of evidence in decision contexts, and the emergence of a movement calling for their introduction in public policy. Afterwards, it addresses the difficulties in framing a definition of indicators, the rise of quantification in human reasoning and the main merits and limitations of indicators. Last, it
dis-cusses the existing knowledge about indicators’ use, influence and role in
the decision process, and presents a proposal to address the gaps found in the literature about indicators in technology innovation. Furthermore, the second subchapter develops the main concepts associated with the decision process of technology innovation. It starts by introducing concepts related to innovation, namely the process of innovation, its main actors, the net-works they form to innovate, and the main concepts of innovation policy. It also introduces the reader to the theory of the decision process, presenting a model to interpret decisions of technology innovation and the main factors influencing these decisions. Afterwards, it describes the four types of decisions of technology innovation, which often occur embedded in ele-ments of complexity and uncertainty.
The fourth chapter presents the main results in three blocks that address the research questions. The first subchapter describes the extent of the use and influence of indicators in technology innovation decisions, based on results from the survey. The second subchapter presents results to characterize the role of indicators in these decisions. The third and last subchapter presents results to explain how indicators were used in these decisions. It combines results from the survey and the case studies to test whether the type and phase of the decision and the context and the process of construction of evidence are factors affecting the way indicators are introduced in deci-sions.
2
Theoretical framework
This chapter introduces the theoretical framework to study the role of indicators in the decision process of technology innovation. The first subchapter argues that more research is needed about the role of indicators in these decisions. The second subchapter develops the main concepts needed to conduct research into the decision process of technology innova-tion. The third and last subchapter summarizes research questions and hypotheses, and identifies the main concepts to be used in this research.
2.1
Evidence and indicators
2.1.1
The use of evidence
“Evidence” can be operationally defined as the available body of facts or
information indicating whether a belief or proposition is true or valid1. It follows that the truthfulness or validity of a proposition depends on the strength of the evidence: weak evidence does not exclude other contradic-tory assertions; and strong evidence normally excludes contradictions and typically agrees with scientific findings2. Furthermore, evidence can assume various forms in different contexts. In fact, evidence can be indica-tors, historical facts, statistics3, results of experiments, texts, quotes from secondary sources, real experiences or histories, or opinions of individuals in one field. These forms can also vary with the context: In policy-making contexts, evidence can range from numerical data to ethical/moral interpre-tations expressing values, attitudes and perceptions of stakeholders and other decision makers. In health contexts, evidence can be research find-ings, other knowledge that is explicit, systemic and replicable, or simple acceptable waiting times (Lomas et al. 2005). In management contexts, evidence can include costs, technical characteristics of materials,
stake-holders’ opinions, etc. In sum, evidence is the body of facts or information that supports the strength of a proposition, and can assume various forms depending on the contexts where they are considered.
There is an abundance of uses for “evidence” in policy literature. In one
extreme, evidence can be strictly identified with scientific outputs. In this case, evidence comprises all types of science (and social science) knowledge generated by research and analysis processes, either within or without the policy-making institution (Juntti, Russel, and Turnpenny 2009). On the other end of the spectrum, evidence is considered useful to support policy. In this case, evidence is not necessarily data or information, but mostly a selection of the available information introduced in an argument
1 “Evidence” Oxford Dictionary Online. Last accessed in 21/12/2014. http://www.oxforddictionaries.com/de/definition/englisch/evidence.
2 Scientific findings are qualitative and quantitative research findings produced and tested by means of Science and Technology.
to persuade of the truthfulness or falseness of a statement (Flitcroft et al. 2011). Furthermore, the use of evidence in policy-making can be a subjec-tive process. In fact, the strength and quality of evidence can be related to the number of controversies it experiences during its lifetime (Sébastien and Bauler 2013). In these cases, evidence loses strength in the decision-making process with any increase of controversy since creation. In addi-tion, the selection of evidence can depend on the situations in which policymakers find themselves. These situations shape which information is used from the complex set available, and which evidence is rejected or at least downplayed (Perri 6 2002). In fact, policy-making “always makes use
of some evidence, but there is a plurality […] of things that count as
evidence, and what counts depends on where policymakers are situated” (Perri 6 2002, 7). Moreover, the selection of evidence can be related to epistemological choices of the decision maker, in terms of claims about valid sources of knowledge and how to judge knowledge claims. These choices can be related to the use of quantitative or qualitative information, but also ideology, as, for example, religious believers might endorse theological claims to knowledge. These choices often reflect ontological assumptions about the objectivity or subjectivity of reality. For example, for some, only positivistic techniques of inquiry support claims to knowledge as reliable facts, whereas for others the complexities of the social world demand an interpretation of human behaviour and intentions (Henn, Weinstein, and Foard 2009). In this context, policy emerges from the interaction of different forms of evidence, filtered and shaped by the institutional processes of decision-making (Flitcroft et al. 2011, 1039).4
This filtering process is subjective and one piece of evidence can be chosen instead of another, leading the argument in different directions.5 Therefore, what counts as evidence in policy-making can vary from “pure” scientific outputs to selected information used to create an argument, depends on the controversies associated, can vary with the context of the policymaker and is subject to a complex filtering process.
The use of evidence in policy-making practice is poorly studied. In fact, there is a significant body of literature about why and how scientifically based evidence should be used by decision makers. However, a much smaller set of recent studies examines the direct use of evidence in policy-making practice (Hall and Jennings 2010). In a work about the use and weight of information and evidence in U.S. state policy decisions, the authors stated:
We know very little about where agencies seek information, and how they weight information from various sources in their decision process. And within that sphere, the prevalence of formal scientific
evidence use in policy decision remains somewhat a mystery. (Hall
and Jennings 2010, 137)
Furthermore, there are increasing calls for public policies that use evidence (Head 2010; Flitcroft et al. 2011; Juntti, Russel, and Turnpenny 2009;
5 The political system has social procedures to relativize criticisms, rejections, risks and
failures associated with policies. According to Niklas Luhmann: “The daily struggle b e-tween government and opposition makes all causal constructions of origin and result con-troversial anyway. There are always people around who criticize decisions. This noise, to which politicians are accustomed and on which they thrive, makes the prospect of post-decisional regret a normal fact of life that has to do with the essence of politics, and not with the content or merit of a particular decision. The important thing is to remain accepted within your own power network. Hence, politicians become inured to daily criticism and rejection; the predominant question is from which side it comes. They develop rhetorical techniques and network-repairing devices in order to survive, and the causal network is
Sorrell 2007; Hall and Jennings 2010). These calls are based on the idea that the inclusion of evidence leads to the best-informed decisions possible. According to Caitlin Porter (2010), evidence-based policy-making is a worthy aspiration that improves the quality of decision-making. It is based on the idea that knowledge can be disseminated in the policy process through the introduction of scientific facts, concepts and theoretical per-spectives (Weiss 1979). Evidence-based policy is particularly attractive in countries with a political culture of transparency and rationality in the policy process, and with a research culture committed to rigorous method-ologies using policy-relevant evidence (Head 2010). In sum, there are increasing calls for transparent, rational and rigorous introduction of evidence in policies based on the best available scientific knowledge, despite the fact that the extent of their use in practice is poorly understood.
These calls for policies that include evidence are coming from profession-als in different fields. The calls probably originated in healthcare practi-tioners demanding policies based on the best evidence-based practices. A major challenge has been to translate the findings and lessons of healthcare research about effective treatment into clinical guidelines to be used by healthcare professionals (Head 2010). After, management literature called for an increase in the use of evidence at least in making important decisions (Jauch and Glueck 1988; Head 2010). Head (2010, 79) argued that business leaders are dependent on accurate evidence about performance, standards and market conditions, and that decisions should increasingly be based on reliable information and expert dialogues, rather than on power and per-sonal intuition. A similar trend can be found in the field of (social) devel-opment (see among others C. Porter 2010). Some authors have even named these groups an evidence-based movement (Glasner-Edwards and Rawson 2010; Jonson-Reid 2011; Denzin 2009; Lilienfeld et al. 2013). Therefore,
there is an “evidence-based movement” from professionals in different fields arguing for decisions based on the best available evidence.
on rationale informed by systemic models of innovation and from economic theories of knowledge and technical change. In 2002, the adherence of the European Council to one explicit target based on an indicator symbolizes this shift towards policies based on evidence (Moniz 2011). In fact, all European countries agreed to increase the overall spending on R&D and innovation to approach 3% of GDP by 2010, with two-thirds of this in-vestment coming from the private sector.6 Furthermore, the two main determinants of this push in evidence in STI policy are the increasingly large sums of public funding to R&D at European and national levels, and the ease of access to computer-based data collection (Godin 2009a). For example, the European Commission publishes the yearly Innovation Union Scoreboard for free and for more than a decade. The publication gathers evidence for systematic comparison of innovation performance across European countries/regions and promotes international policy benchmark-ing. In another example, both PRO INNO Europe and ERA Watch7 pro-grammes systematically collect and freely diffuse data, evidence, policies and programmes on European, national and regional levels. In addition, there is also a growing demand for evidence from private businesses, consultants and policy advisors (Mytelka and Smith 2002; Godin 2009b). Last, several technology assessment8 reports revealed the need to enhance existing evidence to base forecasts on the impacts of future technology developments (Grunwald 2007; Europäische Akademie 2004). In sum, there are signs that STI decisions are increasingly being based on evidence, driven by different stakeholders of the innovation system9.
There are some disagreements with this evidence-based movement, despite their growing popularity in some countries. The first line of criticism is related to the quality of the evidence, because the explanatory scope of
6 European Council. 2002. “Conclusions of the Barcelona European Council 2002.” Vol. 35. Barcelona. Last accessed in 11/12/2014: http://ec.europa.eu/invest-in-research/pdf/download_en/barcelona_european_council.pdf.
most evidence is often more limited than its use in policy decisions. Hall and Jennings (2010, 139) argued that information of dubious reliability or validity may be used to justify public programs. This line of criticism can also include evidence being used for rhetorical purposes, while adopting policies that may not adequately utilize the evidence that is available or obtainable. The second line of criticism is epistemological and relates to the overreliance on quantitative studies for evidence-based policies. De-spite the limitations of quantitative findings, qualitative research continues to play a small role in circles of evidence-based policy. In fact, qualitative findings remain accepted only to provide nuances to most quantitative studies (Veltri, Lim, and Miller 2014).10 A third line of criticism relates to the lack of research supporting the claim that, for example, evidence-based management leads to real improvements. In management studies,
evidence-based supporters “simply restate the dominant discourse and make unsu b-stantiated claims that there is an evidence base without producing the
actual evidence” (Stacey 2011, 180). Therefore, although growing in popularity, the use of evidence in policy-making still faces relevant criticism.
2.1.2
The rise of quantification
There is a significant number of types and definitions of indicators (Heink and Kowarik 2010). These varieties challenge the framing of analysis both in an innovation11 policy context and in a laboratory. First, in innovation policy contexts, indicators are commonly understood as variables selected to characterize the efforts undertaken by countries, regions or companies in the field of science, technology and innovation. These indicators measure
10 According to Veltri, Lim, and Miller (2014), qualitative findings can contribute to evi-dence-based policy in different ways. First, qualitative research offers a commitment to observe and explain phenomena from the perspective of those being studied, providing
them with a “voice”. Second, this type of research provides reflexive awareness and
con-sideration of the researcher’s role and perspective. Third, the authors argued that qualitative
research is not methodologically orthodox and can use flexible research strategies. Fourth, qualitative research offers a contextualization of the data collection and of its analysis. Fifth, qualitative research is thoughtful of emerging categories and theories rather than relying upon a priori concepts and ideas.
resources devoted to research and development (R&D), innovation, patent-ing, technology balance of payments, international trade in R&D-intensive industries, etc. There is a significant amount of innovation indicators freely available for comparisons over time and across countries, regions, sectors and companies.12 For example, the Innovation Union Scoreboard captures
the economic success of innovation using five indicators: “Employment in
knowledge-intensive activities”, “Contribution of medium and high-tech
product exports to the trade balance”, “Exports of knowledge-intensive
services”, “Sales due to innovation activities”, and “License and patent revenues from selling technologies abroad” (Hollanders and Es-Sadki 2014). Second, in a laboratory or innovation department context indicators often reflect the applied nature of innovation. For example, in a business environment, innovation indicators can be related to the energy consump-tion to manufacture a product, the cost of a machine to improve a process, or the amount of raw material introduced in a new technology, as men-tioned. In addition, definitions are bound to the level of analysis of indica-tors. In fact, sometimes indicators are defined as a concept (e.g. climate neutrality and human toxicity), and other times they consist of measures of a phenomenon (e.g. population aged 30-34 with a completed tertiary education and gross domestic expenditures on R&D). Therefore, the variety of types and definitions of indicators suggest adoption of a defini-tion broad enough to include all indicators used to make decisions of technology innovation13.
Indicators can be defined as conceptual instruments used to measure, evaluate and help with decisions by summarizing characteristics or high-lighting what is happening in reality. In this context, an indicator is an instrument to support decisions related to equipment, a product, a process,
12 Indicators are systematically published and downloadable from most public institution working with innovation policy (e.g. OECD, the European Commission, Eurostat, national statistical institutes and UNESCO). There are also many official publications, such as Main Science and Technology Indicators, Innovation Union Scoreboard, and EU Industrial R&D Investment Scoreboard.
a technology, a patent or an innovation system. Indicators are often a compromise between scientific accuracy and the information available at a reasonable cost. Furthermore, the definition of indicator can also include qualitative indicators such as certifications, submissions and other catego-ries, as well as other more subjective measures such as satisfaction, worries or trust (Rammstedt 2009). Nevertheless, indicators are frequently based on quantitative measures that can be linked to the emergence of objectivity in human reasoning.
Indicators exist as a human effort to simplify the understanding and gov-ernance of the realm. They are inherently connected with the social need of quantification14 for public as well as for scientific purposes. The sociologist Max Weber emphasized the rise of capitalism and the rational spirit in western societies to explain a move towards a more rational, bureaucratic and calculative life, and the increased tendency to quantify social entities and behaviours (Shor 2008). Theodore Porter (1995, 74) argued that these
quantification efforts were generally allied with the raise of the “spirit of rigor”. According to the author:
Strict quantification, through measurement, counting, and calcula-tion, is among the most credible strategies for rendering nature or so-ciety objective. It has enjoyed widespread and growing authority in Europe and America for about two centuries. In natural science its reign began still earlier. It has also been strenuously opposed. This ideal of objectivity is a political as well as a scientific one. Objectivity means the rule of law, not of men. It implies the subordination of per-sonal interests and prejudices to public standards. (Porter 1995, 75)
Other explanations about the proliferation of quantification can be found in the rise of the modern centralized state. In France and the USA in particu-lar, public officials faced the need to efficiently manage increasing popula-tions and large-scale social institupopula-tions (Shor 2008). In this context,
gies of impersonality drove the transition to more explicit decision criteria (i.e. objective decisions) in public governance, instead of the old practice of expert judgment (subjective decisions) (Porter 1995). The rise of objective decisions appears to be linked more to external pressures to use explicit criteria, than to the need for better decisions arising from powerful insiders interested in better decisions, according to the author. In addition, Power (1997) suggested that accountants and the rise of bureaucracy also played a significant role spurring the growth of quantification, particularly during the twentieth century. In sum, the rise of indicators is connected to the emergence of quantification efforts that resulted from rationalization practices, scientific thinking, social need to produce impersonal and explic-it decisions, and the rise of accountants and bureaucracy in society.
The origins of indicators as modes of knowledge and governance are difficult to trace back in history. In the fourteen century, indicators related to the size and carrying capacity of galleys were used to control and man-age the sugar trade between Venetia and Cyprus (Maddison 2001). Later, the rise of the scientific mentality played an important role, as mentioned before, by stimulating the need for objectivity, the written word, rigorous quantification, precision and transparency. For a long time, the quantifica-tion efforts of science remained associated with the practical world of administration and commerce. For example, although in 1648 Pascal
discovered that a barometer’s mercury would fall when carried to a higher elevation, it was only in eighteenth-century that military engineers devel-oped rigorous barometric measurements of land elevation to draw topo-graphical maps of mountainous regions (Porter 1995). During this time
“the art of reasoning by figures on things relating to government” was
enthusiasm for the work on efficiency by Frederick Winslow Taylor, among other managerial writers (Moniz 2007; Porter 1995).
In the 1930s, a significant emphasis was placed on quantification with the growth of science in the USA and the culture of equidistance and imper-sonal objectivity in decision-making. In the US, important efforts of quanti-fication were implemented with the systematic use of Intelligence Quo-tient15 tests to classify students, opinion polls to quantify the public mood, elaborate statistical methodologies for licensing drugs, and even cost-benefit and risk analyses to assess public works (Porter 1995). Later in the 1950s, a significant stimulus was given to the need of objectivity and quantification by the US Corps of Engineers, concentrating their “failed
engineers” in economic activities around all district offices “where they were likely to do less harm” (186). At the same time, the US Corps began
employing increasing numbers of economists and other social scientists. This resulted in a takeover of economists and the emergence of cost-benefit analysis in modern economic studies. This type of analysis began with water projects and transport studies (Scigliano 2002), but were later signif-icantly disseminated by RAND’s16 military studies.
In the 1970s, a “social indicators movement” was born in reaction to the
economic orientation of the above-mentioned quantification culture (Land 2000). A group of intellectuals, mostly social scientists, considered the
word “social” to be restrictively defined and meant only “outside the realm of economics” (Sheldon and Parke 1975, 695). According to this group,
science (or quantification in general) created a new sort of “philistines”
encouraged by the relative ease of expressing quantities in dollars and,
15 Intelligence Quotient, commonly known as IQ, is a score derived from standardized tests designed to assess intelligence.
16 According to Linstone (2008) the RAND Corporation is an influential American think-tank of the second half of the twentieth century. The company was established in 1946 to deal
with useful applications labelled “operations research”, which applied mathematics to
consequently, giving an exaggerated importance to these numbers in the interpretation of reality (695). Therefore, scientists linked to this movement argued for a change in conceptual frameworks, shifting the emphasis from economics to measures of social change, which included different subsys-tems in society like education, health, economics, etc. The arguments were focused on the controversy that resulted from an economic-centred per-spective, and mainly concentrated on what this new wave of indicators should measure.
The controversy eventually faded-out and the quantification rationale started to be applied to several parts of life, broadening its scope to many areas of knowledge and human endeavour. Presently, it is possible to find this quantification rationale applied to global scales (Misuraca, Codagnone, and Rossel 2013; Maddison 2001) and even in our personal lives. For example, Robichaud, Durand, and Ouellet (2006) reported on the existence of indicators for personal quality of life, such as measures of verbal com-munication interaction, well-being, participation level in social activities or engagement and integration in the community. Furthermore, this new quantification trend should not be interpreted as an attempt against qualita-tive methods of reasoning. In fact, the production of a quantitaqualita-tive indicator primarily reflects values of an ethical, moral, political, economic or finan-cial nature existing in society before their creation. Their significant expan-sion in recent years was based on an existent societal will expressed, for example, by many influential organizations (e.g. OECD17, ILO18, UNDP19, WHO20 and universities). Despite its problems, quantification is an
im-portant and viable component of today’s social world, and there are few
who would argue for returning to a pre-quantification world (Shor 2008).
17 OCDE is the acronym of the Organisation for Economic Co-operation and Development. 18 ILO is the acronym of the International Labour Organization.
2.1.3
Merits and limitations of indicators
Indicators are commonly understood as containing knowledge that can be used. At the individual level, an actor positions him/herself personally in relation to an indicator after having read, digested and interpreted the knowledge it contains; at the collective level, the use of indicators is part of
an organisation’s operational routines with stabilised ways of thinking and
acting about knowledge (Sébastien and Bauler 2013). Technology deci-sions21, in particular, can be supported by the use of indicators at least theoretically, since indicators are seen as containing knowledge to help the decision maker achieve a more efficient decision. For example, the use of the number of graduates in S&T is a commonly used indicator when deciding about innovation policies. In fact, the indicator can help under-stand the amount of available scientific skills in the labour force when facing a policy decision. In another example, the use of the financial cost of energy in a factory is an accepted indicator to decide about the acquisition of wind turbines for an industrial plant. Therefore, many of our perceptions about innovation22 can be informed by this type of quantitative knowledge (Katz 2006). Furthermore, the repetition of these measures enables the establishment of monitoring systems. In fact, agencies such as the OECD, Eurostat23, UNESCO24 and the American National Science Board collect measures related, for example, to population, GDP25, Gross Expenditures on R&D and numbers of scientific papers and citations. The ratios between these measures are used as performance indicators such as national wealth (GDP per capita), Business R&D intensity (BERD/GDP) and scientific impact (citations/paper). In the end, these measures, combined with a set of performance criteria, can be used to evaluate programmes and projects and in benchmarking exercises. With these measures the state of a system is compared with a desired future state or another comparable system (e.g. country and region) (Gault 2010). Last, indicators (preferably disaggregated)
21 The concept of technology decisions will be developed in subchapter 2.2. 22 The concept of innovation system will be developed in subchapter 2.2. 23 Statistical Office of the European Commission.
can also be used to provide background support to foresight exercises. In sum, indicators are an accepted instrument of useful knowledge that can help to make different types of social, scientific and technological deci-sions.
Literature about indicators also includes four arguments about their useful-ness in decision-making. First, indicators can lead to better decisions and more effective actions by simplifying, clarifying and making aggregated information available to decision makers (United Nations 2007). For example, when taken as a system, they can guide experts and society in vast and complex issues, such as urban quality of life and sustainable development (Feller-Länzlinger et al. 2010). Second, indicators can be reference tools for social thinking and can useful in communicating ideas, thoughts and values. In fact, they can help to measure and calibrate pro-gress towards societal goals, and provide an early warning to prevent economic, social and environmental setbacks (United Nations 2007).
Innovation indicators were described as a “technology” selected by conse n-sus, produced by institutional or individual users, and governed by a set of rules in manuals that guide the collection and interpretation of data for international comparisons (Gault 2013). Third, the systematic use of indicators can introduce knowledge in decisions. In fact, when used to shed light about phenomena, indicators can facilitate the incorporation of physi-cal and social science knowledge into decision-making (United Nations 2007). Fourth, indicators are inherently connected with the need to make less controversial decisions. In fact, many believe that quantification minimizes prejudice, favouritism and nepotism in decision-making (Shor 2008). In short, arguments for the usefulness of indicators in decision-making include better decisions, more social thinking and introduction of knowledge and consensus in the decision process.
The second order of problems of indicators is related to the general effects of their use. There are at least six main types of general effects: 1. Measurements to construct indicators may produce fatigue in re-spondents (Power 1997). They may also change the object of measurement given that once something is measured it changes its characteristics.
2. Indicators may give rise to resistance when perceived as a threat or seen as a cause for social, economic or ecological instability or even damage. For example, indicators can provoke resistance when they are set up to control or monitor26 controversial labour or economic issues (e.g. working hours and sectoral productivity related to pay raise). In another example, if respondents to surveys fear their answers will be used against them or threaten their status quo, individuals may try to bias their responses.
3. Indicators can suffer from excessive use, pressures deriving from material and organisational interests, and clashes of basic values and ideologies subject to political conflict (e.g. general orienta-tions towards government, the state, quality of life, morality and inequality) (MacRae 1985).
4. Indicators can be subject to political influence. In fact, if an organ-isation or a profession is a constituency of either the collector or reporter of the data, it can be expected to exert the same kind of influence as if they were directly handling the data themselves (MacRae 1985). In some cases, indicators can suffer from
confi-dentiality problems or even the public’s suspicion of violations of privacy. Apart from the threat of direct (i.e. governmental) manip-ulation, there is also the danger that rigid governmental rule by an indicator may undermine political debate (indicators can precipi-tately justify measures by bypassing a broad public debate), and prevent reinterpretations of the world (when a problem does not exist anymore).
5. The development of indicators impacts its users. In fact, indicators
are a “technology” which governs behaviour, can be modified by users (outside the producer community), and be developed in
re-sponse to the user’s needs (Gault 2011). Some types of indicators were developed to address a perceived need of a community that wants to use them, and is influenced by them in two major ways: Firstly, the development and evolution of an indicator involves consensus-building activities and the establishment of a common language to construct a discourse (with an agreed vocabulary and grammar) (Gault 2011). These activities impact the practitioners as they learn to use the language and advance the subject at hand. Secondly, after the development phase, the use of language and feedback from users also has an impact on society (Gault 2011). As a result of using indicators, users may change their behaviour or provide suggestions for later revision of indicators.
6. Indicators can create a reality that is put on stage, fixing and re-stricting the way the world can be defined. In fact, indicators can have a subliminal effect, setting fixed pathways for society through their use that sets political effects in motion. For example, the concept of scientific activity in bibliometry27 is sometimes de-fined exclusively in terms of publications undermining other im-portant activities. By focusing on an indicator of research output, a view is enhanced where scientific activity is similar to industrial production and other important activities are not accounted, such as scientific inquiry, reading, collecting data, serving as an editor or reviewer, giving advice or engaging in debates (Dahler-Larsen 2013). Furthermore, indicators can produce constitutive effects on reality. In fact, an indicator has an interactive constitutive relation with the reality it seeks to describe, and is not a neutral representa-tion of an existing concept, according to the author. An indicator helps define the concept it claims to measure in an operational way, similar to how intelligence tests contribute to define our
cept of intelligence. In addition, there are three main mechanisms through which indicators can lead to constitutive effects of reality: indicators can create organizational procedures which structure an otherwise messy reality; indicators can shape language, establish-ing particular meanestablish-ings, definitions, incentives and regulations in which professionals and lay people have to respond; indicators al-so enforce institutional lock-ins with incentives and sanctions, re-warding pushes for standards, norms and procedures in affected groups, according to the author. An observable case of these con-stitutive effects are the publishing of school rankings: A type of school quality is created through the actions (e.g. reactions to po-sition in the league) and interactions between the actors in schools that follow the publication of school rankings (Dahler-Larsen 2013, 15). An unintended effect of the rankings is to create a reali-ty where the concept of qualireali-ty is oriented towards competitive-ness rather than to the inclusion needs of some schools.
In sum, the use of indicators can produce general effects (e.g. fatigue, resistance, pressures and clashes), be subject to political influence, im-pact users, and be a straitjacket to parts of society.
The third order of problems of indicators is related to the consequences of their systematic use. Indicators can impose a moral and ethical be-haviour through the silent assimilation of their implicit values and du-ties into society (Merry 2011). In fact, the repetition of a prescription encoded in an mechanism - in this case an indicator - can, in the long run, change established values and patterns of thought (Latour 1992). Some examples of these effects can be found in the systematic use of innovation rankings, school rankings, New Public Management
pre-scriptions, the European Commission’s excessive deficit procedure28
, etc (Dahler-Larsen 2013). Furthermore, the systematic repetition of an indicator can contribute to the establishment of the view of the world
28 Under the provisions of the Stability and Growth Pact, Members-states agreed to respect targets for two indicators: a deficit-to-GDP ratio of 3% and a debt-to-GDP ratio of 60%, in order to avoid excessive budgetary deficits. See
embedded in its definition (Dahler-Larsen 2013). For example, an in-dicator emphasizing consumer satisfaction in public service is an ef-fective way to import market principles into the public sector, despite problematic effects on civic virtues, according to the author.
The fourth order of problems relates to the potential for deception existent in the use of indicators. In fact, an incautious observation of reality through indicators can lead to deception about phenomena. C. Freeman (1995) provided two examples of how quantitative indicators could not explain changes in innovation systems. In a first example, the author showed that comparisons of R&D indicators were an inade-quate method to explain the Japanese institutional and technical changes of the 1970s and 1980s. In his opinion, these changes needed qualitative description because the Japanese quantitative performance erroneously identified a concentration in the fastest growing civil in-dustries (e.g. electronics), with patent statistics showing their leading role at world level. However, these measures of research and inven-tiveness did not explain how these activities led to higher quality in new products and processes, to shorter lead times and to more rapid diffusion of technologies such as robotics. The second example came from the other side of the former iron curtain. According to Freeman,
the former Soviet Union’s commitment to greater R&D did not in i t-self guarantee successful innovation, diffusion and productivity gains, as the fall of the Berlin Wall would later show. In short, the use of in-dicators might lead to deception if only qualitative factors can describe the phenomenon.
pre-scribe values and interpretations of reality embedded in indicators; create new meanings for words and vocabulary; project incentives, sanctions, norms and regulations, etc (Dahler-Larsen 2013). Third and last, the selection process can entail activities that are not trivial, con-scious nor neutral, creating an implicit and sometimes controversial
space for “politics”, particularly if stakeholders use a different selec-tion of indicators (this can be notably difficult in technology assess-ment studies - see next section). The criteria used to select indicators
may be based on several factors, such as indicators’ policy relevance,
utility, analytical soundness and measurability (OECD 2003), as well
as on other (sub)conscious factors allowing space for “politics”. Ther e-fore, there is the need for a clear formulation of the initial problem, which will enable a transparent selection of indicators that describe the problem to avoid controversies with stakeholders. Furthermore, the se-lection of indicators should also include space to reflect about the in-clusion and the non-inin-clusion of certain indicators. For example, the use of composite indicators29 for impressionistic propaganda (and oversimplification) by policymakers is an example of how indicators can be used (or rejected/downplayed) to suit political intent. The rele-vance of composite indicators to policy is perhaps best captured by the
idea of indicators that become “policy-resonant” (Hezri and Dovers 2006, 87). According to the authors, an indicator that “strikes a chord” with its intended audience is easier to communicate, and often appro-priated by policymakers and by the media (92). Sometimes, policy-makers can claim that some indicators are difficult to interpret, and pe-ripheral to the issues that generate political concern (Munda and Nardo 2005). However, the claim can also be interpreted as an example of how evidence is rejected because it does not suit a policy argument. In short, the selection of indicators is an important and sensitive process, and even sometimes a hazardous procedure that needs careful consid-eration.
The literature also revealed problems specific to innovation indicators, relevant in the context of technology innovation30. First, innovation indica-tors can present dangers to society through their increased complexity, ambivalence of interpretation, or decontextualisation; may present prob-lems of confidence, comparability and overlaps; and may lead to “shaming
and blaming” of countries and to media oversimplification (Feller-Länzlinger et al. 2010; Grupp and Schubert 2010; Nardo et al. 2008; Grupp and Mogee 2004). Second, there are limits to the use of indicators as an evaluation method of impacts of research and innovation funding and policies. In fact, Kuhlmann (2003) warned against using indicators alone to perform these evaluations, because they are not compatible with the ten-dency to pursue complex political goals. In fact, the evaluations should combine various social science methods with indicators, according to the author. Third and last, there are problems associated with the aggregation of indicators in composites or indexes. In STI, there is an academic discus-sion about the purpose and methodologies used to gather data and build these types of indicators (Godin 2008; Nardo et al. 2008; Grupp and Mogee 2004; Barré 2004). Grupp and Schubert (2010) argued that some composite indicators in innovation were not subject to extensive research and may present confidence, comparability and overlapping problems. Nevertheless, scoreboards or composite indicators are often preferred by policymakers, as they can function as strategic instruments to influence policy change and communicate. In essence, the literature identified several problems related to innovation indicators and composite innovation indicators that should be taken into account in decision-making processes.
2.1.4
The role of indicators
The influence of indicators in general decision-making is largely unknown. Most literature aims to develop indicators, to analyse them or to evaluate them. However, only a few authors provided clues regarding the extent to which they are used to make a decision. These qualitative studies were mostly restricted to policy-making. In 1985, Duncan MacRae argued that
the most frequent problem of indicators was their non-use in policy-making. The reasons for this disregard of indicators could be found in the lack of interest, or communication, information overload, or even opposi-tion to what is being measured. A significant part of the existing literature about the influence of indicators in policy-making is, however, recent and resulted from two European projects: POINT - Policy Influence of tors and PASTILLE - Promoting Action for Sustainability through Indica-tors at the Local Level in Europe (Bell and Morse 2013). The existing studies in policy contexts revealed that most indicators were often ignored or that their use was limited in policy decisions (MacRae 1985; Lehtonen 2013; Sébastien and Bauler 2013). Sébastien and Bauler (2013, 3) empha-sized that policy indicators remain largely enigmatic regarding patterns of embeddedness in institutional decision-making processes. In sum, literature about the extent of the use of indicators is meagre and mostly concentrated in policy-making. There is also some evidence that policy indicators were largely ignored.
considered composite indicators more adequate for policy communication and serving a competition function (Grupp and Schubert 2010). The latter authors pointed to the need for combining composites with information from other indicators to understand what to do in innovation policy. Hence, the existing literature about the use of indicators in innovation decisions is scarce and concentrated in two studies about sustainable policy. The limitations of these studies point to a need to understand the use of all types of indicators in innovation decisions.
The scarcity of literature about the role indicators play in innovation decisions is problematic. In fact, understanding the role of indicators in innovation decisions is important along three different lines. First, because the existing knowledge about the influence of indicators is based on only two case studies specifically about sustainable policy, it is difficult to generalize to other innovation topics. Critically, a broader understanding is needed because sector conditions might change significantly. For example, in a mature topic such as pharmaceutical policy there is a significant amount of accessible data, the political context is known and the stakehold-ers and policy impacts are relatively easy to identify. By contrast, in an emerging technology field such as nanotechnology there is less information available, the field has a different political context and it can involve unspecified stakeholders or consequences. Second, innovation policies have implications for other actors of innovation.31 These policies are intended to act upon the innovation system, changing the environment in which private and public researchers develop their innovations. The impact of innovation policies is also important for socio-economic development in society. In fact, these policy decisions act upon the socio-economic system, where innovations can interact and promote economic growth.32 Hence, there is the need to understand how these decisions are made because they impact other actors and society. Last, the role of indicators in innovation decisions is important in understanding how these decisions are made and how actors behave. In fact, literature should identify the ways indicators
are included in innovation decisions to enable an understanding of the behaviour of different decision makers in these processes. In sum, there is a need for further knowledge in innovation studies in order to make a dis-cerned use of indicators and to improve actions in the innovation system.
The gap in the literature is also problematic for technology assessment (TA) studies. In fact, understanding the role of indicators is important to TA for six main reasons:
The reflection about indicators is central to TA practitioners because problem-oriented studies frequently rely on indicators to address rele-vant societal questions about technology (Barré 2001). For example, in a TA study about the potential and the impacts of cloud computing services, Leimbach et al. (2014) used indicators of the type of use in cloud computing services and the type of cloud services to understand and explain the adoption and usage patterns of companies and con-sumers. Furthermore, while using a specific indicator the attention is focused on a selected aspect of the problem and ignores others. This raises the question on whether the existing indicators are contradictory or not, what can be known about a problem at stake while combing all the existing indicators and what are the limits of this knowledge. Thus, there is the need to reflect about indicators because they are often a main conceptual tool for analysing technological problems.
Indicators cannot be seen as normatively neutral instruments to analyse problems. In fact, although indicators are tools for describing and ana-lysing a problem methodically, their selection is driven by criteria used by the actors proposing a focused description of a problem. These cri-teria evaluate indicators against the background of main cultural values or interests. For example, it is significantly different to observe an in-dicator of a CO2 footprint of a product than to analyse the whole chain