BGD
10, 7879–7916, 2013Ocean acidification state in western Antarctic surface
waters
M. Mattsdotter Bj ¨ork et al.
Title Page
Abstract Introduction
Conclusions References
Tables Figures
◭ ◮
◭ ◮
Back Close
Full Screen / Esc
Printer-friendly Version Interactive Discussion
Discussion
P
a
per
|
Dis
cussion
P
a
per
|
Discussion
P
a
per
|
Discussio
n
P
a
per
|
Biogeosciences Discuss., 10, 7879–7916, 2013 www.biogeosciences-discuss.net/10/7879/2013/ doi:10.5194/bgd-10-7879-2013
© Author(s) 2013. CC Attribution 3.0 License.
Open Access
Biogeosciences Discussions
Geoscientiic Geoscientiic
Geoscientiic Geoscientiic
This discussion paper is/has been under review for the journal Biogeosciences (BG). Please refer to the corresponding final paper in BG if available.
Ocean acidification state in western
Antarctic surface waters: drivers and
interannual variability
M. Mattsdotter Bj ¨ork1, A. Fransson2,*, and M. Chierici1,3
1
Department of Chemistry and Molecular Biology, Marine Chemistry, University of Gothenburg, 41296 G ¨oteborg, Sweden
2
Department of Earth Sciences, University of Gothenburg, 41296 G ¨oteborg, Sweden 3
Institute of Marine Research, 9294 Tromsø, Norway *
now at: Norwegian Polar Institute, Fram Centre, 9296 Tromsø, Norway Received: 26 March 2013 – Accepted: 10 April 2013 – Published: 8 May 2013 Correspondence to: M. Chierici ([email protected])
BGD
10, 7879–7916, 2013Ocean acidification state in western Antarctic surface
waters
M. Mattsdotter Bj ¨ork et al.
Title Page
Abstract Introduction
Conclusions References
Tables Figures
◭ ◮
◭ ◮
Back Close
Full Screen / Esc
Printer-friendly Version Interactive Discussion
Discussion
P
a
per
|
Dis
cussion
P
a
per
|
Discussion
P
a
per
|
Discussio
n
P
a
per
|
Abstract
Each December during four years from 2006 to 2010, the surface water carbon-ate system was measured and investigcarbon-ated in the Amundsen Sea and Ross Sea, western Antarctica as part of the Oden Southern Ocean expeditions (OSO). The I/B
Odenstarted in Punta Arenas in Chile and sailed southwest, passing through different
5
regimes such as, the marginal/seasonal ice zone, fronts, coastal shelves, and polynyas. Discrete surface water was sampled underway for analysis of total alkalinity (AT), total dissolved inorganic carbon (CT) and pH. Two of these parameters were used together with sea-surface temperature (SST), and salinity to obtain a full description of the sur-face water carbonate system, including pH in situ and calcium carbonate saturation
10
state of aragonite (ΩAr) and calcite (ΩCa). Multivariate analysis was used to investigate
interannual variability and the major controls (sea-ice concentration, SST, salinity and chlorophylla) on the variability in the carbonate system andΩ. This analysis showed that SST and chlorophyllawere the major drivers of theΩvariability in both the Amund-sen and Ross seas. In 2007, the sea-ice edge was located further south and the area of
15
the open polynya was relatively small compared to 2010. We found the lowest pH in situ (7.932) andΩ =1 values in the sea-ice zone and in the coastal Amundsen Sea, nearby marine out flowing glaciers. In 2010, the sea-ice coverage was the largest and the ar-eas of the open polynyas were the largest for the whole period. This year we found the lowest salinity andAT, coinciding with highest chl a. This implies that the highest
20
ΩAr in 2010 was likely an effect of biological CO2 drawdown, which out-competed the
dilution of carbonate ion concentration due to large melt water volumes. We predict and discuss futureΩ values, using our data and reported rates of oceanic uptake of anthropogenic CO2, suggesting that the Amundsen Sea will become undersaturated with regard to aragonite about 20 yr sooner than predicted by models.
BGD
10, 7879–7916, 2013Ocean acidification state in western Antarctic surface
waters
M. Mattsdotter Bj ¨ork et al.
Title Page
Abstract Introduction
Conclusions References
Tables Figures
◭ ◮
◭ ◮
Back Close
Full Screen / Esc
Printer-friendly Version Interactive Discussion
Discussion
P
a
per
|
Dis
cussion
P
a
per
|
Discussion
P
a
per
|
Discussio
n
P
a
per
|
1 Introduction
The fast ocean uptake of anthropogenic CO2from the atmosphere has caused a shift in the marine carbonate system towards lower carbonate ion concentration, [CO23−], and lower pH, so called ocean acidification (OA). Since the start of the industrial era, pH in the surface water has decreased with 0.1 units (30 %), and the annual mean [CO23−] by
5
10 % (Feely et al., 2004; Sabine et al., 2004; Orr et al., 2005). OA is predicted to be a major threat to marine organisms at all trophic levels and may substantially alter the marine ecosystem functioning (e.g. Fabry et al., 2008).
Polar oceans are particularly vulnerable to ocean acidification due to the cold and relatively fresh surface waters that has great potential for CO2uptake. These regions
10
are also naturally high in CO2 concentration and low in pH and [CO23−] (Fransson et al., 2009; Steinacher et al., 2009). In steady-state, or during longtime changes (>100 000 yr), the marine carbonate system is buffered by carbonate minerals that reduce the effect of acidic input. However, when changes occur over a short time in-terval (<10 000 yr), such as the one we are facing now, the ocean pH becomes very
15
sensitive to CO2input (e.g. Calderia and Wickett, 2003). Surface waters are generally supersaturated in calcium carbonate (CaCO3), but recent studies show undersaturated values of aragonite (the metastable form of CaCO3) in the Arctic Ocean during summer (Chierici and Fransson, 2009; Yamamoto-Kawai et al., 2009). Models of ocean-carbon cycles based on Business-as-usual scenario IS92a predict aragonite to be
undersatu-20
rated in the surface waters of the Southern Polar Ocean by 2100 (Calderia and Wickett, 2003; Orr et al., 2005). However, there are few observations of the natural variability of the carbonate system in the area south of 60◦S, which results in large uncertainties in the model calculations and projections.
The carbonate system and the CaCO3 saturation state (Ω) are affected by
biogeo-25
BGD
10, 7879–7916, 2013Ocean acidification state in western Antarctic surface
waters
M. Mattsdotter Bj ¨ork et al.
Title Page
Abstract Introduction
Conclusions References
Tables Figures
◭ ◮
◭ ◮
Back Close
Full Screen / Esc
Printer-friendly Version Interactive Discussion
Discussion
P
a
per
|
Dis
cussion
P
a
per
|
Discussion
P
a
per
|
Discussio
n
P
a
per
|
increased freshwater addition, and changes in sea-ice cover and extent, which may all impose feedbacks on OA.
The Southern Polar Ocean is already facing dramatic changes from progressing global warming, which is particularly evident in the western Antarctica, such as in-creased glacier melt off. The mean Antarctic sea-ice cover shows a slight increase of
5
the decadal sea ice extent of 1.2 % (Jacobs and Comiso, 1997; Kwok and Comiso, 2002). However, the sea-ice cover in the Bellingshausen-Amundsen Sea area shows drastic decreased ice cover by 5.7 % per decade. On the other hand, in the Ross Sea the sea-ice extent has increased by 4.2 % per decade (Jacobs and Comiso, 1997; Comiso and Nishio, 2008). The contrasting sea-ice extent trend observed in the
west-10
ern Antarctic seas is explained by changes in the direction and intensity of the atmo-spheric pressure forcing such as the Southern Annual Mode (SAM) (e.g. Stammer-john et al., 2008). The Amundsen Sea is part of the region identified as a climatologi-cally anomalous region (Jacob and Comiso 1997). The areas comprise of the Western Antarctic Ice Sheet (WAIS), where substantial thinning and melting of glaciers (Pine
15
Island, Getz, Dotz and Thwaites Glacier) have been observed over the last decades (e.g. Rignot et al., 2008). The largest melt from the Pine Island Glaciers drains along the coastline of the Amundsen Sea. Increased melting of the base of the floating ice sheets indicates that the forcing comes from the oceans. It is suggested that warm Circumpolar Deep Water (CDW) enters the continental shelf and drives the melting of
20
floating terminus of the Pine Island Glacier (Jacobs et al., 1996; Thoma et al., 2008; Arneborg et al., 2012). If increased freshwater from sea-ice and glacier melt would lead to a decrease inΩ, such as found in the Arctic Ocean, there is a large potential that further glacier melt offin this area has the potential to advance ocean acidification (Chierici and Fransson, 2009; Yamamoto-Kawai et al., 2009).
25
BGD
10, 7879–7916, 2013Ocean acidification state in western Antarctic surface
waters
M. Mattsdotter Bj ¨ork et al.
Title Page
Abstract Introduction
Conclusions References
Tables Figures
◭ ◮
◭ ◮
Back Close
Full Screen / Esc
Printer-friendly Version Interactive Discussion
Discussion
P
a
per
|
Dis
cussion
P
a
per
|
Discussion
P
a
per
|
Discussio
n
P
a
per
|
sink and perhaps shift the Southern Polar Ocean to act as an oceanic CO2source to the atmosphere (LeQu ´er ´e et al., 2007).
Biological processes has a large impact on the natural variability of carbonate system and calcium carbonate saturation state (Ω) in polar oceans (e.g. Chierici et al., 2011). The Amundsen Polynya (AmP) and Ross Sea polynya (RSP) are among the most
5
biologically productive areas in the Southern Ocean (Arrigo and van Dijken, 2003). A change in the primary production or in the efficiency of biological carbon uptake may have consequences for the OA and air-sea CO2exchange. In the Southern Polar Ocean, biological processes are closely connected to the sea-ice cover. Thus, it is likely that a change in sea-ice concentration and extent will affect both the carbonate system
10
and the biological carbon uptake.
Calcite and aragonite are biogenically produced CaCO3 and they are rarely formed inorganically. Calcite is the stable form and aragonite is the meta-stable form, which is given by their different solubility products,Ksp. The saturation state (Ω) is the thermo-dynamic potential to dissolve a mineral, when Ω>1 the mineral will be kept in solid
15
state, and whenΩ<1, the mineral will dissolve.Ωis expressed by the product of the concentrations of calcium ions [Ca2+] and [CO23−] in sea water divided by the Ksp, at a given temperature, salinity and pressure. [Ca2+] is linearly related to salinity and is generally in excess concentration in the ocean. The saturation state for CaCO3(Ω) is expressed in Eq. (1):
20
Ω =[CO2− 3 ]·[Ca
2+]/K
sp (1)
The carbonate-system parameters and Ω are key variables to monitor the state of ocean acidification and give information on the dissolution state of shells and skeleton. In the polar oceans, attention has been drawn to aragonite-forming organisms, since aragonite is the least stable form of CaCO3and they may become the first organisms
25
BGD
10, 7879–7916, 2013Ocean acidification state in western Antarctic surface
waters
M. Mattsdotter Bj ¨ork et al.
Title Page
Abstract Introduction
Conclusions References
Tables Figures
◭ ◮
◭ ◮
Back Close
Full Screen / Esc
Printer-friendly Version Interactive Discussion
Discussion
P
a
per
|
Dis
cussion
P
a
per
|
Discussion
P
a
per
|
Discussio
n
P
a
per
|
Limacina helicina is affected by both warming and high CO2 levels. A study made by
Bednarsek et al. (2012) showed thatLimacina helicinawas negatively affected by OA. Comeau et al. (2010) found thatL. helicinawas especially sensitive for lowΩArin
com-bination with higher temperature and high CO2-levels. Except for calcification, experi-ments on non-calcifying organisms show effects due to a lower pH through changes in
5
their enzymatic processes, and internal membrane functioning such as, ion-pump func-tioning, and protein synthesis (Gattuso and Hansson, 2009 and references therein). Changes in pH may also affect the bio-availability of important micro-nutrients such as iron and manganese (Breitbarth et al., 2010), which may have large consequences in the SPO where iron limitation controls primary production. To perform realistic
exper-10
iments on the effects of OA on marine organisms it is important to have information on the organisms and their natural chemical environment with relevant pH and pCO2 levels.
Here, we present four years of unique data of the carbonate system (pH,CT,AT) and estimates ofΩin the surface water, from the nearly unexplored Amundsen Sea, and the
15
more well studied Ross Sea. Data is discussed in relation to sea-ice concentration and melt water, salinity (S), sea-surface temperature (SST), and chlorophyllalevels (chla). Main aims for the study is to: (1) present the current surface-water carbonate system and ocean acidification state in the Amundsen Sea and Ross Sea; (2) investigate the interannual variability of carbonate system parameters andΩ during four years; and
20
BGD
10, 7879–7916, 2013Ocean acidification state in western Antarctic surface
waters
M. Mattsdotter Bj ¨ork et al.
Title Page
Abstract Introduction
Conclusions References
Tables Figures
◭ ◮
◭ ◮
Back Close
Full Screen / Esc
Printer-friendly Version Interactive Discussion
Discussion
P
a
per
|
Dis
cussion
P
a
per
|
Discussion
P
a
per
|
Discussio
n
P
a
per
|
2 Methods
2.1 Determination of the carbonate system
Discrete water samples were collected through stainless steel tubing from the ship’s water intake (∼8 m depth) for analysis of total alkalinity (AT), pH, and total dissolved
inorganic carbon (CT).ATand pH were measured onboard, on all four cruises, whereas
5
CT was only measured for samples collected in 2006 (Table 1).The methods for
sam-pling and analysis of AT, pH and CT follow the state-of-the art procedures fully de-scribed in Dickson et al. (2007). In 2006, seawater samples were preserved with mer-curic chloride and stored dark at 4◦C untilCT determination using extraction of acidi-fied seawater and coulometric titration with photometric detection at the Department of
10
Chemistry and Molecular Biology, University of Gothenburg, G ¨oteborg, Sweden. ATwas determined by potentiometric titration in an open cell with 0.05 M hydrochloric acid (HCl), and the equilibrium point was determined by Gran evaluation as described in Haraldsson et al. (1997). The precision of AT and CT values were investigated at a daily basis from triplicate analysis of one sample, and was forATandCT±3 µmol kg−1
15
and ±2 µmol kg−1, respectively. The accuracy of AT and CT were controlled using
Certified Reference Material (CRM) supplied by A. Dickson (San Diego, USA). pH was determined spectrophotometrically (Diode-array spectrophotometer, HP8452 and HP8453 (from 2008) using a 2 mM solution of the sulphonaphtalein dye, m-cresol pur-ple, as an indicator (Clayton and Byrne, 1993). Perturbation of indicator pH was
cor-20
rected using the formulation described in Chierici et al. (1999).
CT was measured in 2006, and calculated from AT, pH and SST and salinity for the other years. A pair of the parameters AT, CT, and pH, salinity and temperature were used as input parameters in a CO2-chemical speciation model (CO2SYS program, Pierrot et al., 2006) to calculate the full carbonate system including pH in situ ,
car-25
bonate ion concentration ([CO23−]), and CaCO3saturation of calcite and aragonite (ΩCa
BGD
10, 7879–7916, 2013Ocean acidification state in western Antarctic surface
waters
M. Mattsdotter Bj ¨ork et al.
Title Page
Abstract Introduction
Conclusions References
Tables Figures
◭ ◮
◭ ◮
Back Close
Full Screen / Esc
Printer-friendly Version Interactive Discussion
Discussion
P
a
per
|
Dis
cussion
P
a
per
|
Discussion
P
a
per
|
Discussio
n
P
a
per
|
et al. (1993, 1994), since they are well suited for polar surface waters (Chierici et al., 2004; Chierici and Fransson, 2009). The calculations were performed on the total hy-drogen ion scale, and we used the HSO−4dissociation constant of Dickson (1990). The concentration of calcium, [Ca2+] is assumed to be proportional to the salinity accord-ing to (10.28·S/35 µmol kg−1).The thermodynamic solubility products for aragonite and
5
calcite (Ksp) are from Mucci (1983).
2.2 Determination of continuous measurements of SST, salinity and chla
Sensors for SST, salinity (thermosalinograph SBE-21, Seabird electronics Inc.) and chlorophyll a (chl a, MiniTracka II, Chelsea instruments) were connected to seawa-ter intake for continuous measurements (1 min mean values). The calibration of the
10
chl a sensor was performed in 2007/08 using conventional techniques for chl a de-termination, full details on the calibration of the chla sensor are described in Chierici et al. (2012). A temperature sensor was placed at the seawater intake to record the temperature of the incoming surface water.
2.3 Statistical analysis on interannual variability and major drivers ofΩ
15
Multivariate analysis is a helpful tool to explore trends, outliers and to perform quality control in complex systems and data sets. Here we use the Simca P+(Umetrics, I. Simca P+, vs: 12.0.1.0) to perform Principal Components Analysis (PCA) and Orthog-onal Partial Least Squares (OPLS), which are projection methods that reduce dimen-sionality in data using the correlations in data. The information is given in two plots;
20
score and loading, the score plot summaries the observations and observe patterns, trends and clusters. The loading plot summaries the variables and explain the posi-tion of the observaposi-tions in the score plot. The PCA analysis was used to investigate the interannual variability in the whole data set. OPLS is a further development from PCA (Trygg and Wold, 2002). OPLS is a regression method that finds information in
25
BGD
10, 7879–7916, 2013Ocean acidification state in western Antarctic surface
waters
M. Mattsdotter Bj ¨ork et al.
Title Page
Abstract Introduction
Conclusions References
Tables Figures
◭ ◮
◭ ◮
Back Close
Full Screen / Esc
Printer-friendly Version Interactive Discussion
Discussion
P
a
per
|
Dis
cussion
P
a
per
|
Discussion
P
a
per
|
Discussio
n
P
a
per
|
investigate the major drivers explaining the variability inΩ. The OPLS analysis was per-formed withΩArasy-variable and one ofAT/CT/pH15/chla/SST/salinity asx-variables. Two models were made; one for Amundsen Sea and one for Ross Sea.
3 Study area
This study uses data from measurements performed in the Pacific sector of the
5
Southern Ocean, focusing on the western Antarctic surface water in the Amund-sen Sea (65◦S to 75◦S; 90◦W to 120◦W, including Amundsen Sea Polynya) and Ross Sea (70◦S to 78◦S; 145◦W to180◦W, including the Ross Sea Polynya). This data was obtained during four austral summers (December to January) onboard the Swedish icebreaker I/BOden as part of the Swedish-USA collaboration on the Oden
10
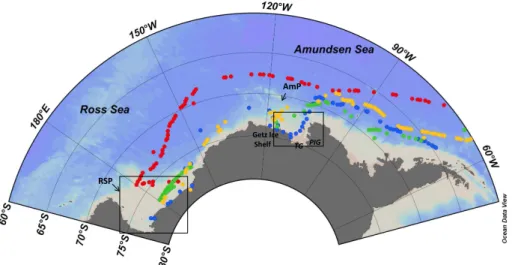
Southern Ocean (OSO) expeditions: OSO2006, OSO2007/2008, OSO2008/2009 and OSO2010/2011. Figure 1 shows the cruise tracks for the four expeditions, and Table 1 summarizes the expedition dates, start location, and the main scientific study area for each year. Typically, the OSO expeditions started in Punta Arenas, Chile in beginning of December. All expeditions ended in McMurdo Sound, Ross Sea, Antarctica. The
15
expeditions passed through different regimes; permanently open ocean zone (POOZ), the seasonal ice zone (SIZ), and open polynyas. The SIZ is defined as the area be-tween the maximum (usually in September) and the minimum sea-ice extent (usually in February) and covers the area from the Polar Front (APF) in the north to the Antarctic ice shelf in the south. This area is also referred to as the Antarctic Zone (AZ), and is
20
the focus for this study. Several polynyas are found along the west coast of the Antarc-tic continent (Arrigo and van Dijken, 2003). Polynyas are areas of open water or re-duced sea ice cover located in the sea ice. For all four expeditions we passed the Ross Sea Polynya (RSP) and, except for in 2006, we entered the Amundsen Polynya (AmP, Fig. 1). These polynyas are kept ice free by strong consistent katabatic winds (formed
25
BGD
10, 7879–7916, 2013Ocean acidification state in western Antarctic surface
waters
M. Mattsdotter Bj ¨ork et al.
Title Page
Abstract Introduction
Conclusions References
Tables Figures
◭ ◮
◭ ◮
Back Close
Full Screen / Esc
Printer-friendly Version Interactive Discussion
Discussion
P
a
per
|
Dis
cussion
P
a
per
|
Discussion
P
a
per
|
Discussio
n
P
a
per
|
Continental Deep Water (mCDW). In 2006, large part of the expedition was spent in at the northern extent of the sea-ice edge and in the SIZ, but did not enter the Amundsen Sea (AmS). In the three other years (2007/2008, 2008/2009 and 2010/2011), most of the scientific focus was in the sea ice in the Amundsen Sea and its polynya (AmP). In 2007/2008 substantial expedition time was spent in the open polynya and in coastal
5
Amundsen Sea and Ross Sea. The Ross Sea and RSP were covered all four years.
3.1 Hydrography
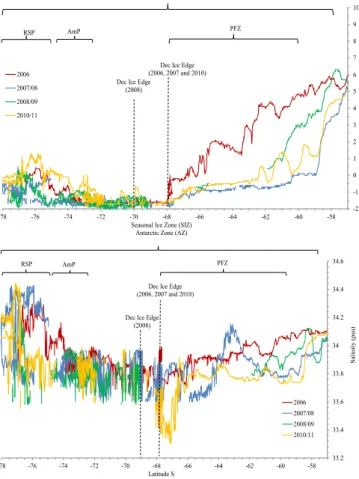
The area south of 60◦S is marked by a sharp temperature gradient and salinity de-crease (Fig. 2b), which denotes the Antarctic Polar Front (APF), and the entrance to the Polar Frontal Zone (PFZ, Fig. 2a). The APF marks the location where Antarctic surface
10
water (AASW) meets subantarctic waters, sinks beneath it and creates a shallow mixed layer (Deacon, 1933). Further south, on the coastal shelves in western Antarctica, relatively warm Circumpolar Deep Water (CDW) enters the continental shelf through troughs and mixes with fresh and cold AASW becoming mCDW (i.e. Arneborg et al., 2012). Our main study area lies in the area south of 60◦S, including the PFZ, the
15
coastal shelves of Amundsen Sea and Ross Sea, and their polynyas.
SST and salinity varied between years to some extent due to different cruise tracks (Fig. 2a and b). Generally SST varied between 7.5◦C and−2◦C, with minimum SST
in the AZ between 68◦S and 70◦S. SST increased entering the AmP and RSP. At approximately 60◦S, the SST drastically decreased from∼3◦C to∼0.5◦C denoting the
20
entrance to PFZ. In 2006, the PFZ was reached further south due to the more north-westerly cruise track (see Chierici et al., 2012 for details on 2006 expedition). After entering the PFZ and moving southward, SST continued to decrease (1 to −1.5◦C)
and salinity varied between 33.7 and 34.0 (Fig. 2a and Fig. 2b). The sea-ice edge was reached at 67–69◦
S and the date and location of reaching the December ice edge for
25
each year is summarized in Table 2. Here, SST was just above freezing point (−1.2 and −1.8◦C) and salinity varied between 33.6 and 34.0. Minimum salinity of 33.3 was found
in 2010, between 66◦
S and 68◦
BGD
10, 7879–7916, 2013Ocean acidification state in western Antarctic surface
waters
M. Mattsdotter Bj ¨ork et al.
Title Page
Abstract Introduction
Conclusions References
Tables Figures
◭ ◮
◭ ◮
Back Close
Full Screen / Esc
Printer-friendly Version Interactive Discussion
Discussion
P
a
per
|
Dis
cussion
P
a
per
|
Discussion
P
a
per
|
Discussio
n
P
a
per
|
and the warmest water (≥0◦C) was found close to the coast and in the open polynyas.
The coldest surface water was found in the AmS close to Pine Island Bay, where two of the largest glaciers found in Antarctica, Pine Island Glacier (PIG) and Thwaites Glacier (TG), drain melt water to the ocean. In AmS, salinity was the lowest to the east (33.6) and increased to the west coast (>33.9 at 115◦
W) (Fig. 2b). The warmest and most
5
saline water south of the December ice edge was found in RSP (Fig. 2a and Fig. 2b).
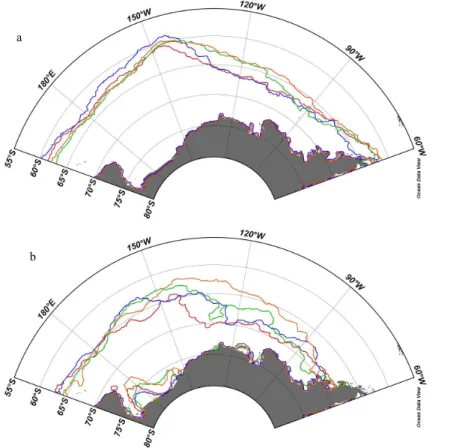
3.2 Sea ice extent and concentration
The seasonal and interannual variability of sea-ice extent and concentration were in-vestigated using remotely sensed observations on the sea-ice distribution, and con-centration from the Advanced Microwave Scanning Radiometer (AMSR-E) from
Uni-10
versity of Bremen (Spreen et al., 2008). The winter (September) sea-ice distribution was larger and extended further north in the Ross Sea, relative to the Amundsen Sea, and remained throughout December (Fig. 3a). The decrease in sea-ice concentration in the Ross Sea in December was due to the opening of the RSP. In the Amundsen Sea, sea-ice distribution showed larger seasonal and interannual variability than in the
15
Ross Sea. For example, the December sea ice reached further north in 2010 than other years (Fig. 3b). In mid-February almost all sea ice has disappeared (not shown). It was obvious that the size of the open polynyas differed between years, particularly evident in the RSP (Fig. 4a to 4d). Generally, maximum December sea-ice concentration was found in 2010, and minimum in 2007 (Fig. 4b and 4d). However, the open areas of the
20
RSP and AmP were the smallest in 2006 and 2007, and the largest in 2008 and 2010 (Fig. 4a to 4d). In December 2010, the coastal areas were completely open, connecting the two polynyas.
3.3 Chlorophylla
Chlorophyll a (chl a) was used as to investigate the influence of primary production
25
BGD
10, 7879–7916, 2013Ocean acidification state in western Antarctic surface
waters
M. Mattsdotter Bj ¨ork et al.
Title Page
Abstract Introduction
Conclusions References
Tables Figures
◭ ◮
◭ ◮
Back Close
Full Screen / Esc
Printer-friendly Version Interactive Discussion
Discussion
P
a
per
|
Dis
cussion
P
a
per
|
Discussion
P
a
per
|
Discussio
n
P
a
per
|
consumed through photosynthesis and the [CO2] in the surface water decreases. This leads to higher [CO23−], consequently higherΩin the surface layer during phytoplankton blooms.
Chl a peaked in the PFZ and at the ice edge, particularly evident in 2010, when chlawas up to six times higher than in the other areas (Fig. 5). Elevated chlain 2010
5
at the ice edge, coincided with a drastic salinity decrease, indicating the influence of sea-ice melt water (Fig. 2b). Chl a drastically increased entering the AmP and RSP, and chla exceeded 10 µL−1, which was the maximum range for chla sensor. In the SIZ and at the coast of the Amundsen Sea chlavalues were generally low (<1 µL−1,
Fig. 5).
10
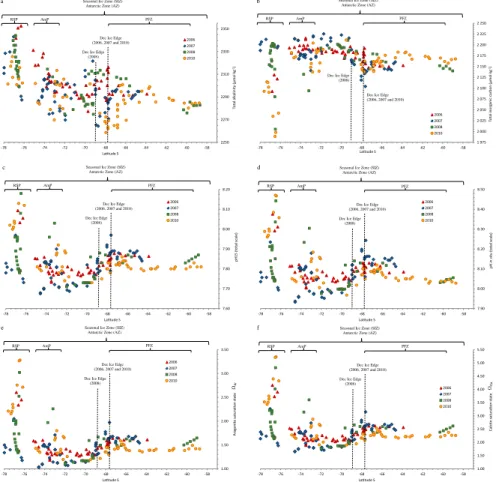
4 Results
4.1 Variability of the carbonate system andΩ
Figure 6a–f shows the latitudinal surface water variability ofAT,CT, pH at 15◦C (pH15), pH in situ ,ΩAr, andΩCa for all four years. Denotations show the location of the De-cember sea-ice edge for each year, the zones and the polynyas in the Amundsen
15
Sea (AmP) and Ross Sea (RSP) in each figure. All carbonate system parameters showed modest variability in the PFZ north of 65◦
S before reaching the ice edge, whereAT, CT, and pH15 values were approximately 2290 µmol kg−1, 2170 µmol kg−1, and 7.82, respectively (Fig. 6a to 6c). At the ice edge,AT dropped to the lowest value of 2258 µmol kg−1(in 2010, Fig. 6a), coinciding with a salinity decrease (Fig. 2b).
Be-20
fore the ice edge,ΩAr, andΩCawere relatively stable of about 1.4 and 2.2, respectively
(Fig. 6e and 6f). Between the PFZ and the AmS,ATandCTincreased by approximately
50 µmol kg−1and 100 µmol kg−1, respectively. This coincided with decreased pH15 and pH in situ by approximately 0.25 andΩArby the maximum of 0.6 units (Fig. 6c, 6d, and 6e). The carbonate system differed greatly between the two polynyas. Generally, AT
25
BGD
10, 7879–7916, 2013Ocean acidification state in western Antarctic surface
waters
M. Mattsdotter Bj ¨ork et al.
Title Page
Abstract Introduction
Conclusions References
Tables Figures
◭ ◮
◭ ◮
Back Close
Full Screen / Esc
Printer-friendly Version Interactive Discussion
Discussion
P
a
per
|
Dis
cussion
P
a
per
|
Discussion
P
a
per
|
Discussio
n
P
a
per
|
water in the AmP. Entering the RSP, CT decreased drastically in all years, reaching
the minimum of 1989 µmol kg−1in 2010 (Fig. 6b, Table 3). This year, we observed the highest pH in situ of 8.47 (Fig. 6c, Table 3), and highestΩAr(3.3.) andΩCa(5.2), which was likely an effect of high phytoplankton production (i.e. high chla, Fig. 5).
We calculated mean values for each year, which were compared to the four-year
5
mean values to investigate the interannual variability, summarized in Table 3. In 2010, we observed the lowestATandCT, about 40 and 178 µmol kg−1lower than the four-year mean values. This may be linked to the presence of low-salinity water, in combination with the high primary production in this year, relative to other years. In RSP, the values of all parameters, exceptCT, increased for all years, most evident in 2006 and 2010
10
(Fig. 6a to 6f). The lowest pH in situ (7.932) and the lowestΩAr(1.0) andΩCa(1.6) were
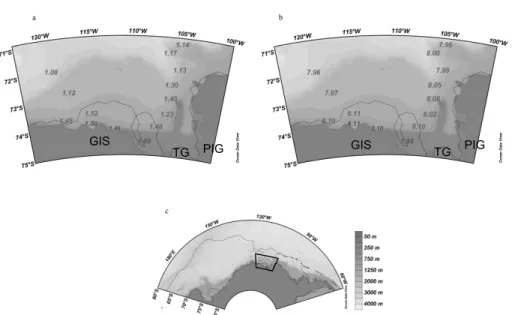
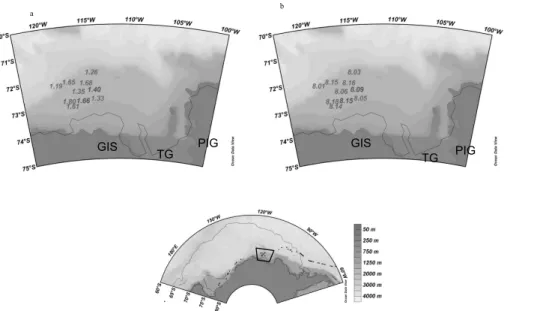
found in the AmP, most evident in 2007 (Fig. 6d to 6f). A close-up of the Amundsen Sea in 2007, show low pH and low ΩAr in the sea-ice area and that values increase
as approaching the coastal AmP, except for the lowest pH in situ and lowestΩAr value
located close to the Thwaites glacier in the Pine Island Bay area (Fig. 7a and b). In
15
2010, the stations were located in the ice- covered part of AmP, where ΩAr and pH
in situ were higher than in 2007 (Fig. 8a and 8b). This was likely the result of CO2 decrease during phytoplankton production indicated by the high chla in 2010, in the AmP (Fig. 5). The same trend was observed in the RSP, and pH in situ andΩAr was
lower in 2007 than in 2010 (Fig. 9a and 9b). In 2010, the areas of the open AmP and
20
RSP were larger than in 2007, which may have promoted primary production (Fig. 4b and 4d). In the AmP and coastal RSP,ΩAr was between 1.0 and 1.5 in 2007, which
was lower than in 2010 (Fig. 7a to Fig. 10a). The largestΩAr difference between the
two years was found in the eastern RSP, whereΩArwas about 1.2 units lower in 2007 relative to 2010 (Fig. 9 and Fig. 10a). This was likely due to the difference in the strength
25
BGD
10, 7879–7916, 2013Ocean acidification state in western Antarctic surface
waters
M. Mattsdotter Bj ¨ork et al.
Title Page
Abstract Introduction
Conclusions References
Tables Figures
◭ ◮
◭ ◮
Back Close
Full Screen / Esc
Printer-friendly Version Interactive Discussion
Discussion
P
a
per
|
Dis
cussion
P
a
per
|
Discussion
P
a
per
|
Discussio
n
P
a
per
|
4.2 Interannual variability based on multivariate analysis
Principal Component Analysis (PCA) was used to investigate interannual differences in the data set. A PCA analysis was performed on the full data set for all cruises and variables (SST, salinity, chla,AT, pH15,CT and pH in situ). The model was validated against the goodness of fit (R2X), and goodness of prediction (Q2). Observations and
5
variables are summarized in a combined PCA score loading plot (Fig. 11). Loading vector (p) and score vector (t) are displayed correlation scaled as vectorp(corr) and
t(corr). The PCA show little variability between years and there were no major clusters or obvious divergence between the four years (Fig. 11). However, the PCA identify that data from OSO2007/08 was mainly distributed towards highCTand that data from
10
OSO2010/11 was highly influenced by low salinity and low AT. This agrees with the latitudinal distribution of salinity and AT (Figs. 2b and Fig. 6a). The data points with large range, distributed to the far right in the PCA plot, were all located in the polynyas (Fig. 11).
5 Discussion
15
The latitudinal distribution and the multivariate analysis indicate interannual variability in the carbonate system andΩ, which were likely linked to differences in sea-ice con-centration, chla, and salinity (i.e. freshwater). For example, the large winter ice extent and ice concentration in 2010 remained until December, in both AmS and RS, which may have caused large volumes of melt water resulting in a fresh, stratified summer
20
surface layer. This also explains the low salinities and lowAT encountered in 2010, relative to the other years. Generally sea-ice melt water results in lowΩdue to dilution of CO23−, as observed in the Arctic Ocean (Chierici and Fransson, 2009; Yamamoto-Kawai et al., 2009). This was not the case in our study, where we found the highest mean Ω values in 2010, coinciding with high chl a levels and relatively low CT
(Ta-25
BGD
10, 7879–7916, 2013Ocean acidification state in western Antarctic surface
waters
M. Mattsdotter Bj ¨ork et al.
Title Page
Abstract Introduction
Conclusions References
Tables Figures
◭ ◮
◭ ◮
Back Close
Full Screen / Esc
Printer-friendly Version Interactive Discussion
Discussion
P
a
per
|
Dis
cussion
P
a
per
|
Discussion
P
a
per
|
Discussio
n
P
a
per
|
measured during a parallel expedition in the AmP in 2010 (ASPIRE-project, RV N.B. Palmer). This indicates that the positive effects on Ω due to primary production (bio-logical CO2 uptake) were out-competing the dilution of CO23− from melt water in 2010. In 2007, the lowest Ωin AmP may be due to less biological CO2 drawdown, also in-dicated by the high CT values in the PCA analysis. The area of the open AmP was
5
smaller in December 2007, and the lowΩwas perhaps more influenced by melt-water dilution, and less by primary production this year. The timing of the polynya opening may also play a large role affecting the Ω variability. To investigate the main drivers and their contribution to theΩArvariability, we perform a multivariate statistics using an
OPLS model (see method section for details). The results from this exercise show that
10
pH andCThave the strongest contribution, andAT have low influence on the variability ofΩ (Fig. 12). This indicates that the processes, which directly affect CO2, such as phytoplankton production and SST changes, have the largest effect onΩ. This is also indicated by the large influence of chl a and SST, which have similar impact, and salin-ity has small contribution toΩvariability (Fig. 12). According to the OPLS evaluation,
15
salinity andAT have stronger influence onΩin the AmS compared to the RS that was more influenced by SST and chla. This is interesting since that implies that theΩ in the AmS may be more sensitive to further freshening due to glacial and sea-ice melt than the RS. On the other hand, a change in the biological processes and temperature may have larger influence on the CaCO3 saturation state in the RS. However, there
20
were no statistically significant differences between the drivers for the two regions. As anthropogenic CO2 increases in the atmosphere, a corresponding increase in surface-water CT may be expected. Sabine et al. (2008) determined the decadal
in-crease ofCTdue to oceanic uptake of anthropogenic CO2to 5–10 µmol kg−1decade−1 in the Pacific sector of the Southern Ocean (>55◦S) for the period from 1991 to 2006.
25
Assuming a decadal increase of 10 µmol kg−1andAT, SST and salinity from our study, the sea-ice covered part of the Ross Sea and Amundsen Sea, and coastal AmS will experienceΩAr<1 already by 2026–2030 (Fig. 13b). This is about 20 yr sooner
BGD
10, 7879–7916, 2013Ocean acidification state in western Antarctic surface
waters
M. Mattsdotter Bj ¨ork et al.
Title Page
Abstract Introduction
Conclusions References
Tables Figures
◭ ◮
◭ ◮
Back Close
Full Screen / Esc
Printer-friendly Version Interactive Discussion
Discussion
P
a
per
|
Dis
cussion
P
a
per
|
Discussion
P
a
per
|
Discussio
n
P
a
per
|
undersaturated with regard to aragonite, except for coastal RSP (Fig. 13c). This esti-mate is based on steady-state and no changes in biological and physical processes. However, it is likely that these processes will change, possibly linked to changes in sea-ice extent and freshwater addition. During the last 30 yr, sea-ice duration has de-creased in the Amundsen Sea and inde-creased in the Ross Sea (e.g. Stammerjohn et al.,
5
2008). The December anomalies from remotely sensed derived sea-ice concentration in the period 1979–2000 (Fetterer et al., 2002) show that except for year 2010, the sea-ice concentration was anomalously low in the Amundsen Sea and high in the Ross Sea in our study period (Fig. 14). Based on our study, we found the lowestΩin the Amund-sen Sea in years of anomalously low sea-ice concentration (e.g. 2007). Assuming the
10
30 yr decreasing sea-ice trend, it is likely thatΩwill continue to decrease. On the other hand, increased sea-ice duration, similar to the situation in 2010, would probably result in increased primary production and increasedΩvalues. In addition, reports show that the most significant losses in the marine glaciers have occurred across the AmS coast-line, leading to increased discharge of glacier melt water due to increased upwelling of
15
warm Circumpolar Deep Water (e.g. Thoma et al., 2008; Arneborg et al., 2012).
6 Conclusions
Our study indicates that increased freshwater (i.e. sea-ice melt water) may enhance biological CO2drawdown leading to increased Ω in summer. However, increased up-welling of CO2-rich subsurface water may counteract the increased Ω and advance
20
ocean acidification in the Southern Polar Ocean. It is ultimately the net effect of in-creased freshening, sea-ice formation and melt, upwelling, and warming that will de-cide the direction and strength of continued air-sea CO2uptake and the CaCO3 satura-tion state. Our study confirms the necessity of long-term monitoring in the polar areas, to deduce the carbonate system trends and the final effect of climate change driven
25
BGD
10, 7879–7916, 2013Ocean acidification state in western Antarctic surface
waters
M. Mattsdotter Bj ¨ork et al.
Title Page
Abstract Introduction
Conclusions References
Tables Figures
◭ ◮
◭ ◮
Back Close
Full Screen / Esc
Printer-friendly Version Interactive Discussion
Discussion
P
a
per
|
Dis
cussion
P
a
per
|
Discussion
P
a
per
|
Discussio
n
P
a
per
|
Acknowledgements. This is a contribution to the Remote Sensing Carbon UptakeE, RESCUE, (Dnrs: 96/05 and 100/09) projects funded by the Swedish National Space Board, Swedish Research Council projects (2009-2994; 2008-6228; 2009-2994), and The Swedish Research Council Formas.
We are also grateful for the excellent support given by the Captain and crew onboard the
5
I/B Oden. We thank the Swedish Polar Research Secretariat, and the US National Science Foundation for preparative and logistical support for the Oden Southern Ocean expeditions.
References
Arneborg, L., W ˚ahlin, A. K., Bj ¨ork, G., Liljebladh, B., and Orsi, A. H.: Persistent inflow of warm water onto the central Amundsen shelf, Nat. Geosci., 5, 876–880, doi:10.1038/ngeo1644,
10
2012.
Arrigo, K. R. and Van Dijken, G. L.: Phytoplankton dynamics within 37 Antarctic coastal polynya systems, J. Geophys. Res., 108, 3271, doi:10.1029/2002JC001739, 2003.
Arrigo, K. R.: Carbon cycle: marine manipulations, Nature, 450, 491–492, doi:10.1038/450491a, 2007.
15
Bednarsek, N., Tarling, G. A., Bakker, D. C. E., Fielding, S., Cohen, A. L., Kuzirian, A., Mc-Corkle, D. C., L ´ez ´e, B., and Montagna, R.: Description and quantification of pteropod shell dissolution: a sensitive bioindicator of ocean acidification, Glob. Change Biol., 18, 2378– 2388, doi:10.1111/j.1365-2486.2012.02668.x, 2012.
Breitbarth, E., Bellerby, R. J., Neill, C. C., Ardelan, M. V., Meyerh ¨ofer, M., Z ¨ollner, E., Croot, P. L.,
20
and Riebesell, U.: Ocean acidification affects iron speciation during a coastal seawater meso-cosm experiment, Biogeosciences, 7, 1065–1073, doi:10.5194/bg-7-1065-2010, 2010. Caldeira, K. and Wickett, M. E.: Anthropogenic carbon and ocean pH, Nature, 425, 365 pp.,
doi:10.1038/425365a, 2003.
Chierici, M., Fransson, A., and Anderson, L. G.: Influence of m-cresol purple indicator additions
25
on the pH of seawater samples: correction factors evaluated from a chemical speciation model, Mar. Chem., 65, 281–290, 1999.
BGD
10, 7879–7916, 2013Ocean acidification state in western Antarctic surface
waters
M. Mattsdotter Bj ¨ork et al.
Title Page
Abstract Introduction
Conclusions References
Tables Figures
◭ ◮
◭ ◮
Back Close
Full Screen / Esc
Printer-friendly Version Interactive Discussion
Discussion
P
a
per
|
Dis
cussion
P
a
per
|
Discussion
P
a
per
|
Discussio
n
P
a
per
|
the Southern Ocean, Deep-Sea Res. Pt. II, 51, 2773–2787, doi:10.1016/j.dsr2.2001.03.002, 2004.
Chierici, M. and Fransson, A.: Calcium carbonate saturation in the surface water of the Arctic Ocean: undersaturation in freshwater influenced shelves, Biogeosciences, 6, 2421–2431, doi:10.5194/bg-6-2421-2009, 2009.
5
Chierici, M., Fransson, A., Lansard, B., Miller, L. A., Mucci, A., Shadwick, E., Thomas, H., Tremblay, J.-E., and Papakyriakou, T. N.: Impact of biogeochemical processes and environ-mental factors on the calcium carbonate saturation state in the Circumpolar Flaw Lead in the Amundsen Gulf, Arctic Ocean, J. Geophys. Res., 116, C00G09, doi:10.1029/2011JC007184, 2011.
10
Chierici, M., Signorini, S. R., Mattsdotter Bj ¨ork, M., Fransson, A., and Olsen, A.: Surface water fCO2 algorithms for the high-latitude Pacific sector of the Southern Ocean, Remote Sens. Environ., 119, 184–196, doi:10.1016/j.rse.2011.12.020, 2012.
Clayton, T. D. and Byrne, R. H.: Spectrophotometric seawater pH measurements: total hydro-gen ion concentration scale calibration of m-cresol purple and at-sea results, Deep-Sea Res.
15
I, 40, 2115–2129, 1993.
Comeau, S., Gorsky, G., Alliouane, S., and Gattuso, J.-P.: Larvae of the pteropod Cavolinia inflexa exposed to aragonite undersaturation are viable but shell-less. Mar. Biol., 157, 10, 2341–2345, doi:10.1007/s00227-010-1493-6, 2010.
Comiso, J. C. and Nishio, F.: Trends in the sea ice cover using enhanced and compatible
AMSR-20
E, SSM/I and SMMR data, Geophys. Res., 113, C02S07, doi:10.1029/2007JC004257, 2008. Deacon, G. E. R.: A general account of the hydrology of the South Atlantic Ocean, Discovery
Reports, 7, 171–238, 1933.
Dickson, A. G.: Standard potential of the (AgCl(s)+1/2H2(g)=Ag(s)+HCl(aq)) cell and the dissociation constant of bisulfate ion in synthetic sea water from 273.15 to 318.15 K, J. Chem.
25
Thermodynam., 22, 113–127, 1990.
Dickson, A. G., Sabine, C. L., and Christian, J. R. (Eds.): Guide to Best Practices for Ocean CO2Measurements, PICES Special Publication, 3, 191 pp., 2007.
Fabry, V. J., Seibel, B. A., Feely, R. A., and Orr, J. C.: Impacts of ocean acidification on marine fauna and ecosystem processes, ICES J. Mar. Sci., 65, 414–432, 2008.
30
BGD
10, 7879–7916, 2013Ocean acidification state in western Antarctic surface
waters
M. Mattsdotter Bj ¨ork et al.
Title Page
Abstract Introduction
Conclusions References
Tables Figures
◭ ◮
◭ ◮
Back Close
Full Screen / Esc
Printer-friendly Version Interactive Discussion
Discussion
P
a
per
|
Dis
cussion
P
a
per
|
Discussion
P
a
per
|
Discussio
n
P
a
per
|
Fetterer, F., Knowles, K., Meier, W., and Savoie, M.: Sea Ice Index, National Snow and Ice Data Center, Digital media, Boulder, Colorado, USA, 2002, updated 2009.
Fransson, A., Chierici, M., and Nojiri, Y.: New insights into the spatial variability of the surface water CO2 in varying sea ice conditions in the Arctic Ocean, Cont. Shelf Res., 29, 1317– 1328, doi:10.1016/j.csr.2009.03.008, 2009.
5
Fransson, A., Chierici, M., Yager, P. L., and Smith, W. O.: Antarctic sea ice carbon dioxide system and controls, J. Geophys. Res., 116, C12035, doi:10.1029/2010JC006844, 2011. Gattuso, J.-P. and Hansson, L.(Eds.): Ocean Acidification, Oxford University Press Inc., New
York, 2011.
Haraldsson, C., Anderson, L. G., Hassell ¨ov, M., Hulth, S., and Olsson, K.: Rapid, high precision
10
potentiometric titration of alkalinity in the ocean and sediment pore waters, Deep-Sea Res. I, 44, 2031–2044, doi:10.1016/S0967-0637(97)00088-5, 1997.
Jacobs, S. S. and Comiso, J. C.: Climate Variability in the Amundsen and Bellingshausen Seas, J. Climate, 10, 697–709, doi:10.1175/1520-0442(1997)010<0697:CVITAA>2.0.CO;2, 1997.
15
Jacobs, S. S., Hellmer, H. H., and Jenkins, A.: Antarctic ice sheet melting in the southeast Pacific, Geophys. Res. Lett., 23, 957–960, doi:10.1029/96GL00723, 1996.
Kwok, R. and Comiso, J. C.: Spatial patterns of Antarctic surface temperature: connections to the Southern Hemisphere Annular Mode and the Southern Oscillation, Geophys. Res. Lett, 29, doi:10.1029/2002GL015415, 2002.
20
LeQu ´er ´e C., R ¨odenbeck, C., Buitenhuis, E. T., Conway, T. J., Langenfelds, R., Gomez, A., Labuschagne, C., Ramonet, M., Nakazawa, T., Metzl, N., Gillett, N., and Heimann, M.: Sat-uration of the Southern ocean CO2sink due to recent climate change, Science, 316, 1735– 1738, 2007.
Lischka, S. and Riebesell, U.: Synergistic effects of ocean acidification and warming on
over-25
wintering pteropods in the Arctic, Glob. Change Biol., 3517–3528, doi:10.1111/gcb.12020, 2012.
Mucci, A.: The solubility of calcite and aragonite in seawater at various salinities, temperatures and at one atmosphere pressure, Am. J. Sci., 283, 781–799,1983
Orr, J. C., Fabry, V. J., Aumont, O., Bopp, L., Doney, S. C., Feely, R. A., Gnanadesikan, A.,
30
BGD
10, 7879–7916, 2013Ocean acidification state in western Antarctic surface
waters
M. Mattsdotter Bj ¨ork et al.
Title Page
Abstract Introduction
Conclusions References
Tables Figures
◭ ◮
◭ ◮
Back Close
Full Screen / Esc
Printer-friendly Version Interactive Discussion
Discussion
P
a
per
|
Dis
cussion
P
a
per
|
Discussion
P
a
per
|
Discussio
n
P
a
per
|
Yool, A.: Anthropogenic ocean acidification over the twenty-first century and its impact on calcifying organisms, Nature, 437, 681–686, 2005.
Pierrot, D., Lewis, E., and Wallace, D. W. R.: MS Excel Program developed for CO2system cal-culations, ORNL/CDIAC-105, Carbon Dioxide Information Analysis Center, Oak Ridge Na-tional Laboratory, US Department of Energy, Oak Ridge, Tennessee, 2006.
5
Rignot, E., Box, J. E., Burgess, E., and Hanna, E.: Mass balance of the Greenland ice sheet from 1958 to 2007, Geophys. Res. Lett., 35, L20502, doi:10.1029/2008GL035417, 2008. Roy, R. N., Roy, L. N., Vogel, K. M., Porter- Moore, C., Pearson, T., Good, C. E., Millero, F. J.,
and Campbell, D. M.: The dissociation constants of carbonic acid in seawater at salinities 5–45 and temperatures 0–45◦
C, Mar. Chem., 44, 249–267, 1993.
10
Roy, R. N., Roy, L. N., Vogel, K. M., Porter- Moore, C., Pearson, T., Good, C. E., Millero, F. J., and Campbell, D. M.: Erratum for: the dissociation constants of carbonic acid in seawater at salinities 5–45 and temperatures 0–45◦
C, Mar. Chem., 45, 337, 1994.
Sabine, C. L., Feely, R.A, Gruber, N., Key, R. M., Lee, K., Bullister, J. L., Wanninkhof, R., Wong, C.S, Wallace, D. W. R., Tilbrook, B., Millero, F. J., Peng, T.-H., Kozyr, A., Ono, T., and
15
Rios, A. F.: The oceanic sink for anthropogenic CO2, Science, 305, 367–371, 2004.
Sabine, C. L., Feely, R. A., Millero, F. J., Dickson, A. G., Langdon, C., Mecking, S., and Greeley, D.: Decadal changes in Pacific carbon, J. Geophys. Res., 113, C07021, doi:10.1029/2007JC004577, 2008.
Spreen, G., Kaleschke, L., and Heygster, G.: Sea ice remote sensing using AMSR-E 89 GHz
20
channels, J. Geophys. Res., 113, C02S03, doi:10.1029/2005JC003384, 2008.
Stammerjohn, S. E., Martinson, D. G., Smith, R. C., Yuan, X., and Rind, D.: Trends in Antarctic annual sea-ice retreat and advance and their relation to ENSO and southern annular mode variability, J. Geophys. Res., 113, C03S90, doi:10.1029/2007JC004269, 2008.
Steinacher, M., Joos, F., Fr ¨olicher, T. L., Plattner, G.-K., and Doney, S. C.: Imminent ocean
acid-25
ification in the Arctic projected with the NCAR global coupled carbon cycle-climate model, Biogeosciences, 6, 515–533, doi:10.5194/bg-6-515-2009, 2009.
Thoma, M., Jenkins, A., Holland, D., and Jacobs, S.: Modelling Circumpolar Deep Water intru-sions on the Amundsen Sea continental shelf, Antarctica, Geophys. Res. Lett., 35, L18602, doi:10.1029/2008GL034939, 2008.
30
BGD
10, 7879–7916, 2013Ocean acidification state in western Antarctic surface
waters
M. Mattsdotter Bj ¨ork et al.
Title Page
Abstract Introduction
Conclusions References
Tables Figures
◭ ◮
◭ ◮
Back Close
Full Screen / Esc
Printer-friendly Version Interactive Discussion
Discussion
P
a
per
|
Dis
cussion
P
a
per
|
Discussion
P
a
per
|
Discussio
n
P
a
per
|
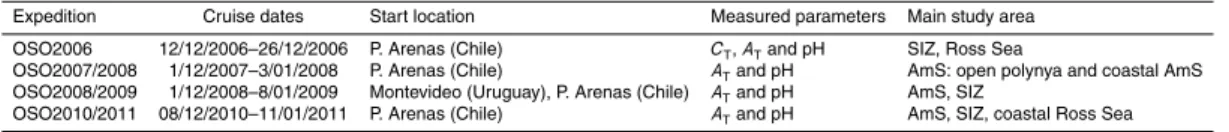
Table 1. Summary of cruise dates, start location, measured carbonate system parameters, and the main study area for each year. All expeditions ended in McMurdo Sound, Ross Sea. Continuous surface water measurements of chlorophylla, sea surface temperature (SST), and salinity (S) were performed during all four cruises. AmS denote the Amundsen Sea and SIZ refers to the seasonal ice zone.
Expedition Cruise dates Start location Measured parameters Main study area
OSO2006 12/12/2006–26/12/2006 P. Arenas (Chile) CT,ATand pH SIZ, Ross Sea
OSO2007/2008 1/12/2007–3/01/2008 P. Arenas (Chile) ATand pH AmS: open polynya and coastal AmS OSO2008/2009 1/12/2008–8/01/2009 Montevideo (Uruguay), P. Arenas (Chile) ATand pH AmS, SIZ
BGD
10, 7879–7916, 2013Ocean acidification state in western Antarctic surface
waters
M. Mattsdotter Bj ¨ork et al.
Title Page
Abstract Introduction
Conclusions References
Tables Figures
◭ ◮
◭ ◮
Back Close
Full Screen / Esc
Printer-friendly Version Interactive Discussion
Discussion
P
a
per
|
Dis
cussion
P
a
per
|
Discussion
P
a
per
|
Discussio
n
P
a
per
|
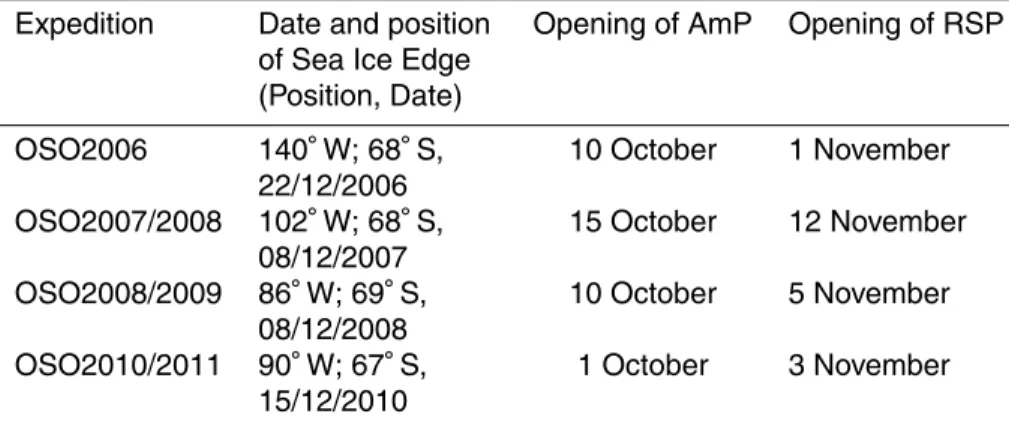
Table 2. Dates and positions for the arrival at the sea-ice edge, and the approximate date for the opening of the Amundsen Sea Polynya (AmP) and the Ross Sea Polynya (RSP), are summarized for each expedition.
Expedition Date and position of Sea Ice Edge (Position, Date)
Opening of AmP Opening of RSP
OSO2006 140◦W; 68◦S, 22/12/2006
10 October 1 November
OSO2007/2008 102◦
W; 68◦
S, 08/12/2007
15 October 12 November
OSO2008/2009 86◦
W; 69◦
S, 08/12/2008
10 October 5 November
OSO2010/2011 90◦
W; 67◦
S, 15/12/2010
BGD
10, 7879–7916, 2013Ocean acidification state in western Antarctic surface
waters
M. Mattsdotter Bj ¨ork et al.
Title Page Abstract Introduction Conclusions References Tables Figures ◭ ◮ ◭ ◮ Back Close
Full Screen / Esc
Printer-friendly Version Interactive Discussion Discussion P a per | Dis cussion P a per | Discussion P a per | Discussio n P a per |
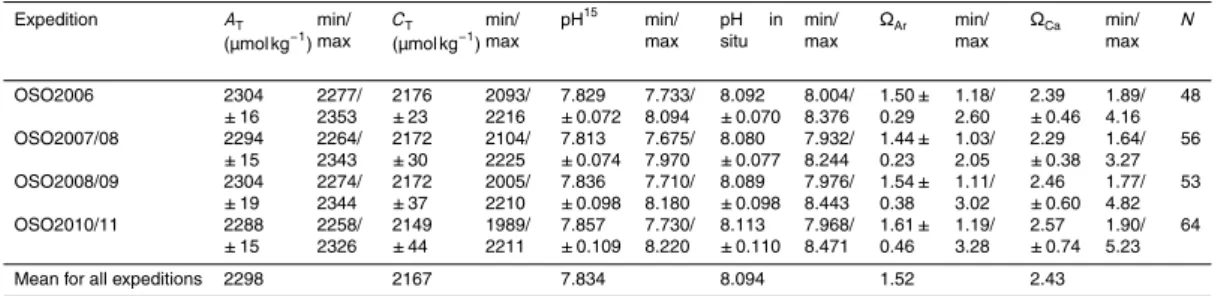
Table 3.Summary of the mean values and variability of the carbonate system parameters, total alkalinity (AT), total dissolved inorganic carbon (CT), pH on total scale at 15
◦
C (pH15), pH on total scale at in situ temperature (pH in situ), aragonite saturation (ΩAr), and calcite saturation (ΩCa). N denotes number of data points used in the study for each year. Minimum and maximum values are denoted min and max, respectively.
Expedition AT (µmol kg−1
) min/ max
CT (µmol kg−1
) min/ max
pH15 min/ max
pH in situ
min/ max
ΩAr min/ max
ΩCa min/ max N OSO2006 2304 ±16 2277/ 2353 2176 ±23 2093/ 2216 7.829 ±0.072 7.733/ 8.094 8.092 ±0.070 8.004/ 8.376 1.50± 0.29 1.18/ 2.60 2.39 ±0.46 1.89/ 4.16 48 OSO2007/08 2294 ±15 2264/ 2343 2172 ±30 2104/ 2225 7.813 ±0.074 7.675/ 7.970 8.080 ±0.077 7.932/ 8.244 1.44± 0.23 1.03/ 2.05 2.29 ±0.38 1.64/ 3.27 56 OSO2008/09 2304 ±19 2274/ 2344 2172 ±37 2005/ 2210 7.836 ±0.098 7.710/ 8.180 8.089 ±0.098 7.976/ 8.443 1.54± 0.38 1.11/ 3.02 2.46 ±0.60 1.77/ 4.82 53 OSO2010/11 2288 ±15 2258/ 2326 2149 ±44 1989/ 2211 7.857 ±0.109 7.730/ 8.220 8.113 ±0.110 7.968/ 8.471 1.61± 0.46 1.19/ 3.28 2.57 ±0.74 1.90/ 5.23 64
BGD
10, 7879–7916, 2013Ocean acidification state in western Antarctic surface
waters
M. Mattsdotter Bj ¨ork et al.
Title Page
Abstract Introduction
Conclusions References
Tables Figures
◭ ◮
◭ ◮
Back Close
Full Screen / Esc
Printer-friendly Version Interactive Discussion
Discussion
P
a
per
|
Dis
cussion
P
a
per
|
Discussion
P
a
per
|
Discussio
n
P
a
per
|
RSP
AmP
Getz Ice Shelf PIG
TG
BGD
10, 7879–7916, 2013Ocean acidification state in western Antarctic surface
waters
M. Mattsdotter Bj ¨ork et al.
Title Page
Abstract Introduction
Conclusions References
Tables Figures
◭ ◮
◭ ◮
Back Close
Full Screen / Esc
Printer-friendly Version Interactive Discussion
Discussion
P
a
per
|
Dis
cussion
P
a
per
|
Discussion
P
a
per
|
Discussio
n
P
a
per
|
-2 -1 0 1 2 3 4 5 6 7 8 9 10
-78 -76 -74 -72 -70 -68 -66 -64 -62 -60 -58 2006
2007/08 2008/09 2010/11
Seasonal Ice Zone (SIZ) Antarctic Zone (AZ)
RSP AmP
Dec Ice Edge (2006, 2007 and 2010) Dec Ice Edge
(2008)
PFZ
33.2 33.4 33.6 33.8 34 34.2 34.4 34.6
-78 -76 -74 -72 -70 -68 -66 -64 -62 -60 -58
S
a
lin
ity
(
p
su
)
Latitude S
2006 2007/08 2008/09 2010/11 Seasonal Ice Zone (SIZ)
Antarctic Zone (AZ)
RSP AmP
Dec Ice Edge (2006, 2007 and 2010)
Dec Ice Edge (2008)
PFZ
Fig. 2.The variability of(a)sea surface temperature (SST,◦
BGD
10, 7879–7916, 2013Ocean acidification state in western Antarctic surface
waters
M. Mattsdotter Bj ¨ork et al.
Title Page
Abstract Introduction
Conclusions References
Tables Figures
◭ ◮
◭ ◮
Back Close
Full Screen / Esc
Printer-friendly Version Interactive Discussion
Discussion
P
a
per
|
Dis
cussion
P
a
per
|
Discussion
P
a
per
|
Discussio
n
P
a
per
|
b a
BGD
10, 7879–7916, 2013Ocean acidification state in western Antarctic surface
waters
M. Mattsdotter Bj ¨ork et al.
Title Page
Abstract Introduction
Conclusions References
Tables Figures
◭ ◮
◭ ◮
Back Close
Full Screen / Esc
Printer-friendly Version Interactive Discussion
Discussion
P
a
per
|
Dis
cussion
P
a
per
|
Discussion
P
a
per
|
Discussio
n
P
a
per
|
PIG
TG
180W
Ross Sea RSP
Ross Sea
RSP RSP
RSP
BGD
10, 7879–7916, 2013Ocean acidification state in western Antarctic surface
waters
M. Mattsdotter Bj ¨ork et al.
Title Page
Abstract Introduction
Conclusions References
Tables Figures
◭ ◮
◭ ◮
Back Close
Full Screen / Esc
Printer-friendly Version Interactive Discussion
Discussion
P
a
per
|
Dis
cussion
P
a
per
|
Discussion
P
a
per
|
Discussio
n
P
a
per
|
0 1 2 3 4 5 6 7 8 9 10
-78 -76 -74 -72 -70 -68 -66 -64 -62 -60 -58
C
h
lo
ro
p
h
y
ll a (
µ
g
L
-1)
Latitude S
2006 2007/08 2008/09 2010/11
Seasonal Ice Zone (SIZ) Antarctic Zone (AZ)
Dec Ice Edge (2006, 2007, 2010)
Dec Ice Edge (2008)
PFZ
RSP AmP
Figure 5
Fig. 5. Surface water chlorophyll a concentrations for all years (2006: red; August 2007: blue; September 2008: green; November 2010: yellow), along the latitude (◦S). Note that the chla sensor range is between 0.1 to 10 µL−1
BGD
10, 7879–7916, 2013Ocean acidification state in western Antarctic surface
waters
M. Mattsdotter Bj ¨ork et al.
Title Page Abstract Introduction Conclusions References Tables Figures ◭ ◮ ◭ ◮ Back Close
Full Screen / Esc
Printer-friendly Version Interactive Discussion Discussion P a per | Dis cussion P a per | Discussion P a per | Discussio n P a per | 2250 2270 2290 2310 2330 2350
-78 -76 -74 -72 -70 -68 -66 -64 -62 -60 -58
To tal al kali n it y ( µ m o l k g -1)
Laitude S
2006 2007 2008 2010
Seasonal Ice Zone (SIZ) Antarctic Zone (AZ)
RSP AmP
Dec Ice Edge (2006, 2007 and 2010) Dec Ice Edge
(2008) PFZ a 7.60 7.70 7.80 7.90 8.00 8.10 8.20
-78 -76 -74 -72 -70 -68 -66 -64 -62 -60 -58
p H 1 5 ( to tal s ca le )
Laitude S
2006 2007 2008 2010
Seasonal Ice Zone (SIZ) Antarctic Zone (AZ)
RSP AmP
Dec Ice Edge (2006, 2007 and 2010) Dec Ice Edge
(2008) PFZ c 7.90 8.00 8.10 8.20 8.30 8.40 8.50
-78 -76 -74 -72 -70 -68 -66 -64 -62 -60 -58
p H in si t u (t o tal s cal e )
Laitude S
2006 2007 2008 2010
Seasonal Ice Zone (SIZ) Antarctic Zone (AZ)
RSP AmP
Dec Ice Edge (2006, 2007 and 2010) Dec Ice Edge
(2008) PFZ d 1.00 1.50 2.00 2.50 3.00 3.50
-78 -76 -74 -72 -70 -68 -66 -64 -62 -60 -58
A rag o n it e s a tu ra i o n s ta te
Laitude S
2006 2007 2008 2010
Seasonal Ice Zone (SIZ) Antarctic Zone (AZ)
RSP AmP
Dec Ice Edge (2006, 2007 and 2010) Dec Ice Edge
(2008) PFZ e ΩAr 1.00 1.50 2.00 2.50 3.00 3.50 4.00 4.50 5.00 5.50
-78 -76 -74 -72 -70 -68 -66 -64 -62 -60 -58
C a lc it e s a tu ra i o n s ta te
Laitude S
2006 2007 2008 2010
Seasonal Ice Zone (SIZ) Antarctic Zone (AZ)
RSP AmP
Dec Ice Edge (2006, 2007 and 2010) Dec Ice Edge
(2008) PFZ f ΩC a 1 975 2 000 2 025 2 050 2 075 2 100 2 125 2 150 2 175 2 200 2 225 2 250
-78 -76 -74 -72 -70 -68 -66 -64 -62 -60 -58
To tal i n o rg an ic c ar b o n ( µ m o l k g -1)
Laitude S
2006 2007 2008 2010
Seasonal Ice Zone (SIZ) Antarctic Zone (AZ)
RSP AmP
Dec Ice Edge (2006, 2007 and 2010) Dec Ice Edge
(2008)
PFZ
b
Fig. 6.Latitudinal variability of surface water,(a)total alkalinity,AT, µmol kg
−1
;(b)total dissolved inorganic carbon (CT, µmol kg
−1),(c)pH at 15◦
BGD
10, 7879–7916, 2013Ocean acidification state in western Antarctic surface
waters
M. Mattsdotter Bj ¨ork et al.
Title Page
Abstract Introduction
Conclusions References
Tables Figures
◭ ◮
◭ ◮
Back Close
Full Screen / Esc
Printer-friendly Version Interactive Discussion
Discussion
P
a
per
|
Dis
cussion
P
a
per
|
Discussion
P
a
per
|
Discussio
n
P
a
per
|
a b
c
TG PIG TG PIG
GIS GIS
BGD
10, 7879–7916, 2013Ocean acidification state in western Antarctic surface
waters
M. Mattsdotter Bj ¨ork et al.
Title Page
Abstract Introduction
Conclusions References
Tables Figures
◭ ◮
◭ ◮
Back Close
Full Screen / Esc
Printer-friendly Version Interactive Discussion
Discussion
P
a
per
|
Dis
cussion
P
a
per
|
Discussion
P
a
per
|
Discussio
n
P
a
per
|
TG PIG GIS TG PIG
GIS a
b
BGD
10, 7879–7916, 2013Ocean acidification state in western Antarctic surface
waters
M. Mattsdotter Bj ¨ork et al.
Title Page
Abstract Introduction
Conclusions References
Tables Figures
◭ ◮
◭ ◮
Back Close
Full Screen / Esc
Printer-friendly Version Interactive Discussion
Discussion
P
a
per
|
Dis
cussion
P
a
per
|
Discussion
P
a
per
|
Discussio
n
P
a
per
|
a b