TCD
7, 3611–3625, 2013A record of Antarctic sea ice extent in the
Southern Indian Ocean
C. Xiao et al.
Title Page
Abstract Introduction
Conclusions References
Tables Figures
◭ ◮
◭ ◮
Back Close
Full Screen / Esc
Printer-friendly Version Interactive Discussion
Discussion
P
a
per
|
D
iscussion
P
a
per
|
Discussion
P
a
per
|
Discuss
ion
P
a
per
|
The Cryosphere Discuss., 7, 3611–3625, 2013 www.the-cryosphere-discuss.net/7/3611/2013/ doi:10.5194/tcd-7-3611-2013
© Author(s) 2013. CC Attribution 3.0 License.
Geoscientific Geoscientific
Geoscientific Geoscientific
Open Access
The Cryosphere
Discussions
This discussion paper is/has been under review for the journal The Cryosphere (TC). Please refer to the corresponding final paper in TC if available.
A record of Antarctic sea ice extent in the
Southern Indian Ocean for the past 300 yr
and its relationship with global mean
temperature
C. Xiao1,2, R. Li2, S. B. Sneed3, T. Dou2, and I. Allison4
1
State Key Laboratory of Cryospheric Sciences, Cold and Arid Regions Environmental and Engineering Research Institute, Chinese Academy of Sciences, Lanzhou 730000, China
2
Institute of Climate System, Chinese Academy of Meteorological Sciences, Beijing 100081, China
3
Institute of Climate Change, University of Maine, Orono, ME, USA
4
Antarctic Climate and Ecosystems Cooperative Research Centre, Hobart, Australia
Received: 16 June 2013 – Accepted: 19 June 2013 – Published: 19 July 2013
Correspondence to: C. Xiao ([email protected])
TCD
7, 3611–3625, 2013A record of Antarctic sea ice extent in the
Southern Indian Ocean
C. Xiao et al.
Title Page
Abstract Introduction
Conclusions References
Tables Figures
◭ ◮
◭ ◮
Back Close
Full Screen / Esc
Printer-friendly Version Interactive Discussion
Discussion
P
a
per
|
D
iscussion
P
a
per
|
Discussion
P
a
per
|
Discuss
ion
P
a
per
|
Abstract
The differing response of ice extent in the Arctic and Antarctic to global average temper-ature change, over approximately the last three decades, highlights the importance of reconstructing long-term sea ice history. Here, using high-resolution ice core records of methanesulfonate (MS−) from the East Antarctic Ice Sheet in Princess Elizabeth
5
Land, we reconstruct southern Indian Ocean sea ice extent (SIE) for the sector 70◦E– 100◦E for the period 1708–2000 A.D. Annual MS− concentration positively correlates
in this sector with satellite-derived SIE for the period 1973–2000 (P <0.05). The 293 yr MS− record of proxy SIE shows multi-decadal variations, with large decreases occur-ring in two warm intervals duoccur-ring the Little Ice Age, and duoccur-ring the 1940s. However,
10
after the 1980s there is a change in phase between Antarctic SIE and global temper-ature change, with both increasing. This paradox is probably attributable to the strong anomaly in the Southern Annular Mode (SAM) in the recent three decades.
1 Introduction
Sea ice extent (SIE) is an important climate variable. It influences Earth’s surface
en-15
ergy balance, and plays a major feedback role in climate changes at local to hemi-spheric scales. However, reliable data on sea ice extent are only available for the satellite era, since the 1970s. This hinders our understanding of the role of sea ice in climate forcing and of the mechanisms of long-term changes in SIE. For instance, in recent decades there has been a strong trend of declining Arctic SIE, but a slightly
in-20
creasing trend in Antarctic SIE. Whether these opposing responses to warming global temperature are a long-term phenomena, or have only appeared in recent decades, is unknown, largely because of the short period of reliable sea ice records.
Although attempts have been made to reconstruct sea ice extent in Antarctica from voyage and whaling records (e.g. Cotte and Guinet, 2005; De la Mare and William,
25
TCD
7, 3611–3625, 2013A record of Antarctic sea ice extent in the
Southern Indian Ocean
C. Xiao et al.
Title Page
Abstract Introduction
Conclusions References
Tables Figures
◭ ◮
◭ ◮
Back Close
Full Screen / Esc
Printer-friendly Version Interactive Discussion
Discussion
P
a
per
|
D
iscussion
P
a
per
|
Discussion
P
a
per
|
Discuss
ion
P
a
per
|
methanesulfonate (CH3SO−or MS−) was found to be a sensitive proxy of SIE in some
sectors of Antarctica (e.g. Welch et al., 1993). This is because MS−(an oxidation prod-uct of dimethylsulphide, DMS, which is produced by sea ice algae) is released when sea ice decays, and there is hence a strong link between the extent of the ice and the amount of MS− produced.
5
Both positive and negative correlations have been observed between MS−and SIE in different sectors of Antarctica (Welch et al., 1993; Pasteur et al., 1995; Sun et al., 2002; Curran et al., 2003; Foster et al., 2006; Abram et al., 2007, 2010; Myerson et al., 2002; Sneed et al., 2011). But in the Indian Ocean sector, studies from Law Dome (110◦E; Curran et al., 2003) and Wilhelm II Land (86◦E; Foster et al., 2006) have shown positive
10
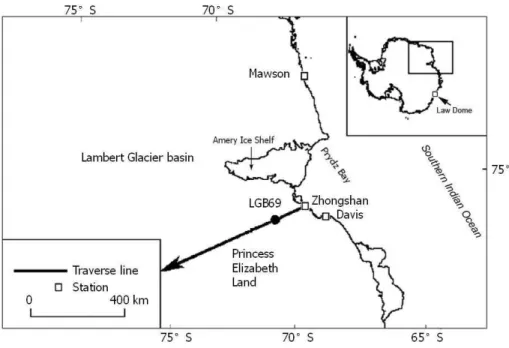
correlation between MS− and SIE, suggesting that the homogeneous coastline east of the Lambert Glacier basin (LGB) may be a good region to recover a long SIE record for the Southern Indian Ocean. However, there are still large geographical gaps in such reconstruction, with one of the largest being in the western part of this sector. Here, we analyze MS−records in an ice core that was extracted in January 2002 from site LGB69 15
(70◦50′S, 77◦04′E, 1850 m a.s.l.). This site is located on the coastal escarpment of the ice sheet, about 160 km from the coast. We statistically tested the relationship between MS−in this ice core and satellite observed SIE between 1973–2000 to establish a basis
for a long-term SIE reconstruction.
2 Ice core and sea ice data sets and their relationship
20
The LGB69 ice core was drilled in January 2002 in Princess Elizabeth Land (East Antarctica) during the 18th Chinese National Antarctica Research Expedition (CHINARE-18). The core was 102 m in length and was dated by counting 293 an-nual cycles of multiple chemical species as well as known volcanic events (Li et al., 2012), with very high dating accuracy (±1 yr at the bottom). Over this near-coastal
25
au-TCD
7, 3611–3625, 2013A record of Antarctic sea ice extent in the
Southern Indian Ocean
C. Xiao et al.
Title Page
Abstract Introduction
Conclusions References
Tables Figures
◭ ◮
◭ ◮
Back Close
Full Screen / Esc
Printer-friendly Version Interactive Discussion
Discussion
P
a
per
|
D
iscussion
P
a
per
|
Discussion
P
a
per
|
Discuss
ion
P
a
per
|
tomatic weather station and with a stake array (Qin et al., 2004; Ding et al., 2011). Thus ice cores from this region capture climatic signals from the adjacent high lati-tudes of the Southern Indian Ocean at high resolution. Earlier studies on an ice core from LGB65 (130 km further south), showed that a quasi-stationery low pressure sys-tem in the Southern Indian Ocean provides precipitation to Princess Elizabeth Land
5
(Xiao et al., 2004b).
We use SIE data between 1973–1996 derived by Jacka and Budd (1998) from the US Navy/NOAA Joint Ice Center (JIC) weekly maps of sea ice extent and concentration to provide the northern edge of the sea ice cover every 10◦of longitude and each month (http://staff.acecrc.org.au/~jacka/seaice.html). We extend the SIE data to 2000 AD
us-10
ing SMMR/SSM/I passive microwave remote sensing data from the US National Snow and Ice Data Center (NSIDC).
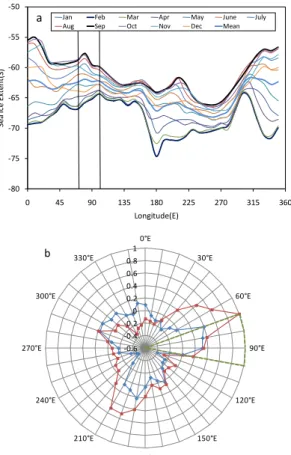
The mean monthly position of the SIE around Antarctica is shown in Fig. 2a for the period 1973–2000. The northernmost extent reaches 55◦S over the sector 20◦E–30◦E
at the seasonal maximum in September, and retreats as far south as 75◦S over the
15
sector 180◦E–190◦E at seasonal minimum in February. These extremes are due to ice drift resulting from complex ocean and atmospheric circulation in the deep embay-ments of the Ross and Weddell seas, which also produce the well-known sea ice dipole between the two sectors (Yuan et al., 2001). Over the more uniform coastline of East Antarctica between 60◦E and 150◦E, SIE changes have a relatively small seasonal 20
amplitude, and are generally similar across the region. Hence this may be a better region for the reconstruction of year-to-year long-term changes and we focus on the relationship between MS−in LGB69 and sea ice in this region.
We correlate the annual average MS− (from June to the following July) in the LGB69 core with maximum SIE (average of August to October extent in the first winter of
25
each record) over 36 sub-sectors of 10◦longitude for the period 1973–2000 (inclusive,
TCD
7, 3611–3625, 2013A record of Antarctic sea ice extent in the
Southern Indian Ocean
C. Xiao et al.
Title Page
Abstract Introduction
Conclusions References
Tables Figures
◭ ◮
◭ ◮
Back Close
Full Screen / Esc
Printer-friendly Version Interactive Discussion
Discussion
P
a
per
|
D
iscussion
P
a
per
|
Discussion
P
a
per
|
Discuss
ion
P
a
per
|
other more distant sectors of the Southern Ocean, they are largely due to the autocor-relation of the maximum SIE there with SIE at 70◦E (red lines in Fig. 2b). Clearly, MS− in LGB69 most strongly reflects the sea ice changes over the 70◦E–100◦E sector of the Southern Indian Ocean.
3 Sea ice extent and global temperature
5
In Fig. 3a we present the 293 yr MS−record from LGB69. It shows that there have been multi-decadal fluctuations of MS− (and thus of SIE) since 1708 AD. Large retreat of
SIE occurred in the 1750s, 1830s, 1940s and 1980s. To study the relationship between SIE and global temperature we use the 300 yr temperature anomaly for the Northern Hemisphere from the IPCC Fourth Assessment Report (Jansen et al., 2007). In Fig. 3b
10
we compare the smoothed MS− record with the HadCRUT2v temperature data since 1856 AD; the CRUTEM2V data since 1781 AD; and data from four European stations (central England, De Bilt, Berlin and Uppsala) since 1721 AD. Because data from the Southern Hemisphere are very sparse, and because current average trends are quiet similar between the hemispheres, we use the longer term NH record to investigate the
15
relationship between Antarctic SIE and global temperature.
The LGB69 MS− proxy SIE record reflects the major cooling/warming cycles over approximately the last 300 yr. In particular, it shows SIE retreat during two relatively warm periods during the late Little Ice Age, in 1740–1770 AD and in 1820–1840 AD. It also shows smaller SIE retreat occurring in the 20th century, around the 1940s, and in
20
the late 1970s to early 1980s. There is a relative expansion in SIE (derived from the MS− proxy) between these warm periods.
However, since the late 1980s, the global temperature and proxy sea ice relation-ship has switched phase: MS− and temperature have been increasing together. This is also evidenced from direct satellite observations of Antarctic SIE and ground-based
25
TCD
7, 3611–3625, 2013A record of Antarctic sea ice extent in the
Southern Indian Ocean
C. Xiao et al.
Title Page
Abstract Introduction
Conclusions References
Tables Figures
◭ ◮
◭ ◮
Back Close
Full Screen / Esc
Printer-friendly Version Interactive Discussion
Discussion
P
a
per
|
D
iscussion
P
a
per
|
Discussion
P
a
per
|
Discuss
ion
P
a
per
|
attributed to ozone depletion and resulting anomalies in the Southern Annular Mode (SAM) (Thompson and Solomon, 2002; Thompson et al., 2011).
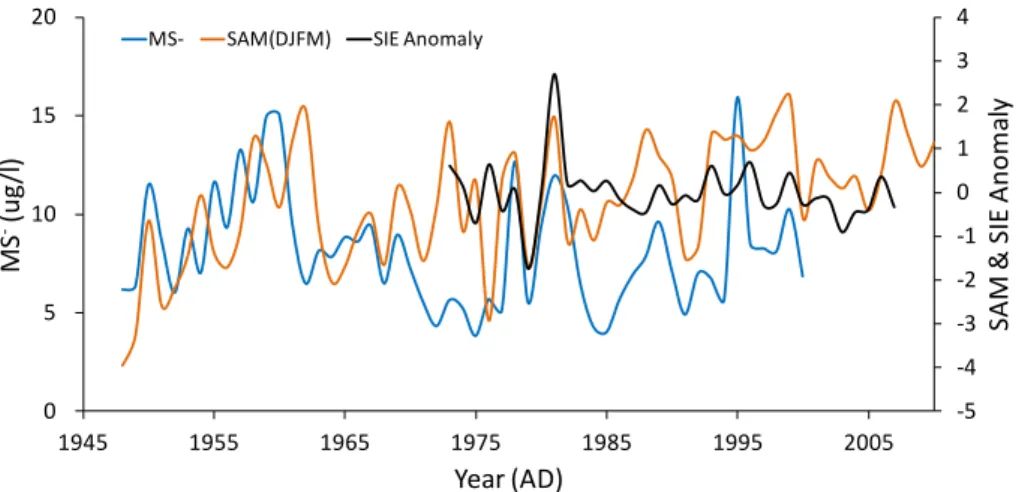
Hence we investigate the relationship between the LGB69 MS− proxy and SAM in-tensity over the last five decades. SAM was originally defined as the mean pressure difference between 40◦S and 60◦S (e.g. Gong and Wang, 1999), but Nan and Li (2003)
5
found that the pressure difference between 40◦S and 70◦S is a better indicator, and we use that later SAM index for monthly mean data between 1948 and 2010.
Both the summer SAM (December to March) and the LGB69 MS− in Fig. 4 display very high annual variability. The LGB69 MS− record broadly reflects the variations in summer SAM, and over the total period, correlates well with summer SAM (r =0.25,
10
N=53,p=0.10). This could result either because SAM and SIE are themselves cor-related, or because circulation changes associated with SAM directly influence MS− deposition on the ice sheet. For example, it is believed that there is a tight relation be-tween SAM and the strength of westerlies in the Southern Ocean (Bian et al., 2009), and a positive SAM tends to favor transportation of MS− from the sea ice zone to the
15
Antarctic continent. Greater extent of sea ice melt in the summer season also produces more MS−.
4 Sea ice changes over the wider Southern Indian Ocean
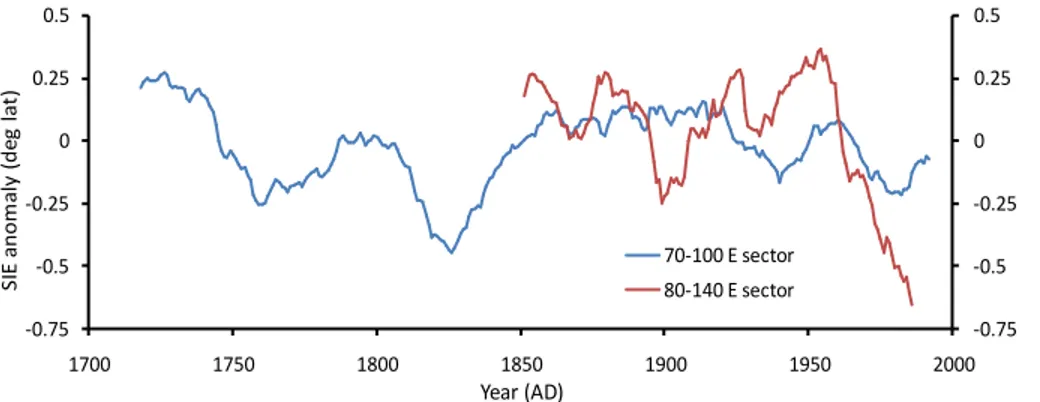
In Fig. 5 we compare the 20 yr smoothed SIE anomalies from our proxy for 70–100◦E with those derived by Curran et al. (2003) for the sector 80–140◦E. The anomalies in
20
both cases are calculated as the difference from the average proxy SIE for the 100 yr period from 1887 to 1986 (inclusive). The average proxy SIE for the 70–100◦E sector over this period is 58.7◦S and for the 80–140◦E sector, where the ice extent is narrower
(Fig. 2a), it is 59.9◦S.
The two anomaly curves show broad similarities in the timing of SIE changes,
al-25
TCD
7, 3611–3625, 2013A record of Antarctic sea ice extent in the
Southern Indian Ocean
C. Xiao et al.
Title Page
Abstract Introduction
Conclusions References
Tables Figures
◭ ◮
◭ ◮
Back Close
Full Screen / Esc
Printer-friendly Version Interactive Discussion
Discussion
P
a
per
|
D
iscussion
P
a
per
|
Discussion
P
a
per
|
Discuss
ion
P
a
per
|
decrease is indicated in both records, although the decrease for the 80–140◦E sector is
about one degree of latitude, whereas for 70–100◦E it is less than half a degree of lat-itude. Satellite observations show that trends in sea ice extent are not uniform around Antarctica (e.g. Comiso and Nishio, 2008), and may even be of opposite sign in diff er-ent regions. Sea ice concer-entration trends may also be regionally out of phase (Comiso,
5
2010) and the differences have been linked to large scale atmospheric circulation pat-terns. For example, Raphael (2007) shows a relationship between atmospheric zonal wave three and variability of Antarctic sea ice concentration, with a strong positive cor-relation between the two occurring in our study area offthe Amery ice shelf (70–80◦E). The proxy record for the 70–100◦E sector also shows a subsequent increase in SIE 10
since about 1985, which is confirmed by satellite observations, but is not covered in the DSS proxy record.
5 Conclusions
Methanesulfonate from an ice core from LGB69 in Princess Elizabeth Land, East Antarctica provides a proxy record of variations in Antarctic sea ice extent between
15
70◦E and 100◦E over about the past 300 yr. For most of this period there is a good
relationship between ice extent and global temperature with decreases in ice extent of about half a degree of latitude coinciding with warm periods around 1750 and 1830. Over the last 30 yr however the relationship between Antarctic SIE in this sector and global temperature has reversed, which is possibly a result of high latitude SH regional
20
cooling due to anomalies in the Southern Annular Mode (SAM). Factors other than SIE, such as SAM related circulation changes, may however also directly influence MS− deposition on Antarctica.
The proxy record of SIE for the 70–100◦E sector shows similar broad trends to an earlier MS− proxy record for the adjoining 80–140◦E sector. In particular there was 25
TCD
7, 3611–3625, 2013A record of Antarctic sea ice extent in the
Southern Indian Ocean
C. Xiao et al.
Title Page
Abstract Introduction
Conclusions References
Tables Figures
◭ ◮
◭ ◮
Back Close
Full Screen / Esc
Printer-friendly Version Interactive Discussion
Discussion
P
a
per
|
D
iscussion
P
a
per
|
Discussion
P
a
per
|
Discuss
ion
P
a
per
|
sectors. This highlights the fact that MS− records from ice cores generally provide proxy sea ice information over only a limited longitude band, and that no single ice core record is likely to provide a good record of overall Antarctic sea ice changes.
Acknowledgements. The study is supported by Ministry of Science and Technology of China (MoST, 2013CBA01804), Chinese Arctic and Antarctic Administration (CHINARE2012-01-02, 5
03) and State Key Laboratory of Cryopspheric Sciences (SKLCS2012-05), Chinese Academy of Sciences. The contribution of IA was supported by a grant from the Chinese Academy of Sciences Visiting Professorship for Senior International Scientists (No. Y129N31001). We thank Mark Curran for providing proxy sea ice data from the Law Dome DSS ice core.
References
10
Abram, N. J., Mulvaney, R., Wolff, E., and Mudelsee, M.: Ice core records as sea ice proxies:
an evaluation from the Weddell Sea region of Antarctica, J. Geophys. Res., 112, D15101, doi:10.1029/2006JD008139, 2007.
Abram, N. J., Thomas, E. R., McConnell, J. R., Mulvaney, R., Bracegirdle, T. J., Sime, L. C., and Aristarain, A. J.: Ice core evidence for a 20th century decline of sea ice in the Bellingshausen 15
Sea, Antarctica, J. Geophys. Res., 115, D23101, doi:10.1029/2010JD014644, 2010.
Bian, L. and Lin, X.: Interdecadal change of the Antarctic oscillation and the Antarctic circum-polar wave, Chinese J. Atmospheric Sciences, 33, 251–260, 2009 (in Chinese).
Comiso, J. C.: Polar Oceans from Space, doi:10.1007/978-0-387-68300-3, Springer Publishing, 2010.
20
Comiso, J. C. and Nishio, F.: Trends in the sea ice cover using enhanced and com-patible AMSR-E, SSM/I, and SMMR data, J. Geophys. Res.-Oceans, 113, C02S07, doi:10.1029/2007JC004257, 2008.
Cotté, C. and Guinet, C.: Historical whaling records reveal major regional retreat of Antarctic sea ice, Deep-Sea Res., 54, 243–252, 2007.
25
Curran, M. A. J., van Ommen, T. D., Morgan, V. I., Phillips, K. L., and Palmer, A. S.: Ice core evidence for Antarctic sea ice decline since the 1950s, Science, 302, 1203–1206, 2003. De la Mare and William, K.: Changes in Antarctic sea-ice extent from direct historical
TCD
7, 3611–3625, 2013A record of Antarctic sea ice extent in the
Southern Indian Ocean
C. Xiao et al.
Title Page
Abstract Introduction
Conclusions References
Tables Figures
◭ ◮
◭ ◮
Back Close
Full Screen / Esc
Printer-friendly Version Interactive Discussion
Discussion
P
a
per
|
D
iscussion
P
a
per
|
Discussion
P
a
per
|
Discuss
ion
P
a
per
|
Ding, M., Xiao, C., Li, Y., Ren, J., Hou, S., Jin, B., and Sun, B.: Spatial variability of surface mass balance along a traverse route from Zhongshan station to Dome A, Antarctica, J. Glaciol., 57, 658–666, 2011.
Foster, A. F. M., Curran, M. A. J., Smith, B. T., van Ommen, T. D., and Morgan, V. I.: Covariation of sea ice and methanesulphonic acid in Wilhelm II Land, East Antarctica, Ann. Glaciol., 44, 5
429–432, 2006.
Gong, D. and Wang, S.: Definition of Antarctic oscillation index, Geophys. Res. Lett., 26, 459– 462, 1999.
Jacka, T. H. and Budd, W. F.: Detection of temperature and sea ice-extent changes in the Antarctic and Southern Ocean, 1949–96. Ann. Glaciol., 27, 553–559, 1998.
10
Jansen, E., Overpeck, J., Briffa, K. R., Duplessy, J.-C., Joos, F., Masson-Delmotte, V., Olago, D.,
Otto-Bliesner, B., Peltier, W. R., Rahmstorf, S., Ramesh, R., Raynaud, D., Rind, D., Solom-ina, O., Villalba, R., and Zhang, D.: Palaeoclimate, in: Climate Change 2007: The Physical Science Basis. Contribution of Working Group I to the Fourth Assessment Report of the Intergovernmental Panel on Climate Change, edited by: Solomon, S., Qin, D., Manning, M., 15
Chen, Z., Marquis, M., Averyt, K. B., Tignor M., and Miller, H. L., Cambridge University Press, 433–497, Cambridge, United Kingdom and New York, NY, USA, 2007.
Li, R., Xiao, C., Sneed, S., and Yan, M.: A continuous 293-year record of volcanic events in an ice core from Lambert Glacier basin, East Antarctica, Antarct. Sci., 24, 293–298, doi:10.1017/S0954102011000897, 2012.
20
Myerson, E., Mayewski, P. A., Kreutz, K. J., Meeker, L. D., Whitlow, S. I., and Twickler, M. S.: The polar expression of ENSO and sea-ice variability as recorded in a South Pole ice core, Ann. Glaciol., 35, 430–436, 2002.
Nan, S. and Li, J.: The relationship between summer precipitation in the Yangtze River val-ley and the previous Southern Hemisphere Annular Mode, Geophys. Res. Lett., 30, 2266, 25
doi:10.1029/2003GL018381, 2003.
Pasteur, E. C., Mulvaney, R., Peel, D. A., Saltzman, E. S., and Whung, P. Y.: A 340-year record of biogenic sulphur from the Weddell Sea area, Antarctica, Ann. Glaciol., 21, 169–174, 1995. Qin, D., Xiao, C., Allison, I., Bian, l., Stephenson, R., Ren, J., and Yan, M.: Snow surface height
variations on the Antarctic ice sheet in Princess Elizabeth Land, Antarctica: 1 year of data 30
from an automatic weather station, Ann. Glaciol., 39, 181–187, 2004.
TCD
7, 3611–3625, 2013A record of Antarctic sea ice extent in the
Southern Indian Ocean
C. Xiao et al.
Title Page
Abstract Introduction
Conclusions References
Tables Figures
◭ ◮
◭ ◮
Back Close
Full Screen / Esc
Printer-friendly Version Interactive Discussion
Discussion
P
a
per
|
D
iscussion
P
a
per
|
Discussion
P
a
per
|
Discuss
ion
P
a
per
|
Sneed, S. B., Mayewski, P. A., and Dixon, D. A.: An emerging technique: ice-core multi-parameter correlations with Antarctic sea-ice extent, Ann. Glaciol., 52, 347–354, 2011. Sun, J., Ren, J., and Qin, D.: 60 years record of biogenic sulfur from Lambert Glacier basin firn
core, East Antarctica, Ann. Glaciol., 35, 362–367, 2002.
Thompson, D. and Solomon, S.: Interpretation of recent Southern Hemisphere climate change, 5
Science, 296, 895–899, doi:10.1126/science.1069270, 2002.
Thompson, D., Solomon, S., Kushner, P., England, M., Grise, K., and Karoly, D.: Signatures of the Antarctic ozone hole in Southern Hemisphere surface climate change, Nat. Geosci., 4, 741–749, doi:10.1038/ngeo1296, 2011.
Welch, K. A., Mayewski, P. A., and Whitlow, S. I.: Methanesulphonic acid in coastal Antarctic 10
snow related to sea ice extent, Geophys. Res. Lett., 20, 443–446, doi:10.1029/93GL00499, 1993.
Xiao, C., Allison, I., Ren, J., Qin, D., Zhang, M., and Li, Z.: Meteorological and glaciological
evidence for different climatic variations on the east and west sides of the Lambert Glacier
basin, Antarctica, Ann. Glaciol., 39, 188–194, 2004a. 15
Xiao, C., Mayewski, P., Qin, D., Li, Z., Zhang, M., and Yan, Y.: Sea level pressure variability over the southern Indian Ocean inferred from a glaciochemical record in Princess Elizabeth Land, east Antarctica, J. Geophys. Res., 109, D16101, doi:10.1029/2003JD004065, 2004b. Yuan, X. and Martinson, D.: The Antarctic Dipole and its predictability, Geophys. Res. Lett., 28,
TCD
7, 3611–3625, 2013A record of Antarctic sea ice extent in the
Southern Indian Ocean
C. Xiao et al.
Title Page
Abstract Introduction
Conclusions References
Tables Figures
◭ ◮
◭ ◮
Back Close
Full Screen / Esc
Printer-friendly Version Interactive Discussion
Discussion
P
a
per
|
D
iscussion
P
a
per
|
Discussion
P
a
per
|
Discuss
ion
P
a
per
|
-80 -75 -70 -65 -60 -55 -50
0 45 90 135 180 225 270 315 360
S
ea
Ic
e
E
x
ten
t(
S
)
Longitude(E)
Jan Feb Mar Apr May June July Aug Sep Oct Nov Dec Mean a
-0.6 -0.4 -0.2 0 0.2 0.4 0.6 0.8 1
0°E
30°E
60°E
90°E
120°E
150°E
180°E 210°E
240°E 270°E
300°E 330°E
b
Fig. 2. (a)Average Antarctic SIE as a function of longitude in different months for 1973–2000.
The vertical lines indicate the sector with the highest correlation between LGB69 MS− and
seasonal maximum SIE.(b)Correlation of LGB69 MS−with the seasonal maximum SIE in 10◦
longitude sub-sectors (blue). The autocorrelation of SIE at 70◦E with other sub-sectors is also
TCD
7, 3611–3625, 2013A record of Antarctic sea ice extent in the
Southern Indian Ocean
C. Xiao et al.
Title Page Abstract Introduction Conclusions References Tables Figures ◭ ◮ ◭ ◮ Back Close
Full Screen / Esc
Printer-friendly Version Interactive Discussion Discussion P a per | D iscussion P a per | Discussion P a per | Discuss ion P a per | 53 55 57 59 61 0 5 10 15 20
1700 1750 1800 1850 1900 1950 2000
S e a ic e e x te n t (S ) MS -(u g /l ) Year (AD) -61 -60 -59 -58 -57 -56
3 5 7 9 1113 15
S IE MS -R=0.41 a R=0.40 0 2 4 6 8 10 12 -0.9 -0.6 -0.3 0 0.3 0.6 0.9 1.2
1700 1750 1800 1850 1900 1950 2000
MS -(u g /l ) Tem p er a tu re a n o m a ly ( C) Year (AD)
Unfiltered HadCRUT2v HadCRUT2v CRUTEM2v 4 European stations MS- 20-year running
b
Fig. 3. (a)Variations in LGB69 MS− since 1708 AD (blue) and in SIE since 1973 AD (yellow).
The 3 yr-smoothed and 20 yr-smoothed MS− records are also shown. The linear correlation
between MS− and SIE for 1973–2000 is shown inset. (b)Temperature changes in the North
TCD
7, 3611–3625, 2013A record of Antarctic sea ice extent in the
Southern Indian Ocean
C. Xiao et al.
Title Page
Abstract Introduction
Conclusions References
Tables Figures
◭ ◮
◭ ◮
Back Close
Full Screen / Esc
Printer-friendly Version Interactive Discussion
Discussion
P
a
per
|
D
iscussion
P
a
per
|
Discussion
P
a
per
|
Discuss
ion
P
a
per
|
-5 -4 -3 -2 -1 0 1 2 3 4
0 5 10 15 20
1945 1955 1965 1975 1985 1995 2005
S
A
M
&
S
IE
A
n
o
m
a
ly
MS
-(u
g
/l
)
Year (AD) MS- SAM(DJFM) SIE Anomaly
Fig. 4.Variations of the summer Southern Annular Mode (SAM); MS−in LGB69; and the August
TCD
7, 3611–3625, 2013A record of Antarctic sea ice extent in the
Southern Indian Ocean
C. Xiao et al.
Title Page
Abstract Introduction
Conclusions References
Tables Figures
◭ ◮
◭ ◮
Back Close
Full Screen / Esc
Printer-friendly Version Interactive Discussion
Discussion
P
a
per
|
D
iscussion
P
a
per
|
Discussion
P
a
per
|
Discuss
ion
P
a
per
|
-0.75 -0.5 -0.25 0 0.25 0.5
-0.75 -0.5 -0.25 0 0.25 0.5
1700 1750 1800 1850 1900 1950 2000
S
IE
a
n
o
m
a
ly
(
d
e
g
la
t)
Year (AD)
70-100 E sector
80-140 E sector
Fig. 5.Antarctic sea ice extent anomalies for the 70–100◦E sector (LGB69 proxy) and the 80–