%& ' (%) * &+ &( %& % & &' %& (, - . ' /(&( * +()+ & 0 .+-&+
-0 ( (, 1 % .
%& . ' &
23( (& 0& %4 3
3& ' (5%.( % 6
.% )( 3. &
( %& 7
*8 8 "9 ( : (- ;
Autarquia associada à Universidade de São Paulo
AND
MAASTRICHT UNIVERSITY
Monte Carlo modelling of the patient and treatment delivery
complexities for high dose rate brachytherapy
Gabriel Paiva Fonseca
Thesis to obtain the degree of Doctor at Maastricht University, in accordance with the decision of the Board of Deans, and at Universidade de São Paulo in the field of
“Ciências na Área de Tecnologia Nuclear –
Reatores”.
Supervisors: Dr. Hélio Yoriyaz Dr. Frank Verhaegen Dr. Brigitte Reniers
Versão Corrigida
Versão original disponível no IPEN
São Paulo / Maastricht
Prof. Dr. Frank Verhaegen Prof. Dr. Hélio Yoriyaz
Co-supervisor
Dr. Brigitte Reniers
Assessment Committee – the Netherlands
Prof. Dr. Philip Lambin (chairman), Maastricht University Prof. Dr. Dietmar Georg, Medical University Vienna
Prof. Dr. Luc Beaulieu, University Laval, Quebec City, Canada Dr. Ans Swinnen, Maastro Clinic
Dr. Ludy Lutgens, Maastro Clinic
Assessment Committee – Brazil
Prof. Dr. Hélio Yoriyaz (chairman), Instituto de Pesquisas Energéticas e Nucleares Prof. Dr. Laura Natal Rodrigues, Universidade de São Paulo
Prof. Dr. Marcelo Baptista de Freitas, Universidade Federal de São Paulo Prof. Dr. Elisabeth Mateus Yoshimura, Universidade de São Paulo
Foremost, I would like to acknowledge my supervisors Prof. Dr. Hélio Yoriyaz, Prof. Dr. Frank Verhaegen and Dr. Brigitte Reniers for the opportunity, patience and dedication that without doubts were essential for this thesis and very important for my personal life.
Hélio, thank you for accept me as your student back in 2004, during my master and
Ph.D. This experience greatly improved my formation and guided me into the scientific career. Thanks for teach and work with me (even during your holidays) and for many pleasant moments.
Frank, thank you for providing me the opportunity to study in Europe and be part of your research team. I cannot describe how fortunate I was for being so well received and how it changed my perception of the world. Many thanks for the uncountable times you had to read my papers and for always (even being the busiest person I know) find time to teach and guide me.
Brigitte, thank you for find time to contribute with this thesis, for the innumerous and productive discussions and for being available even to visit different hospitals seeking for data that were very important.
This Ph.D would not be possible without a person who was part of my professional life only for a short period, but made very important contributions suggesting the subject of my master thesis and introducing me to Frank. Thank you Dr. Esmeralda Poli.
Guillaume, Mark and Shane, work with you was very important and I owe you a lot for it.
I had a terrific experience in the Netherlands and I owe it to you guys: Shane, Mark, Aniek, Ruud, Guillaume, Sean, Patrick, Raghu, Skadi, Karen, Sara, Ralph, Stefan, Davide, Daniela, Lucas, Evelyn, Emmanuel, Isabel, Lotte, Pedro, Ruben, Jurgen and Timo. Thanks for the laughs, runs, dinner, squash games (sorry for the bruises and scars) and for all the
help.
Thanks to the whole radiotherapy team in Brazil, in particular to Gabriela, Rodrigo and Camila, for the discussions and experiments late night or during the weekends. Your contribution was very important and I hope we can keep working together.
Michele, Murillo.
Thank you Louise for being with me all the time since 2002 and for your importance in my life. Your determination kept me on track and helped me to pursue my goals.
Finally, I would like to thank my beloved parents, Carlos e Madalena, my brother Rodrigo and my sisters Roberta e Juliana. I am thankful for being part of this family. The distance was tough, but your strength and love allowed me to keep going.
* The financial support provide by FAPESP was crucial to the development of this work.
Abstract
Brachytherapy treatments are commonly performed using the American Association of Physicists in Medicine (AAPM) Task Group report TG-43U1 absorbed dose to water formalism, which neglects human tissue densities, material compositions, body interfaces, body shape and dose perturbations from applicators. The significance of these effects has been described by the AAPM Task Group report TG-186 in published guidelines towards the implementation of Treatment Planning Systems (TPS) which can take into account the above mentioned complexities. This departure from the water kernel based dose calculation approach requires relevant scientific efforts in several fields. This thesis aims to improve brachytherapy treatment planning accuracy following TG-186 recommendations and going beyond it. A software has been developed to integrate clinical treatment plans with Monte Carlo (MC) simulations; high fidelity CAD-Mesh geometry was employed to improve brachytherapy applicators modelling; different dose report quantities, Dw,m (dose to water in medium) and Dm,m (dose to medium in medium), were obtained for a head and neck case using small cavity theory (SCT) and large cavity theory (LCT); the dose component due to the source moving within the patient was evaluated for gynecological and prostate clinical cases using speed profiles from the literature. Moreover, source speed measurements were performed using a high speed camera. Dose calculations using MC showed overdosing around 5% within the target volume for a gynecological case comparing results obtained including tissue, air and applicator effects against a homogeneous water phantom. On the other hand, the same comparison showed underdosing around 5% when including tissue and air composition for an interstitial arm case. A hollow cylinder applicator was responsible for the overdosing observed for the gynecological case highlighting the importance of accurate applicator modelling. The evaluated CAD-Mesh applicators models included a Fletcher-Williamson shielded applicator and a deformable balloon used for accelerated partial breast irradiation. Results obtained were equivalent to ones obtained with conventional constructive solid geometry and may be convenient for complex applicators and/or when manufacturer CAD models are available. Differences between Dm,m and Dw,m (SCT or LCT) are up to 14% for bone in a evaluated head and neck case. The approach (SCT or LCT) leads to differences up to 28% for bone and 36% for teeth. Differences can also be significant due to the source movement since some speed profiles from literature show low source speeds or uniform accelerated movements. Considering the worst case scenario and without include any dwell time correction, the transit dose can reach 3% of the prescribed dose in a gynecological case with 4 catheters and up to 11.1% when comparing the average prostate dose for a case with 16 catheters. The transit dose for a high speed (measured with a video camera) source is not uniformly distributed leading to over and underdosing, which is within 1.4% for commonly prescribed doses (3–10 Gy). The main subjects evaluated in this thesis are relevant for brachytherapy treatment planning and can improve treatment accuracy. Many of the issues described in here can be assessed with the software, coupled with a MC code, developed in this work.
Resumo
Tratamentos braquiterápicos são comumente realizados conforme o relatório da American Association of Physicists in Medicine (AAPM), Task Group report TG-43U1, o qual define o formalismo para cálculo de dose absorvida na água e não considera a composição dos materiais, densidades, dimensões do paciente e o efeito dos aplicadores. Estes efeitos podem ser significantes, conforme descrito pelo recente relatório da AAPM, Task Group report TG-186, que define diretrizes para que sistemas de planejamento modernos, capazes de considerar as complexidades descritas acima, sejam implementados. Esta tese tem como objetivo contribuir para o aumento da exatidão dos planejamentos de tratamento braquiterápicos, seguindo as recomendações do TG-186 e indo além do mesmo. Um software foi desenvolvido para integrar planejamentos de tratamento e simulações pelo método de Monte Carlo (MC); modelos acurados, CAD-Mesh, foram utilizados para representar aplicadores braquiterápicos; Grandezas utilizadas para reportar dose absorvida, Dw,m (dose para água no meio) e Dm,m (dose para o meio no meio), foram calculadas para um tratamento de cabeça e pescoço, considerando a teoria para pequenas (SCT – small cavity theory) e grandes cavidades (LCT – large cavity theory); a componente da dose em razão do movimento da fonte foi avaliada para tratamentos de próstata e ginecológicos. Perfis de velocidade obtidos na literatura foram utilizados; medidas de velocidade de uma fonte braquiterapica foram realizadas com uma câmera de alta taxa de aquisição. Cálculos de dose obtidos usando MC (incluindo a composição e densidade dos tecidos, ar e o aplicador) mostram sobredoses de aproximadamente 5% dentro do volume alvo, em um tratamento ginecológico, quando comparados aos resultados obtidos com um meio homogêneo de água. Por sua vez, subdoses de aproximadamente 5% foram observadas ao considerar a composição dos tecidos e regiões com ar em um tratamento intersticial de braço. Um aplicador cilíndrico oco resultou na sobredose observada no caso ginecológico, ressaltando a necessidade de modelos acurados para representar os aplicadores. Os modelos CAD-Mesh utilizados incluem um aplicador Fletcher-Williamson, com blindagem, e um balão deformável para irradiação de mama. Os resultados obtidos com estes modelos são equivalentes aos obtidos com modelos geométricos convencionais. Este recurso pode ser conveniente para aplicadores complexos e/ou quando o projeto dos aplicadores for disponibilizado pelo fabricante. Cálculos de dose, com a composição real dos tecidos humanos, podem apresentar diferenças significativas em razão da grandeza adotada. Diferenças entre Dm,m e Dw,m (SCT ou LCT) chegam a 14% em razão da composição do osso. A metodologia adotada (SCT ou LCT) resulta em diferenças de até 28% para o osso e 36% para os dentes. A componente de dose de trânsito também pode levar a diferenças significativas, uma vez que baixas velocidades ou movimentos uniformemente acelerados foram descritos na literatura. Considerando a pior condição e sem incluir nenhuma correção no tempo de parada, a dose de trânsito pode chegar a 3% da dose prescrita para um caso ginecológico, com 4 cateteres, e até 11.1% da dose prescrita para um tratamento de próstata, com 16 cateteres. A dose de trânsito para a fonte avaliada (velocidade obtida experimentalmente) não é uniformemente distribuída e pode levar a sub ou sobredoses de até 1.4% das doses comumente prescritas (3–10 Gy). Os tópicos estudados são relevantes para tratamentos braquiterápicos e podem contribuir para o aumento de sua acurácia. Os efeitos estudados podem ser avaliados com o uso do software, associado a um código MC, desenvolvido.
Summary
1 INTRODUCTION ... 2
1.1 AMIGOBrachy ... 3
1.2 CAD-Mesh... 3
1.3 Dose specification ... 4
1.4 Transit dose ... 6
1.5 Speed Measurements... 8
2 OBJECTIVES ... 10
3 LITERATURE REVIEW ... 12
3.1 Brachytherapy history and current practice ... 12
3.2 MC methods in brachytherapy ... 19
4 MATERIALS AND METHODS ... 23
4.1 Monte Carlo codes ... 23
4.2 AMIGOBrachy ... 25
4.3 CAD-Mesh... 30
4.4 Dose specification (Dw,m and Dm,m) ... 37
4.5 Transit dose ... 39
4.6 Speed measurements ... 46
5 RESULTS AND DISCUSSIONS ... 50
5.1 AMIGOBrachy ... 50
5.2 CAD-Mesh... 54
5.3 Dose specification ... 61
5.4 Transit dose ... 71
5.5 Speed measurements ... 78
6 CONCLUSIONS ... 85
8 LIST OF PUBLICATIONS ... 91
8.1 Published articles... 91
8.2 Conferences ... 92
9 CURRICULUM VITAE ... 94
10 REFERENCES... 96
11 VALORIZATION ADDENDUM ... 107
11.1 Innovation ... 107
11.2 Clinical relevance ... 109
11.3 Societal relevance ... 109
Figure List
Figure 1. a) mass energy absorption coefficients (µen/) of various human tissues relative to water coefficients. Values for elemental media obtained from NIST39 and combined into human tissues using the mass-fraction of each element. b) Unrestricted mass collision
stopping power /� ratios of various human tissues relative to those for water. Values obtained using ESTAR database considering the mass-fraction of each element.40 ... 6 Figure 2. Remote afterloaders from two manufacturers: Left – microSelectron HDR (Nucletron, an Elekta company, Stockholm, Sweden); Right – GammaMed Plus iX (Varian Medical Systems, Inc., Palo Alto, CA). ... 13 Figure 3. a) TRUS image of a prostate patient; b) CT image of a head and neck patient; c) MRI image of a gynecological patient; d) 3D reconstruction from CT images including the clinical target volume (CTV) in red. ... 16 Figure 4. CT slices of a head and neck patient showing metal artifacts. ... 17 Figure 5. Ratio between dose distributions obtained with MC with and without including the
Fletcher Williamson applicator. The dark blue region represents the applicator. ... 19
Figure 6. Number of papers per year including the term ‘Monte Carlo’. Results of a PubMed search (20 January 2015). ... 20
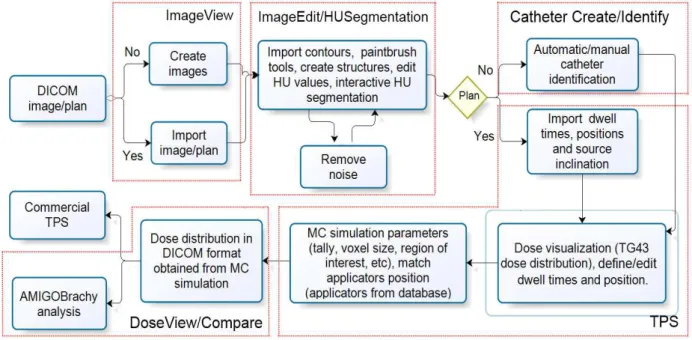
Figure 7. Flowchart with AMIGOBrachy’s main functionalities, which are described in the
user-guide. The process starts with importing or creating a DICOM sequence of images, followed by defining the simulation parameters and initiating MCNP6, and finishes by importing and analyzing the simulated dose distributions. ... 26 Figure 8. A 180º tungsten shielded applicator modeled using: a) analytical geometry; b) (1x1x1) mm3 voxels; c) mesh structures created with AbaqusTM. The dimensions are based on the GM11004380 applicator (Varian Medical Systems) and on the ACUROSTM applicator database. ... 27 Figure 9. A sequence of images used by AMIGOBrachy: a) importing the DICOM patient CT image; b) defining structures by importing DICOM contours (e.g. the highlighted bone contours); c) defining the material map (using HU numbers or drawing tools), which consists of air (black region), adipose tissue (blue region), muscle (green region) and bone (yellow region); d) defining the voxel phantom region (external rectangle) and the dose scoring region (internal rectangle). ... 29 Figure 10. Example MG for the idealized APBI applicator showing the external surface and
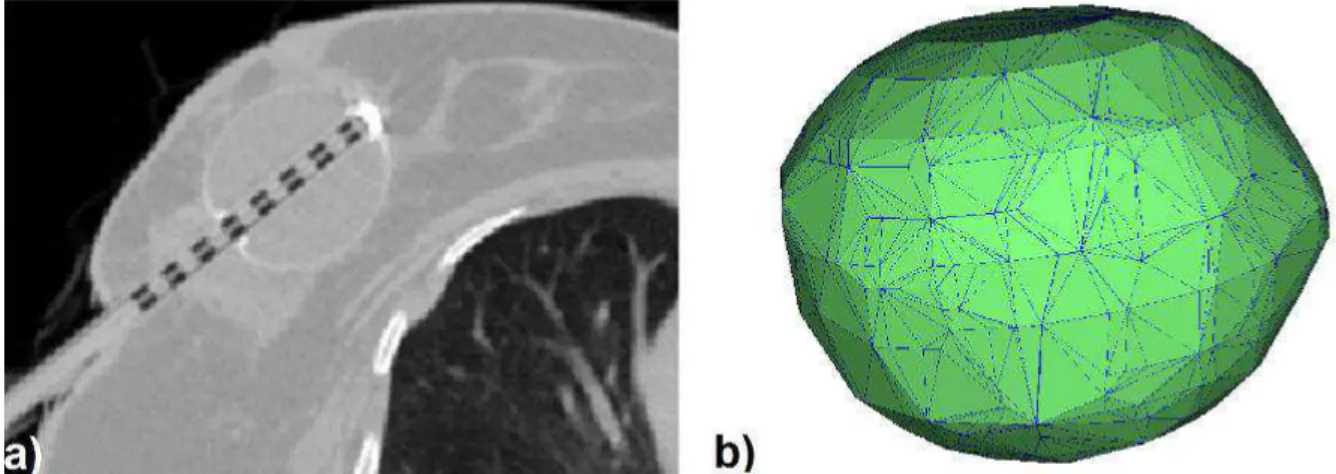
Figure 11. a) Axial CT image of an APBI balloon applicator inserted in a post surgical breast cavity. The wall is clearly visible due to barium loading. The EBS channel is occupied by a dummy insert to identify dwell positions. The balloon is filled with a saline solution. The high intensity pixels correspond to the end cap. Neither saline solution nor end cap are modeled in this thesis. b) MG for the APBI applicator showing the external surface. ... 33 Figure 12. Schematic representation of the shielded cylindrical vaginal applicator. ... 34 Figure 13. CAD representation of the Fletcher Williamson applicator (from AbaqusTM). ... 35 Figure 14. Axial and sagittal view of the evaluated head and neck clinical case. The numbers indicate voxels positions where the photon spectrum was scored. Green arrows and squares were added to show the catheter positions (five of the six catheters can be visualized). ... 37
Figure 15. a) Source moving between three dwell positions with inter-dwell distance of 0.5 cm. b) Source speed profile for a uniform accelerated movement. c) Contribution of each source position to transit dose at the reference point due the source traveling between the dwell positions and returning to the safe. ... 42 Figure 16. Experimental setup for source speed measurements. The insert (top-right) was obtained from one of the acquired slow motion videos. The source guide was positioned to be clinically relevant avoiding excessive bending during the experiments. ... 46 Figure 17. AMIGOBrachy screenshots of a) AMIGOBrachy ImageView module; b) 3D rendering of lungs; c) dose distribution of a single source dwell position with dose profiles; d) dose distribution obtained using a titanium fletcher applicator and a sequence of source dwell positions. ... 50 Figure 18. Results for the two patient geometries: the intracavitary gynecological case (left panels) and the interstitial arm case (right panels). a) 3D view indicating the assigned materials. b) Isodoses and dose ratio ACUROSTM/MCNP6. c) Isodoses and dose ratio MCNP6(homogeneous water)/MCNP6(heterogeneous geometry). ... 53 Figure 19. Calculation times in seconds for simulating 107 primary photons from an 192Ir source in a water cube represented by a MG with varying number of volume elements. ... 55 Figure 20. (a) Inside the balloon wall there appears to be a lack of backscatter from the
the low values of the ratio. Isodoses overlap for (a) and (b) due to the small differences obtained. The first two colour maps show a histogram (black) of the distribution of values of the dose ratio over the whole phantom volume. ... 56 Figure 22. a) The MG of the irregular balloon. b) Axial plot of dose ratios obtained from MCNP6 and Geant4 using the MG of the balloon and a 50 kV photon point source. Isodose lines are also presented. Dose in the balloon wall was not scored in Geant4 hence the low values of the ratio. The color map shows a histogram (extreme right) of the dose ratio distribution over the whole phantom volume. ... 57 Figure 23. a) APBI balloon applicator wall represented by voxels. b) Axial dose ratio obtained from MCNP6 using the voxel and MG models of the balloon. ... 57
Figure 24. a) Dose ratio in central axial, coronal and sagittal slices from Geant4 and MCNP calculations of the dose distribution from the shielded HDR vaginal applicator represented with MG containing 16530 elements. b) The dose ratio when representing the applicator with a MG of 16530 elements in MCNP and a CSG representation. Differences are not visible in these figures (b) since most of the results are within 0.5% with maximum difference around 1%. c) Dose ratio between MG and CSG applicator models in MCNP using 129860 elements for the MG. Isodoses inside of the applicator were not shown. ... 59 Figure 25. Calculation times in seconds for 107 primary photons from an 192Ir source with the W shield from the vaginal applicator represented by a MG with varying number of volume elements. ... 60 Figure 26. Dose ratios between Geant4 and MCNP6, using MG models. a) Axial slice. b) Sagittal slice of the dose ratio. c) Coronal slice. Isodose lines from both codes are also plotted. ... 60 Figure 27. a) MG representation of the shielded Fletcher Williamson applicator used for validation purposes. The MG geometry was exported by MCNP6 as an output file 117. Ratio between MCNP6 (CSG) and Geant4 (MG): b) sagittal slice of the dose ratio; c) axial slice; d) coronal slice. ... 61 Figure 28. Axial (a) and sagittal (b) spatial distribution of the mean photon energy
same mass densities; c) phantom III over phantom I. This shows the atomic number and density effects that approximately compensate each other. Contours in black represent bone tissue. ... 62 Figure 30. a) Photon spectrum emitted from the stainless steel capsule (averaged over all angles of a single source) and at two evaluated voxels, P9 and P13. Values were normalized for the total fluence in their respective voxel and grouped using 5 keV energy bins. Most of the photons from the source are concentrated on the peaks of the spectrum that represent the primary photons. Only values between 0 and 600 keV were displayed to highlight differences in this region. ... 63 Figure 31. Ratio (Dm,m / Dw,m(LCT))obtained using a track length estimator tally. Uncertainty <1% for all points inside of the CT volume (Type A ±1σ). Regions with air were excluded. . 65 Figure 32. Ratio between Dm,m and Dw,m(LCT)values presented in table 2. Values obtained using SCT, dotted lines, were added. ... 67 Figure 33. Contribution of various parts of the photon spectrum to the total dose at two evaluated voxels, P9 and P13. Photons with energies greater than 650 keV contribute less
than 0.3% of the total dose. Uncertainty <1% for the total dose (Type A ±1σ). ... 68 Figure 34. Ratio between conversion coefficients (Dw,m(LCT) / Dw,m(SCT)). Uncertainty <1% for all points inside of the CT volume (Type A ±1σ). ... 70 Figure 35. a) Source instantaneous speed, derived from the source trajectory and dwell positions, for each discrete source position compared against analytical calculation for the source approaching the first dwell position at 5 cm and moving between the dwell positions (right to left) up to the last dwell position that was defined as the origin; b) instantaneous speed validation for the source coming back to the safe; c) BrachyVisionTM ring applicator showing the dwell positions (black boxes) superimposed over a transit dose distribution without the dwell dose component. ... 72 Figure 36. Gynecological case b (transverse plane): a) isodoses obtained considering the dwell dose and the total dose, which corresponds to the transit dose added to the dwell dose distribution; b) transit dose component as a percentage of the dwell dose without dwell time
Figure 38. Prostate case d (transverse plane): a) Isodoses over a CT slice with the catheters corresponding to the boundaries of the prostate contour; b) transit dose percentage compared against the dwell dose. c) corrected transit dose percentage compared against the dwell dose. Figures b and c are shown using different scales. ... 75 Figure 39. a) Source speed profile for the source arriving at the first dwell position (0 cm) and returning to the safe. Uncertainties Type A and Type B are almost equivalent so only
Type B component is shown. b) . values were obtained for six dwell positions equally spaced between 0 and 5 cm (vertical dotted lines). c) . values were obtained for the source
Table List
Table 1. Average source speed between dwell positions for various inter-dwell distances � reported in the literature for afterloaders from Nucletron (microSelectron), Varian (GammaMed Plus) and for Eckert & Ziegler BEBIG GmbH MultiSource (192Ir HDR). ... 7 Table 2. Material properties of the steel channel and tungsten shield of the shielded vaginal applicator (see Figure 12). Elemental composition expressed in percentage of weight (%w). 34 Table 3. The conversion coefficients from Dm,m to Dw,m(SCT) obtained using average mass stopping power ratios for some materials evaluated in this study. ... 65 Table 4. Ratio between Dm,m and Dw,m (LCT) obtained with the photon spectrum and with the mean photon energy scored (phantom III) for the 25 evaluated voxels (Figure 14). The minimum and the maximum values of each column are underscored. Mandible corresponds to mandible spongiosa from ICRP Report 110 129. Uncertainty is <1% for all dose ratios
(Type A ±1σ). Dm/w indicates Dm,m/Dw,m-LCT. ... 66 Table 5. Transit dose for a reference point orthogonal to the catheter’s longitudinal axis and
LIST OF ABREVIATIONS
ACE Advanced Calculation Engine
AMIGOBrachy A Medical Image-based Graphical platfOrm - Brachytherapy module
APBI Accelerated Partial Breast Irradiation
AAPM American Association of Physicists in Medicine
CAD Computer-Aided Design
CSG Constructive Solid Geometry
CT Computed Tomography
CPE Charged Particle Equilibrium
Dw,w Dose to water in water
Dm,m Dose to medium in medium
Dw,m Dose to water in medium Dn,m Dose to a cell nuclei in medium
DE/DF Dose Energy/Dose Function MCNP cards used to define mass-energy absorption coefficients
EBRT External Beam Radiotherapy
EBS Electronic Brachytherapy Source
EGS Electron Gamma Shower
F4/F6 MCNP cards to define a track length tally
GATE Geant4 Application for Tomographic Emission
GEANT GEometry ANd Tracking
HDR High dose rate
LBTE Linear Boltzmann Transport Equation
LCT Large Cavity Theory
MBDCA Model-Based Dose Calculation Algorithms
MC Monte Carlo
MCNP Monte Carlo N-Particle
MG Mesh Geometry
MOSFET Metal Oxide Semiconductor Field Effect Transistor
MRI Magnetic Resonance Imaging
PENELOPE Penetration and ENErgy LOss of Positrons and Electrons
QA Quality Assurance
SCT Small cavity theory
SPDTL MCNP card to use lattice speed tally enhancement
TG Task Group
TLD Thermoluminescent Dosimeter
TPS Treatment Planning System
INTRODUCTION
1 INTRODUCTION
Brachytherapy treatments are commonly performed using the American Association of Physicists in Medicine (AAPM) Task Group report TG-43U11, 2 absorbed dose to water formalism, which neglects human tissue densities, material compositions, body interfaces, body shape and dose perturbations from applicators. These effects can be significant3, 4 in the brachytherapy photon energy range and can be included in modern treatment planning systems (TPS) for brachytherapy by using model-based dose calculation algorithms
(MBDCA). This new approach is needed to replace the TG-43U1 absorbed dose to water
formalism with a more accurate dose estimation procedure.
The AAPM Task Group report TG-1865 recently issued guidelines towards
implementing TPS, which can take the above mentioned complexities into account. The report recommends performing model based dose calculations such as the ones based on Monte Carlo (MC) simulations,6-8 finite element modelling9-11 or collapsed cone convolution.12-15 This departure from the water kernel based dose calculation approach entails adequate modelling of applicators employed in source delivery for brachytherapy for both low energy (<50 keV) and high energy (>50 keV) photon sources.
TG-186 describes several areas where relevant scientific efforts are necessary to move towards MBDCA. This thesis comprehends some of these subjects and other issues relevant for brachytherapy. 192Ir High Dose Rate (HDR) treatments are the most relevant, but not exclusive, subject of this study, which comprehends five main approaches: a) development of a MBDCA algorithm as an auxiliary software to process treatment planning data, AMIGOBrachy (A Medical Image-based Graphical platfOrm - Brachytherapy module);6 b) the use of high fidelity CAD (Computer Aided Design)-Mesh geometry to improve brachytherapy applicators modeling;16 c) study of different dose report quantities;5 d) evaluation of the transit dose component for gynecological and prostate clinical cases using speed profiles from the literature;17 e) measurement of the source speed using a high speed camera since potentially relevant transit dose components were obtained using speed profiles from literature.
1.1 AMIGOBrachy
Several MBDCA software packages have been developed; two commercial TPS, ACUROSTM (Transpire Inc., Gig Harbor, WA)10, 11, 18 and the Advanced Calculation Engine (ACE) (Nucletron – an Elekta Company, Veenendaal, the Netherlands),12, 14, 15, 19 and several in-house MC based algorithms.6, 20, 21 Some MBDCA employ MC simulation codes, which offer a high accuracy for dose calculations. However, most MC codes lack a user-friendly
interface to process the input and output data of brachytherapy dose calculations. This may
involve several medical images, imaging artifact corrections, up to hundreds of dwell
positions, and source and applicator geometries.
AMIGOBrachy6 is a software module developed using MATLAB version 8.0 (Mathworks Inc., Natick, MA) to create an efficient and powerful user-friendly graphical interface, needed to integrate clinical treatment plans with MC simulations. It does this by
providing the main resources required to process and edit images, import and edit treatment
plans, set MC simulation parameters, run MC simulations and analyze the results. In the current implementation, the MCNP6 (Monte Carlo N-Particle version 6)22 MC code is used
for the simulations. AMIGOBrachy’s design, main functionalities and the validation process
were described including two clinical cases; one intracavitary gynecological case and one interstitial arm sarcoma case, both treated with an 192Ir source.
1.2 CAD-Mesh
The modelling of complex brachytherapy applicators can be suboptimal when using a voxel based geometry due to the sub-voxel dimensions of specific components. This may lead to volume averaging of the details of the geometry in coarse voxels, and may therefore lead to dose calculation errors propagating in the whole geometry. The combination of a voxelized Cartesian grid (representing the Computed Tomography (CT) derived patient geometry) and constructive solid geometry (CSG) describing the applicator allows applicator modelling. However, applicator modelling using CSG can be tedious, may not allow complete fidelity or may be highly impractical, as in the case of deformable balloon
applicators employed in accelerated partial breast irradiation (APBI).
available. This methodology has been employed by commercial deterministic particle transport software capable of handling mesh geometries (MG).9, 11 Recent versions of general purpose MC codes have the ability to simulate radiation transport in tessellated or MG, thus potentially facilitating the modelling of complex brachytherapy applicators.
MG modelling was evaluated by comparison to CSG modelling of a selection of brachytherapy applicators: the Fletcher Williamson gynecological 192Ir HDR brachytherapy applicator, successfully modelled using CSG techniques by several groups,18, 23-27 a shielded vaginal HDR applicator and an accelerated partial breast irradiation (APBI) balloon applicator used with a 50 kV electronic brachytherapy source (EBS). Dose distributions were obtained using the Geant428 and MCNP629 general purpose MC codes.
1.3 Dose specification
TG1865 provides guidelines to take patient and applicator non-water materials into account and also describes the different dose reporting quantities possible; dose to medium in medium (Dm,m), and dose to water in medium (Dw,m). Differences between dose reporting in terms of Dm,m and Dw,m have been discussed in the literature 5, 30, 31 with arguments in favor and against both quantities.
The way to define Dw,m depends on assumptions in the employed cavity theory regarding the cavity dimensions compared to the ranges of secondary electrons. Absorbed dose can be calculated to a small water cavity of cellular dimensions or to a large water cavity of dimensions similar to the CT defined voxels used in MBDCA treatment planning. Large Cavity Theory (LCT) uses the ratio of mass-energy absorption coefficients (water/medium), µ / �, assuming charged particle equilibrium (CPE) for the cavity of interest 32, 33. Small Cavity Theory (SCT) uses the ratio between mass stopping power (water/medium), /� �, for Bragg-Gray cavities with dimensions much smaller than the
secondary electron ranges.5, 34
In external beam radiotherapy (EBRT), where ranges of secondary electrons are
Carlsson Tedgren and Alm Carlsson evaluated, using the Burlin theory, when cavity dimensions ranging from 1 nm to 10 mm could be assumed large, small or intermediate at various photon energies of relevance to brachytherapy. Assumed dimensions water cavity could be of interest to evaluate the correlation between dose reporting quantities and biological effects.34, 36 Lindborg et al. recently found the clinical radiobiological effect (RBE) for radiotherapy modalities ranging from kV x-rays to protons and heavier ions to correlate with the microdosimetric quantity mean linear energy when the latter was evaluated in volumes of nm dimensions.37 The reporting dose quantities for a cell nucleus (Dn,m) of µm dimension, Dw,m and Dm,m were evaluated by Enger et al. for different cell nucleus compositions.38
TG-186 recommends that Dm,m should always be reported and states that more studies are necessary on how to calculate Dw,m before any definitive recommendation can be made as to which quantity is optimal. Differences between the quantities Dm,m and Dw,m (LCT) are considerably smaller for the 192Ir spectrum than for low photon energy (<50 keV) isotopes
due to its relatively high photon energies (initial mean energy ≈ 355 keV). Figure 1.a shows how ratios of mass-energy absorption coefficients (µen/) between tissues and water increase at lower photon energies. However, as the photon spectrum changes away from the implanted sources due to the combined effect of attenuation of primary- and buildup of scattered-photons, larger differences between Dm,m and Dw,m(LCT) should occur also around an 192Ir implant. Differences between Dm,m and Dw,m(SCT) are likely to be much less relevant since ratios of mass collision stopping powers /� � are approximately independent of the
energy (see Figure 1.b).
Figure 1. a) mass energy absorption coefficients (µen/) of various human tissues relative to water coefficients. Values for elemental media obtained from NIST39 and combined into human tissues using the mass-fraction of each element. b) Unrestricted mass collision
stopping power /� ratios of various human tissues relative to those for water. Values obtained using ESTAR database considering the mass-fraction of each element.40
1.4 Transit dose
The transit dose component can be relevant due to the source slowing down near the dwell positions and should be considered, especially for sources with high air-kerma
strengths where transit times are relatively long when compared to dwell times, and for treatments with several dwell positions and catheters where the source spends a significant
amount of time in transit.41
The adopted methodology uses the information extracted from the treatment plan to define the source trajectory creating a continuous source distribution where the sampling probability at each position was weighted by the source speed extracted from the literature.41,42,17, 43
uniformly accelerated movement for the Nucletron afterloader with different accelerations reported |a| = 113 cm/s2 (Ref. 8) and |a| = 78 cm/s2 (Ref. 43); for the Varian afterloader |a| = 55 cm/s2 (Ref. 43), and for the Eckert & Ziegler BEBIG GmbH MultiSource (192Ir HDR) afterloader |a| = 77 cm/s2 (Ref. 42).
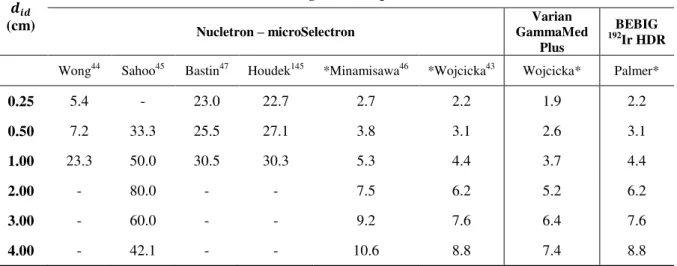
Table 1. Average source speed between dwell positions for various inter-dwell distances
� reported in the literature for afterloaders from Nucletron (microSelectron), Varian
(GammaMed Plus) and for Eckert & Ziegler BEBIG GmbH MultiSource (192Ir HDR).
���
(cm)
Average Source speed (cm/s)
Nucletron – microSelectron
Varian GammaMed
Plus
BEBIG 192Ir HDR
Wong44 Sahoo45 Bastin47 Houdek145 *Minamisawa46 *Wojcicka43 Wojcicka* Palmer*
0.25 5.4 - 23.0 22.7 2.7 2.2 1.9 2.2
0.50 7.2 33.3 25.5 27.1 3.8 3.1 2.6 3.1
1.00 23.3 50.0 30.5 30.3 5.3 4.4 3.7 4.4
2.00 - 80.0 - - 7.5 6.2 5.2 6.2
3.00 - 60.0 - - 9.2 7.6 6.4 7.6
4.00 - 42.1 - - 10.6 8.8 7.4 8.8 *values calculated using the uniform acceleration approach.
Most of the measured results do not agree with the manufacturer’s specifications since
most of the data provided by the manufacturers refers to the source moving from the afterloader to the first dwell position and returning back to it from the last dwell position, which may not represent the source speed between the dwell positions. Nucletron, Varian and BEBIG quote average speeds of 50 cm/s, 60 cm/s and 30 cm/s, respectively.48 Differences in the speed profile can lead to significant differences in the transit dose component, which were evaluated for four clinical cases from three different centers simulated using a general
multipurpose MC code, MCNP5 (Monte Carlo N-Particle Transport code, version 5).49 Two prostate and two gynecological cases were evaluated to provide a general overview.
1.5 Speed Measurements
OBJECTIVES
2 OBJECTIVES
The main objective of this study is to improve the accuracy of brachytherapy treatment planning and contribute to the development of this field. It was divided in specific
objectives according to the five main subjects mentioned above:
To create an auxiliary software to process treatments plans and perform MC simulations;
To evaluate a high fidelity CAD-mesh feature for brachytherapy applicators modelling;
To study dose report quantities, Dw,m and Dm,m, for brachytherapy treatments;
To take into account the transit dose component due to the source movement inside the patient using source speed profiles from the literature;
LITERATURE
REVIEW
3 LITERATURE REVIEW
This section briefly describes the development history of brachytherapy and treatment planning status including the current status. HDR 192Ir treatments and MC methods in brachytherapy are the main subjects of this thesis and are described in more detail.
3.1 Brachytherapy history and current practice
The use of radiation for treatment and diagnosis started shortly following two discoveries. X rays, discovered by Wilhelm Röntgen (1985), and radioactivity discovered by Becquerel (1896). The work of Pierre and Marie Curie (1896) identified new radioactive
elements isolating radioactive samples 900 times more active than ordinary uranium. The potential for medical applications was noticed from the very beginning. Röntgen introduced his hand between an X ray source and a screen covered with fluorescent material that showed a contrast between opaque bone and translucent tissue. Becquerel also experienced and described the effects of radiation on his own skin after carrying a tube with radium in his pocket.13, 52
The first reported medical experience dates from 1901 and has been followed by several studies.53-55 Brachytherapy treatments were performed using 226Ra with first uterine cervix irradiation reported in 1903.54, 56, 57 The first reported cure with a patient alive and well after 8 years was published in 1913.58 Although successfully adopted for some patients, complications were common and results depended on medical experience.57
Brachytherapy has been under continuous development for more than a century since the first treatment. Considerable improvements were made after the discovery of artificial radioactivity in 1934 allowing the production and use of several new radionuclides like 60Co, 137
source incorporated the capability of control dwell positions and dwell times allowing patient specific dose optimization, which still is a relevant scientific topic today.63-65
Technical and scientific improvements reduced the treatment cost, time (for HDR treatments) and protected medical staff from radiation exposure. These reasons contributed to more positive outcome and have led to a continuously increasing number of brachytherapy treatments including cervix, lung, prostate, head and neck and other types of cancer.66 Most of the HDR treatments nowadays are performed using 192Ir sources, although new 69Yb and 60Co are commercially available.67, 68 Two modern HDR 192Ir afterloaders are shown in Figure 2.
3.1.1 Treatment planning and dosimetry
Several methods have been developed to calculate treatment doses. Intracavitary gynecological treatments used radium equivalent dosimetry (mg.Ra.h) as standard for decades.13, 57 Interstitial treatments were performed using few methods; Patterson–Parker dosimetry system (Manchester) defined a uniform dose, within ± 10% of the prescribed dose, over the tumor obtained with higher concentration of source strength in the periphery.69, 70 The Quimby system used a uniform distribution of source strength obtaining a non-uniform dose distribution.69-71 The Paris system was developed for single and double plane implants for which sources must be linear, implants should be parallel, source centers within the same plane and other geometric requirements.70 Application time and treatment data were obtained from tables calculated for standard implants, which could differ from actual patient implants.13 Dose calculation formalisms from 226Ra equivalent dosimetry, point source approximations, Sieverts integration and the current formalism were summarized by Rivard et al.13 and described in detail elsewhere.1, 2, 72, 73 For brevity, only the current approach defined by the APPM TG-43U1 is described here.1, 2
TG-431 was released in 1995 and its update2 in 2004; this formalism is used by commercial TPSs to calculate dose distributions through the superposition of a single dose distribution obtained for one source. The TG-43U1 dose to water formalism requires point
sources or sources with cylindrical symmetry. Therefore, dose rate can be obtained ̇ � with
the general (2D) formalism:
̇ � = . �. �� �,�
�� �0,�0 . � . �, � 1
The polar coordinate system (� and �) was adopted along the source longitudinal axis
with the origin of the coordinate system at the center of the active core. is the air kerma strength ( m.Gy.m2.h-1 (U)) of each source defined as the air kerma rate multiplied by the square of the distance.74 The dose ratio constant, �, is defined as the ratio between dose rate at the reference point ( ̇ � , � ; � = 1 cm and � = 90°) and . The geometry function, �, � , corrects the square-law based on approximate models of the source active core (point and linear sources). The radial function, � , accounts for dose fall-off on the transverse-plane due to photon scattering and attenuation. The anisotropy function, �, � ,
TG-43U1 parameters have been extensively described in the literature for several brachytherapy sources.75-77 The simplistic approach and tabulated parameters allow short calculation times leading to a successful clinical implementation. Although largely employed, the dose to water formalism fails to consider the body dimensions, lack of backscattering, applicator effects and inter-seed attenuation.5, 13
3.1.1.1 TG-43U1 limitations and TG-186
Some of TG-43U1 limitations are well known, however the scientific and technical
challenges to move towards approaches that are more accurate, as MBDCA, are significant. TG-186 describes some of TG-43U1 limitations, the status of scientific development and
areas where efforts are necessary. The recent protocol was released during a period when a commercial MBDCA was available, ACUROSTM.10, 11, 18 Currently, Advanced Calculation Engine (ACE) (Nucletron – an Elekta Company, Veenendaal, the Netherlands),12, 14, 15, 19, 78 is also available. Therefore, issues such as tissue segmentation, CT scanner calibration, dose report quantities, applicator models and other issues related to MBDCA, which can affect brachytherapy treatments, became relevant for the medical staff and can affect brachytherapy treatments.
A discussion about some of TG-186 main subjects is included below. Dose report quantities (Dw,m and Dm,m), widely described in TG-186, are discussed in section 1.3 (Dose specification) as it is one of the main topics of this thesis. Transit dose component (section 1.4 - Transit dose) and mesh geometries (section 1.2 - CAD-Mesh) are discussed in a different section for the same reason.
3.1.1.1.1 Medical images and segmentation
Brachytherapy treatments involved palpation or visualization of the structures with implant reconstruction obtained using orthogonal x rays, which did not allow anatomy based treatment planning. Therefore, treatments were performed using the applicator as reference and not the patient.13, 66, 79 3D image guided implants and post implant dose calculation started with pioneering studies during 80’s and 90’s. The first reported use of a transrectal ultrasound (TRUS) dates from 1983 followed by several studies that consolidated this
Figure 3. a) TRUS image of a prostate patient; b) CT image of a head and neck patient; c)
MRI image of a gynecological patient; d) 3D reconstruction from CT images including the clinical target volume (CTV) in red.
CT images provide information about the atomic number and mass (or electronic) density, which can be employed for tissue segmentation.83 Dual energy CT scanners that acquire images using two different x-ray energy spectra may allow a more accurate extraction of tissue characteristics.84-86 These characteristics are highly important for low energy brachytherapy sources for which photoelectric effect is dominant. Therefore, energy deposition is highly dependent on tissue composition as can be seen by the mass absorption coefficients
either CT and MRI or CT and US for which CT based speed of sound correction, due to different tissues densities, are being evaluated to improve US images.87
Although highly relevant for low energy sources, tissue segmentation may not be necessary for 192Ir energies. Rivard et al.13 discussed which commonly treated anatomic sites (prostate, breast, gynecological, skin, lung, penis and eye) may show significant differences between the actual calculation formalism (TG43-U1 homogeneous water phantom) and more accurate models (MBDCA). None of the evaluated sites are expected to show significant differences, for 192Ir photon spectrum, due to tissue composition or attenuation. Differences are expected only due to shielding (gynecological, skin and eye) or scattering (breast, skin, lung penis and eye) due to interfaces with air.13 Therefore, a homogeneous phantom with image-defined boundaries may provide accurate dose calculations for high-energy brachytherapy sources.
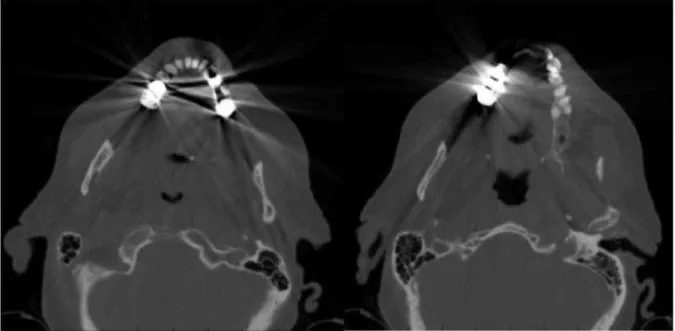
Proper tissue segmentation may not be possible even using CT images since image artifacts may not allow it as shown in Figure 4. Image artifacts that degrade image quality are due to the image reconstruction algorithm88 processing transit images with high atomic number and density and may lead to wrong tissue and density assignment. Several methods have been employed to correct image artifacts, from manual contouring to sophisticated interactive algorithms, filtered images and sinograms.88-91 Currently, efficient and robust methods are not commonly available and the potential of these algorithms to improve dose calculation accuracy needs to be studied (see section 4.4 Dose specification (Dw,m and Dm,m) for more information about material misassignment).5
3.1.2 Brachytherapy applicators and shielding effects
Brachytherapy treatments may employ plastic or metal needles92 and a wide variety of applicators, from single channel cylinders to more complex applicators with several channels and shielding.10, 16, 26, 93 Moreover, some applicators such as balloons used for APBI may assume patient cavity shapes as discussed in section 4.3 (CAD-Mesh) and evaluated by White et al.8 for clinical cases.
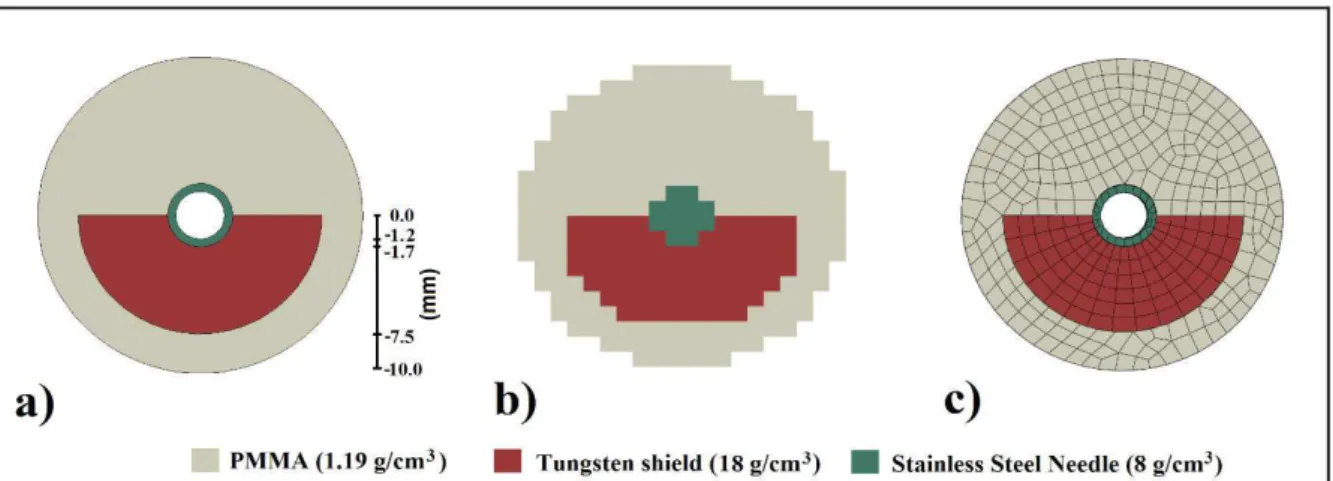
Petrokokkinos et al. evaluated a shielded cylinder applicator (GM11004380 – a similar model was represented in section 4.3.1.4 - Shielded HDR vaginal applicator) with
measurements and simulations using three dose calculation engines: ACUROSTM, a MC code and a commercial TPS (TG-43U1). Results showed differences of up to 90% between
MC and TG-43U1 in the shielded side and up to 10% for clinically relevant points close to the applicator in the unshielded side as scatter reduction due to the partial shield was not taken into account by the TPS (TG-43U1).10 Results obtained using ACUROSTM and MC are almost equivalent except for differences between 2% and 10% in the penumbra of the shield.10
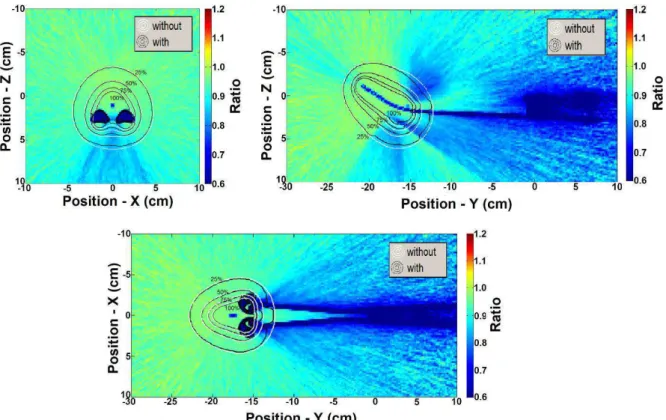
The Fletcher Williamson shielded applicator for HDR 192Ir sources was extensively studied by several groups.18, 23-27 A MG model of this applicator was evaluated in this thesis and described in section 4.3.1.5 (Shielded HDR Fletcher Williamson applicator). This applicator was developed to reduce doses in organs at risk (bladder and rectum). A ratio between dose distributions obtained using a MC with and without the applicator is shown in Figure 5 for illustrative purposes. Results with and without the applicator are almost equivalent in the unshielded region (near the tip) though significant differences are visible in other regions. Applicator effects are considerable and may allow dose escalation as heathy structures can be preserved.
Dosimetric perturbations of a lead shield was studied by Candela-Juan et al. for 60Co, 192
Ir and 169Yb sources used for surface and interstitial HDR brachytherapy. An overdose near the shield, mainly due to backscattered electrons, can reach a factor of 3 at 0.1 mm from the shield for a 192Ir source. Tissues can be preserved by adding 3 mm and 1 mm of bolus around the shield for 60Co and 192Ir, respectively.
Figure 5. Ratio between dose distributions obtained with MC with and without including the Fletcher Williamson applicator. The dark blue region represents the applicator.
3.2 MC methods in brachytherapy
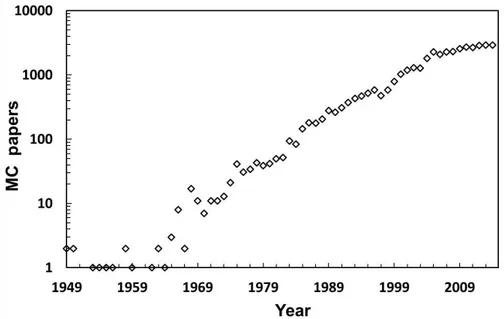
MC method is widely employed in several fields as astronomy, meteorology, traffic prediction and medical physics. In medical physics MC has been employed to simulate linear accelerators,94 patients,95 brachytherapy sources,76 energy dependence of dosimeters,96 neutron stimulated emission computed tomography,97 to calculate ion chamber correction factors due to wall attenuation and scatter98-100, and for several other applications. Rogers published a review about MC simulations for medical physics.101 He searched for the term
‘Monte Carlo’ on PubMed† getting 14452 hits as of January 2006 whilst the same search
performed 9 years later (January 2015) showed 38901 hits. The number of papers per year
including the term ‘Monte Carlo’ is shown in Figure 6. The increase use of MC codes is related to the increase in computing power that allows shorter simulation times.
Several MC codes are available comprising a wide variety of applications. MCNP was originally developed to transport neutrons and photons. Currently, MCNP can transport several particles as photons, neutrons, electrons, protons, heavy ions and others.22, 49
PENELOPE (Penetration and ENErgy Loss of Positrons and Electrons)102 transports electrons, positrons and photons. GEANT4 (GEometry ANd Tracking) transports a wide variety of particles and is the basis of GATE (Geant4 Application for Tomographic Emission).28, 103 EGS (Electron Gamma Shower) is a photon-electron coupled code considered the most used general purpose MC code in medical physics.101 Recent data about MC codes usage were not found. However, a refined search within papers with the term
‘Monte Carlo’ shows 637 papers with at least one of the expressions ‘MCNP’, ‘MCNP4’,
‘MCNP5’ or ‘MCNP6’; 643 with at least one of the terms ‘GEANT’, ‘GEANT4’, ‘G4’ or
‘GATE’; 218 papers with the term ‘PENELOPE’; 809 papers with at least one of the terms
‘EGS’, ‘EGSnrc’, ‘EGS3’, ‘EGS4’, or ‘BrachyDose’. Results indicated that EGS, and its versions, is still the most used code. However, other codes are almost equally used.
Figure 6. Number of papers per year including the term ‘Monte Carlo’. Results of a PubMed search (20 January 2015).
MC plays a key role in brachytherapy for clinical practice and research. The first computational efforts to obtain dose distributions around brachytherapy sources date from the 60’s, with 3D models used as early as 1971.7, 104, 105 Landry et al. summarized some results obtained during the 90’s comparing MC dose distributions against experimental data using thermoluminescent dosimeters (TLD) and diodes.7 Agreement within 5% for 125I and 3% for 192
brachytherapy. Moreover, experimental measurements are complex due to the sharp dose gradient in the brachytherapy energy range. However, MC should not be trusted blindly as pointed out by Williamson et al.108
MC code is a gold standard MBDCA whose importance goes beyond source models as patient specific dose calculations can be performed. Despite its well-known accuracy, MC has not been implemented in clinical practice due to its calculation time.112 Significant computational requirements are inherent of a stochastic method for radiation transport that must simulate a large number of particles to produce statistically relevant results. This may no longer be a problem due to the computational power available nowadays.112 Currently, the simulation time necessary to obtain an average dose uncertainty of 2% for an intracavitary
case with 6.6x10⁶ voxels is 27 min using an Intel Xeon X5650 processor with twelve cores of 2.67GHz and 32 Gb of RAM. This is reduced to 5 min on a SGI C2112 server (Silicon Graphics International Corporation, Chippewa Falls, USA) consisting of 16 processors with eight cores of 2.4 GHz each.6 Landry et al. obtained calculation time about 6 and 12 min for 2% uncertainty for a breast and a prostate implant, respectively.7 Literature reported MC results obtained within seconds for low-energy sources and few minutes for 192Ir.112 Such simulation times may be suitable for a future clinical implementation.
MATERIALS
AND METHODS
4 MATERIALS AND METHODS
4.1 Monte Carlo codes
This section includes general information about the MC codes used in this thesis whilst specific simulation parameters were described in each section.
4.1.1 MCNP
MCNP version 5 and 6 were used in this thesis since only version 5 was available by the time some results were obtained. No differences were observed between the versions, except for MCNP6 new features as CAD-Mesh. MCNP is a multipurpose radiation MC
transport code22, 113 widely employed in medical physics,8, 93 which can involve high-resolution voxel phantoms. Therefore, MC codes must handle a large amount of data requiring a large RAM memory and long CPU times. To increase simulation efficiency the Harvard/MIT Boron Neutron Capture Therapy clinical trials team developed lattice speed tally enhancement (LSTE) for simulations with large number of voxels.29
The LSTE function can be employed under specific situations such as: a) a hexagonal lattice must be present in the geometry; b) all F4 (MCNP6 tally) tallies contain a hexahedral lattice; c) all F4 tallies have associated DE/DF cards; d) nested lattices are scored together. However, this function is not compatible with all tallies. Simulations with F4 tallies can be faster by a factor of 100 or more than simulations with F6 (MCNP6 tally) tallies since LSTE does not work for F6 tallies even though both tallies are track length based estimators. When the SPDTL card is active, tracking is more efficient since it considers only lattice geometries enclosed in a parallelepiped, removes general surface checks, removes extraneous energy bins and tally modifiers. LSTE retains only the tally multipliers (DE/DF cards) necessary to convert average photon energy fluence to kerma29.
4.1.1.1 MCNP6 mesh capability
The capability of handling mesh geometries was recently included in the MCNP6 beta 2 release, which can handle first and second order tetrahedral, pentahedral and hexahedral elements defined through text files directly generated by two commercial programs, AbaqusTM (Dessault Systèmes, France) and ATTILA (Transpire Inc., Gig Harbor, WA) or by converting the volume elements generated by other programs, such as ENGRID or GMSH.116 We opted for tetrahedral meshes defined using the .ele/.node files used for Geant4 simulations converted to the MCNP6 format.117
4.1.1.2 Track length estimator tallies
Track length estimator tallies can be used under CPE conditions, which is achieved for the 192Ir spectrum for distances greater than 2 mm from the source.118, 119 Under CPE conditions dose values are approximate by collision kerma (and even kerma in low atomic number materials where bremsstrahlung is negligible) and can be obtained by multiplying the
energy fluence (E.ФE) by µen/ as described in equation 2. Fluence values were scored for N energy bins (i) with 1 keV resolution using MCNP6. This methodology is efficient since the number of tracks crossing a voxel is much higher than the number of interactions in it and leads to accurate results within the brachytherapy energy range for mm-sized voxels.8, 76, 120 This approach is followed in the first MC simulation (track length) mentioned above.
≈ ∑ [Ф�� � . �.
µ��
� � � ]
�
�= 2
4.1.1.3 Pulse height tallies
small scoring volumes and near material interfaces (see section 4.4 - Dose specification (Dw,m and Dm,m) for more information).13, 34 Dm,m values including effects of electron transport were obtained simulating the whole CT geometry. However, dose values were scored only for one sagittal slice to reduce the simulation time since it increases with the number of scoring volumes, which can make simulations impractical.
4.1.2 Geant4
The MC toolkit Geant4.9.5.p02 was used in this thesis, using the G4EmLivermorePhysics class for low energy electromagnetic physics and the layered mass geometry method.124 The code was used to validate MCNP6 calculations with mesh geometries (section 4.3 - CAD-Mesh). A voxel grid was used to represent the patient geometry derived from CT imaging and a parallel world contains the model of a brachytherapy source and applicator. In locations where voxels and applicator model overlapped, photons were transported in the latter.
To perform MG modelling we installed the Geant4 library CADMesh version 0.6.2 (Ref. 125) which enables the import of tessellated surfaces or volumes. It has been reported126 that the use of tessellated surfaces based on the G4TessellatedSolid class requires longer simulation times than tessellated volumes based on an assembly of G4Tet (Geant4 class for modelling tetrahedra). This was confirmed in our work; therefore the latter approach was used. Several file formats are supported by CADMesh; An .ele and .node description of volume meshes composed of a collection of tetrahedrons was adopted.‡ The .node file contains a list of vertices which are grouped in the .ele file to describe volume elements. Volumes represented by a collection of tetrahedrons will be referred as MG. Upon import via CADMesh in Geant4 the .ele/.node tetrahedral mesh yields a G4Assembly volume (a class allowing to group a number of volumes such as G4Tet) to which a position in the parallel world and a material can be assigned.126
4.2 AMIGOBrachy
AMIGOBrachy has been developed using MATLAB version 8.0 with the aim of providing tools such as: a) medical image processing, b) dwell position identification, c) needle detection, d) phantom creation using DICOM images, e) MCNP6 code input file
creation and f) dose analyses. All functionality of AMIGOBrachy is achieved through a
user-friendly interface. The software is compatible with the TPS Oncentra™ (Nucletron, an Elekta
company, Stockholm, Sweden) and BrachyVision™ (Varian Medical Systems, Inc., Palo Alto, CA) offering the capability to import treatment plans created on both TPS and perform simulations using the MCNP6 code. Currently, CT and MRI images can be imported, but automatic segmentation and density calibration curves are not available for MRI images, which should be segmented using contours or thresholds defined by the user. Figure 7 shows a diagram of the main functionalities of the software describing the entire process.
Figure 7. Flowchart with AMIGOBrachy’s main functionalities, which are described in the user-guide. The process starts with importing or creating a DICOM sequence of images, followed by defining the simulation parameters and initiating MCNP6, and finishes by importing and analyzing the simulated dose distributions.
MCNP6 can generate photon energy distributions in all voxels, which can be used for energy response correction of radiation detectors.127 This also allows studying the effect of non-water heterogeneities on the photon spectrum. This capability was built into the current implementation of AMIGOBrachy.
AMIGOBrachy can import the trajectory of the source and simulate the source movement using source speed profiles defined by the user. The methodology to derive transit dose component17 for brachytherapy treatments was described in section 4.5 (Transit dose).
4.2.1 Brachytherapy applicators
Commercial or in-house made brachytherapy applicators have a wide range of geometries and compositions. Some applicators may affect the dose distribution significantly due to the geometry and the material used. AMIGOBrachy can handle applicators in three different ways:
a) using a database of applicators defined through an analytical geometry (Figure 8.a) combined with voxel phantoms. In this first version two plastic applicators and one metal needle are available;
b) converting applicator contours to voxels (Figure 8.b);
c) using mesh geometries (Figure 8.c) created by CAD/CAE (Computer Aided Design and Computer Aided Engineering) to perform simulations using MCNP6.117
The applicator’s position can be obtained from DICOM file headers, when available, or defined by the user through two or more points depending on the applicator geometry. Moreover, applicators can consist of one or more small and/or thin structures, which cannot be accurately represented by regular voxels (i.e. the hollow needle in Figure 8.b).
4.2.2 Validation
Dose distributions obtained with AMIGOBrachy/MCNP6 were compared against dose distributions exported from BrachyVisionTM version 10.0 employing a Linear Boltzmann Transport Equation (LBTE) solver, ACUROSTM, which can handle non-water heterogeneities.10, 11, 18, 128
4.2.3 Uniform phantoms
The validation process involved several steps going from source parameter validation up to clinical case comparisons against a commercial TPS. AMIGOBrachy currently models two HDR 192Ir sources; microSelectron77 (Nucletron), and GammaMed Plus76 (Varian), and an electronic brachytherapy X-ray source (Axxent; Xoft, San Jose, CA).120 The sources were validated by comparing TG43-U11, 2 parameters such as anisotropy function, radial function and air kerma strength against values from the literature (data not show). Dwell times and dwell positions were validated by comparing the MC input generated with AMIGOBrachy against DICOM header information and reports from TPS.
Material compositions and dose grid effects were verified by comparing dose distributions obtained with a DICOM object of 200x200x200 voxels, with a 1 mm resolution, consisting of a cubic phantom (10x10x10 cm3) positioned in the middle of the image and surrounded by air was created for validation purposes. Simulations were performed for 9 dwell positions within homogeneous phantoms consisting of all tissues available in the ACUROSTM library (lung, adipose tissue, water, muscle, cartilage and bone)129 using dose scoring grids of 1 mm slice thickness and a width/height of 0.50, 1, 2.50 and 5.0 mm.
4.2.4 Clinical cases
user guide. The dose grid resolution was the same as the image resolution used in each case, while the dose grid sizes (i.e. the number of voxels) were defined interactively considering the ACUROSTM memory requirements. The distance between the isodoses and the dose values per voxel were compared.
The treatment plans were then imported in AMIGOBrachy to generate MCNP6 input files by reproducing the TPS configuration. This includes tissue contours, materials, dwell positions, applicator, dose grid and voxel size. Dose calculations were reported as Dw,w (as adopted by TG-43U1) and Dw,m, with the type A (k=1) simulation uncertainty component less than 1% within the region covered by the 30% isodose.
A sequence of images illustrating the steps necessary to perform a simulation using a treatment plan imported by AMIGOBrachy is shown in Figure 9.
Figure 9. A sequence of images used by AMIGOBrachy: a) importing the DICOM patient CT image; b) defining structures by importing DICOM contours (e.g. the highlighted bone contours); c) defining the material map (using HU numbers or drawing tools), which consists of air (black region), adipose tissue (blue region), muscle (green region) and bone (yellow region); d) defining the voxel phantom region (external rectangle) and the dose scoring region (internal rectangle).
4.2.4.1 Intracavitary case
The treatment plan for an intracavitary gynecological case was made with a DICOM