Reference equations for the performance
of healthy adults on field walking tests*
,**
Equações de referência para os testes de caminhada de campo em adultos saudáveis
Victor Zuniga Dourado, Milena Carlos Vidotto, Ricardo Luís Fernandes Guerra
Abstract
Objective: To develop regression equations for predicting six-minute and incremental shuttle walk distances (6MWD and ISWD, respectively), based on demographic characteristics, anthropometric variables, and grip strength. Methods: We evaluated 6MWD and ISWD in 98 healthy adults. Height, weight, and grip strength were also assessed. Using data from 90 of the participants (40 males; 60 ± 9 years of age), we devised linear equations adjusted for age, gender, height, and weight, and we developed alternate models that included grip strength. We prospectively applied the equations in the 8 remaining participants (4 males; 59 ± 10 years), who had been randomly separated from the initial sample. Results: Age, gender, height, and weight collectively explained 54.5% and 64.9% of the variance in 6MWD and ISWD, respectively, whereas age, height, weight, and grip strength collectively explained 54.4% and 69.0% of the respective variances. There was no significant difference between the measured and predicted 6MWD using equations with and without grip strength (14 ± 57 vs. 13 ± 67 m). Similar results were observed for ISWD (25 ± 104 vs. 25 ± 93 m). Conclusions: Grip strength is a determinant of ISWD and 6MWD; however, it could not improve the power of equations adjusted by demographic and anthropometric variables. The validity of our models including grip strength should be further evaluated in patients with skeletal muscle dysfunction.
Keywords: Walking; Exercise; Reference Values; Exercise test.
Resumo
Objetivo: Desenvolver equações de regressão para a previsão das distâncias caminhadas nos testes de caminhada de seis minutos e incremental shuttle walk test (DTC6 e ISWD) baseadas em atributos demográficos, antropométricos e força de preensão manual. Métodos: Avaliamos a DTC6 e ISWD em 98 adultos saudáveis. Estatura, peso e força de preensão manual foram também avaliados. Equações ajustadas para idade, gênero, estatura e peso e equações, incluindo também a força de preensão manual, foram desenvolvidas dos dados de 90 participantes (40 homens; 60 ± 9 anos). Aplicamos prospectivamente as equações em 8 participantes (4 homens; 59 ± 10 anos) randomicamente selecionados da amostra inicial. Resultados: Idade, gênero, altura e peso explicaram coletivamente 54,5% e 64,9% da variância da DTC6 e ISWD, respectivamente, ao passo que idade, altura, peso e força de preensão manual explicaram coletivamente 54,4% e 69.0% da variância da DTC6 e ISWD, respectivamente. A diferença entre a DTC6 prospectivamente avaliada e prevista não foi significativa usando equações com e sem força de preensão manual (14 ± 57 m vs. 13 ± 67 m). Resultados semelhantes foram observados para a ISWD (25 ± 104 m vs. 25 ± 93 m). Conclusões: A força de preensão manual é um determinante para DTC6 e ISWD; entretanto, não foi capaz de aumentar o poder das equações ajustadas por variáveis demográficas e antropométricas. A validade de nossos modelos incluindo a força de preensão manual deve ser avaliada em pacientes com disfunção muscular esquelética. Descritores: Caminhada; Exercício; Valores de referência; Teste de esforço.
* Study carried out at the Universidade Federal de São Paulo – UNIFESP, Federal University of São Paulo – Baixada Santista Campus, Santos, Brazil.
Correspondence to: Victor Zuniga Dourado. Departamento de Ciências da Saúde, Avenida Ana Costa, 95, CEP 11060-001, Santos, SP, Brasil.
Tel./Fax: 55 13 3878-3763. E-mail: vzdourado@yahoo.com.br or victor.dourado@unifesp.br
Financial support: This study received financial support in the form of a grant from the Fundação de Amparo à Pesquisa do Estado de São Paulo (FAPESP, São Paulo Research Foundation; Grant no. 2007/08673-3).
Submitted: 26 April 2011. Accepted, after review: 19 July 2011.
36.6% of the 6MWD variance. Jürgensen et al.
(10) evaluated ISWD in 131 Brazilian individuals.
Using a predictive model, the authors showed that age, height, weight, and gender collectively explained 50.3% of the ISWD variance. In a recent multicenter study, the predictive equations varied widely across centers (adjusted R2 = 0.09-0.73) and explained < 30% of the
6MWD variance at four of the centers evaluated.
(11)
The assessment of grip strength (GS) has broad clinical applicability, because it is a low-cost, simple, rapid, and noninvasive method,(12,13) providing an indicator of general
health and overall muscle function.(12) Various
authors have found GC to correlate significantly and positively with 6MWD and ISWD, especially in patients with COPD.(7,14-16) In healthy elderly
individuals, GS has been identified as a determinant of 6MWD.(7)
The use of faulty reference equations can result in mistakes related to the interpretation of the level of physical fitness and the improvement in walking distance after interventions in patients with chronic diseases. Therefore, the purpose of this study was to develop regression equations for predicting the 6MWD and ISWD, based on demographic characteristics, anthropometric variables, and GS. We also attempted to determine whether GS correlates with ISWD and 6MWD.
Methods
We evaluated 98 healthy subjects—all over 40 years of age—some recruited from among employees of the Federal University of São Paulo, located in the city of Santos, Brazil, and others recruited from among residents of the surrounding community, through newspaper advertisements. Subjects completed a questionnaire regarding physical activity, and those determined to engage in such activity for less than 30 min/day were classified as sedentary.
(17) On the basis of their BMI, the subjects
were stratified into the following categories: underweight (< 18.5 kg/m2); normal weight
(18.5-24.9 kg/m2); overweight (25-29.9 kg/m2);
and obese (≥ 30 kg/m2). All of the subjects selected
for study were healthy and ambulatory (having no cardiorespiratory, metabolic, neuromuscular, or musculoskeletal disease and requiring no walking aids). Subjects with abnormal
post-Introduction
Walking tests, such as the six-minute walk test (6MWT) and incremental shuttle walk test (ISWT),(1,2) are economically accessible and offer
the advantage of operational simplicity. These tests are well established and have become widely used measures of exercise capacity in patients with any of a number of chronic diseases.
The 6MWT, which is of a fixed duration, is influenced by external factors, such as motivation and the amount of effort expended. Therefore, the instructions and level of encouragement given should be carefully standardized.(1) On the
6MWT, the pace is determined by the subject, and the distance covered therefore varies widely, even among healthy individuals.(3-6) However,
on the ISWT, there is a controlled, progressive increase in pace every 60 s.(2) Both tests are safe
when preformed appropriately and have been used, with no adverse effects, in thousands of patients with heart or lung disease.(1)
Various demographic, anthropometric, and physiological factors can influence the total distance covered on field walking tests, such as the six-minute walk distance (6MWD) and the incremental shuttle walk distance (ISWD). Shorter individuals and women have shorter strides and consequently cover less distance. Elderly and obese individuals often have low lean body mass and therefore also cover shorter distances. The 6MWD has been reported to be below average in unmotivated individuals, those with cognitive deficits, and those with arthritis or other musculoskeletal disorders.(3,7) Other factors
that can influence the 6MWD include symptoms of depression, impaired health-related quality of life, medication use, systemic inflammation, and impaired pulmonary function.(7)
To our knowledge, only three studies have formulated reference equations to predict the 6MWD and ISWD in Brazilian individuals.(8-10)
Iwama et al.,(9) who evaluated 6MWDs in 134
healthy Brazilians (73 women) ≥ 13 years of age,
found that age and gender collectively explained 30.0% of the variance in 6MWD. Priesnitz et al.(8)
protocol consists of 12 stages (total distance, 1,020 m). However, because we were applying the test in healthy subjects, we extended it to 15 stages (1,500 m), in order to avoid the ceiling effect.
The dominant hand was defined as that favored in carrying out daily activities. The participants were asked about hand preference for activities such as writing, eating, and carrying objects. We assessed the GS of the dominant hand with a Jamar dynamometer (TEC, Clifton, NJ, USA), using the method described by Mathiowetz et al.(12) Subjects were
seated with one arm raised parallel to the trunk, shoulder in neutral rotation, elbow flexed 90°, and forearm in a neutral position. During the test, we allowed hyperextension of the wrist up to 30° and ulnar deviation up to 15°. We took three measurements, 30 s apart. The greatest of the three measurements was used in the data analysis.
The statistical analysis was performed with the Statistical Package for the Social Sciences, version 12 (SPSS Inc., Chicago, IL, USA). Data are presented as mean and standard deviation or as median and interquartile range. We employed the Kolmogorov-Smirnov test to evaluate normality of data distribution, Pearson’s or Spearman’s correlation coefficient to study correlations between variables, and unpaired t-test to determine intergroup differences in numerical data. We also used stepwise multiple linear regression analysis to identify the dependent variables that were the best predictors of 6MWD and ISWD. Age, gender, height, and weight were included in the regression models. Alternate models were constructed to include GS. Gender interaction terms were included for age, height, weight, and GS. Correlations between ISWD and GS and between 6MWD and GS were determined using the z statistic (MedCalc™, version 11.1.1; MedCalc Software, Mariakerke, Belgium). Sample size was estimated on the basis of the number of variables to be entered into the multiple regression analysis and the minimum number of observations required. The minimum sample size was calculated to be at least 50 subjects. Multicollinearity in the models was avoided by excluding variables with variance inflation factors > 4. We evaluated the measured 6MWD and ISWD in comparison with the predicted bronchodilator lung function were excluded,(18)
as were those classified as obese. We randomly selected 8 individuals—one man and one woman from the 40-49, 50-59, 60-69, and ≥ 70 year age
brackets, respectively—to serve as test subjects, and we developed reference equations based on data related to the remaining 90 participants. To verify the reliability of our reference equations, we applied them in the 8 test subjects. The study design was approved by the Human Research Ethics Committee of the Federal University of São Paulo, and all subjects gave written informed consent.
Weight and height were measured by standard techniques, with the subjects wearing light clothing and no shoes. Weight was measured to the nearest 0.1 kg with a calibrated scale, and height was determined to the nearest 0.5 cm with a stadiometer. The BMI was calculated as weight in kilograms divided by height in meters squared (kg/m2). Pulmonary function and bronchodilator
reversibility tests were performed using a hand-held spirometer (Spiropalm; COSMED, Rome, Italy), in accordance with American Thoracic Society criteria.(18)
The 6MWT and ISWT were each administered twice, on alternate days. Before and after each test, we assessed HR, blood pressure, breathlessness, and leg fatigue. To minimize the learning effect, we allowed an interval of at least 30 min between tests.(1,19) The 6MWT was carried
out in accordance with American Thoracic Society recommendations.(1) The test consisted
of walking unaided, as fast as possible, for 6 min in a corridor 27-30 m in length. Every 60 s, raters provided standardized verbal encouragement, as follows: “You’re doing well” and “Keep up the good work”. The ISWT was carried out with the method described by Singh et al.(2) The
The validation sample comprised the 8 test subjects (means: age, 59 ± 10 years; height, 1.65 ± 0.08 m; weight, 74 ± 12 kg; and BMI, 27 ± 4 kg/m2). For those 8 subjects, the mean
6MWD was 588 ± 71 m, corresponding to 102 ± 9% and 102 ± 11% of the predicted values calculated with equations including and excluding GS, respectively. The difference between the measured and predicted 6MWD values was not significant, with or without GS (13 ± 67 m and 14 ± 57 m, respectively; p > 0.05). The mean ISWD was 515 ± 150 m, corresponding to 105 ± 15% and 105 ± 18% of the predicted values calculated by the equations with and without GS, respectively. The difference between the measured and predicted ISWD distances derived from our equations. The level
of statistical significance was set at 5%.
Results
The characteristics of the 90 subjects (40 males) are summarized in Table 1. All of the subjects had normal lung function. The age distribution of our sample was as follows: 40-49 years (n = 20); 50-59 years (n = 21); 60-69 years (n = 26); and ≥ 70 years (n = 23). Mean BMI
was within the overweight range (28 ± 3 kg/ m2). Approximately 52% of the subjects were
classified as sedentary. The GS, 6MWD, and ISWD values were greater in males than in females (43 ± 7 vs. 28 ± 5 kg, 641 ± 63 vs. 540 ± 72 m, and 600 ± 91 vs. 417 ± 103 m, respectively; p < 0.001 for all).
The univariate analysis showed that 6MWD correlated significantly with age (r =
−0.35), height (r = 0.58), BMI (r = −0.47),
and GS (Figure 1a), whereas ISWD correlated significantly with age, height, and BMI (r =
−0.36, r = 0.66, and r = −0.48, respectively;
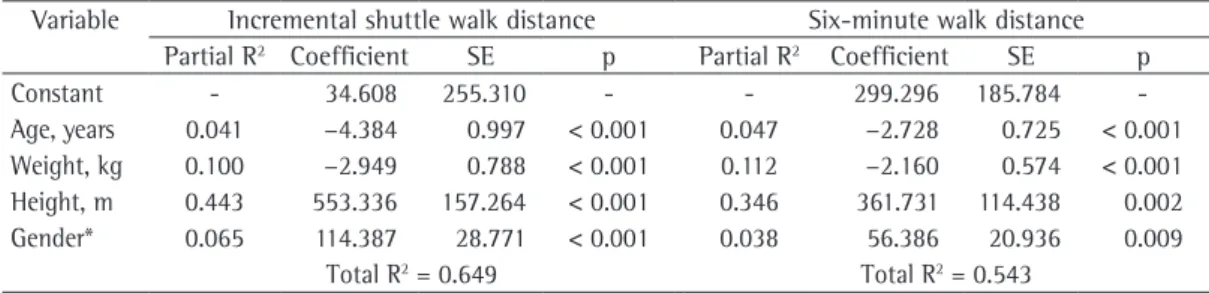
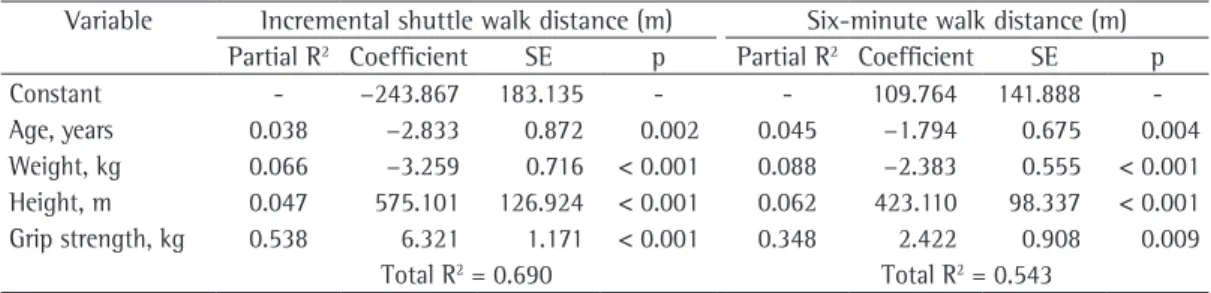
p < 0.05 for all), as well as with GS (Figure 1b). The correlation coefficient for ISWD and GS was significant higher than that obtained for 6MWD and GS (z statistic = 2.05; p = 0.03). Age, gender, height, and weight collectively explained 54.5% and 64.9% of the variance in 6MWD and ISWD, respectively (Table 2). In the alternate models, age, height, weight, and GS collectively explained 54.4% and 69% of the variance in 6MWD and ISWD, respectively (Table 3). No interactions with gender were detected.
Table 1 - General characteristics of the subjects. Characteristic Mean ± SD
(n = 90)
Age, years 60 ± 9
Weight, kg 69 ± 12
Height, m 1.60 ± 0.09
BMI, kg/m2 26 ± 4
FEV1, %pred 111 ± 13
FVC, %pred 109 ± 11
FEV1/FVC, % 85 ± 6
GS, kg 33 ± 9
1st 6MWD, m 567 ± 75
2nd 6MWD, m 572 ± 83
1st ISWD, m 451 ± 133
2nd ISWD, m 474 ± 131
BMI: body mass index; GS: grip strength; 6MWD: six-minute walk distance; ISWD: incremental shuttle walk distance.
Table 2 - Predictive model for incremental shuttle and six-minute walk distances in healthy subjects, using demographic and anthropometric attributes.
Variable Incremental shuttle walk distance Six-minute walk distance Partial R2 Coefficient SE p Partial R2 Coefficient SE p
Constant - 34.608 255.310 - - 299.296 185.784
-Age, years 0.041 −4.384 0.997 < 0.001 0.047 −2.728 0.725 < 0.001 Weight, kg 0.100 −2.949 0.788 < 0.001 0.112 −2.160 0.574 < 0.001 Height, m 0.443 553.336 157.264 < 0.001 0.346 361.731 114.438 0.002 Gender* 0.065 114.387 28.771 < 0.001 0.038 56.386 20.936 0.009
Total R2 = 0.649 Total R2 = 0.543
*Factor gender: men = 1; women = 0. Reference equations employed in this model:
Incremental shuttle walk distance = 34.608 − (4.384 vs. age) − (2.949 vs. weight) + (553.336 vs. height) + (114.387 vs.
gender); standard error of the estimate = 79.4 m
Six-minute walk distance = 299.296 − (2.728 vs. age) − (2.160 vs. weight) + (361.731 vs. height) + (56.386 vs. gender);
muscle mass, and height than do women. The negative influence of advanced age on ISWD might be explained by the gradual reduction in muscle mass, muscle strength, and maximal oxygen uptake that typically occurs in parallel with aging.(20) Height has a strong influence,
which might be attributable to the greater stride length in taller individuals, stride length being a major predictor of gait speed.(21) However,
findings related to the question of whether body weight correlates with 6MWD and ISWD have been inconsistent across studies.(5-7) Nevertheless,
it is likely that, because of its curvilinear nature, this correlation has defied detection in linear regressions.(7,10,22)
In the present study, the inclusion of GS did not improve the power of commonly used reference equations based on anthropometric and demographic attributes. This could be attributed to the great influence that age, weight, height, and gender has on GS. However, it is possible that the equations including GS would be more appropriate for the evaluation of patients with muscle depletion. In such cases, muscle strength would be considered, and the predicted performance on the 6MWT and ISWT might more accurately represent the functional capacity of the patients. Further studies are needed in order to assess the validity of these equations in patients who are more debilitated and have skeletal muscle dysfunction, such as those with lung diseases, especially COPD, cystic fibrosis, and bronchiectasis, in which there is typically pronounced muscle loss.
We found that GS correlated strongly with ISWD and 6MWD, more so with ISWD. Studies that have evaluated the validity of these walking tests in patients with chronic disease have found GS to be significantly correlated with 6MWD and ISWD.(14,16) Similar results have been
described in healthy individuals.(4,7) The fact that
muscle strength and body weight had a greater influence on the ISWD than on the 6MWD might be attributable to the incremental nature of the ISWT, in which the pace is progressively increased at each stage. It is likely that individuals walk with intensity above the lactate threshold during a large portion of the test, which results in greater recruitment of glycolytic muscle fibers.(23) One study assessed the ventilatory and
HR variability thresholds in healthy subjects performing the ISWT and recognized indices values was also not significant, with or without
GS (25 ± 93 m and 25 ± 104 m, respectively; p > 0.05).
Discussion
To our knowledge, the present study is the first to develop GS-based reference equations for predicting ISWD and 6MWD in healthy, fully ambulatory subjects. We found that GS played an important role in predicting 6MWD and ISWD in healthy older adults, explaining large proportions of the total variances in these variables. Although GS correlated strongly with 6MWD and ISWD, it correlated more significantly with ISWD.
In our study, age, gender, weight, and height were identified as independent predictors of ISWD and 6MWD. These results are quite similar to those previously described for older Brazilians adults.(9,10) The influence of gender on walking
distance might be attributable to the fact that men have greater absolute muscle strength,
recognized as a determinant of cardiorespiratory fitness, should be taken into account.
Our results have clinical implications. Traditionally, GS has been used in evaluating the physical condition of the upper limbs. However, more recently, GS has been assessed in various clinical situations. For example, Ling et al.
(27) showed that GS was a major predictor of
all-cause mortality in adults > 85 years of age. Al Snih et al.(28) followed a population-based
sample of 2,488 noninstitutionalized men and women ≥ 65 years of age, 507 of whom died
within the first five years of the study. The authors found that GS was strongly correlated with mortality. Poorer performance on the timed walk test, as well as diabetes mellitus, hypertension, and cancer, were also found to be significant negative predictors of five-year survival. Previous studies have demonstrated a significant positive correlation between GS and body cell mass.
(29) Taekema et al.(30) found that lower GS was
correlated with poorer scores for functional, psychological, and social health domains. The authors also showed that lower baseline GS was predictive of an accelerated decline in cognition and in the ability to perform activities of daily living. Therefore, the determination of GS could be useful for identifying elderly patients at risk for such a decline. As an index of general health and muscle strength, GS shows promise. Given the low cost of dynamometry, it is reasonable to include this variable in regression models designed to predict the distance covered on walking tests.
The main limitation of the present study was the use of a convenience sample, which might of transition between moderate and intense
exercise.(24) However, on the 6MWT, the pace
is controlled by the subject and an aerobic steady state is achieved.(25) This suggests that
the exercise intensity is at or below the lactate threshold in most cases, which results in a lower demand for glycolytic muscle fiber recruitment.
(23) In agreement with this, Pelegrino et al.(26)
found the 6MWD to be similar in COPD patients with and without lean body mass depletion, indicating that skeletal muscle has a limited influence on 6MWD. However, during the test, the patients with such depletion presented significantly greater HR and sensation of leg fatigue. Therefore, muscle mass and muscle function both seem to have a more consistent influence on ISWD than on 6MWD.
Various chronic diseases have systemic manifestations. One major manifestation of such diseases is peripheral skeletal muscle dysfunction. Although reductions in muscle mass and strength occur in parallel, the correlation between these variables is not linear. Therefore, muscle depletion can occur even in patients with normal body mass and BMI. For example, patients of the same gender with the same anthropometric characteristics would be expected to cover the same distance on field walking tests, after adjustment for anthropometric and demographic attributes, based on reference equations. However, peripheral muscle strength (i.e., the degree of muscle depletion) can differ significantly between individuals. To predict performance on walking tests, muscle strength, widely
Table 3 - Predictive model for the incremental shuttle and six-minute walk distances in healthy subjects using demographic and anthropometric attributes and grip strength.
Variable Incremental shuttle walk distance (m) Six-minute walk distance (m) Partial R2 Coefficient SE p Partial R2 Coefficient SE p
Constant - −243.867 183.135 - - 109.764 141.888
-Age, years 0.038 −2.833 0.872 0.002 0.045 −1.794 0.675 0.004
Weight, kg 0.066 −3.259 0.716 < 0.001 0.088 −2.383 0.555 < 0.001 Height, m 0.047 575.101 126.924 < 0.001 0.062 423.110 98.337 < 0.001 Grip strength, kg 0.538 6.321 1.171 < 0.001 0.348 2.422 0.908 0.009
Total R2 = 0.690 Total R2 = 0.543
*Factor grip strength: men = 1; women = 0. Reference equations employed in this model:
Incremental shuttle walk distance = −243.867 − (2.833 vs. age) − (3.259 vs. weight) + (575.101 vs. height) + (6.321 vs.
grip strength); standard error of the estimate = 74.6 m
Six-minute walk distance = 109.764 − (1.794 vs. age) − (2.383 vs. weight) + (423.110 vs. height) + (2.422 vs. grip strength);
9. Iwama AM, Andrade GN, Shima P, Tanni SE, Godoy I, Dourado VZ. The six-minute walk test and body weight-walk distance product in healthy Brazilian subjects. Braz J Med Biol Res. 2009;42(11):1080-5.
10. Jürgensen SP, Antunes LC, Tanni SE, Banov MC, Lucheta PA, Bucceroni AF, et al. The incremental shuttle walk test in older Brazilian adults. Respiration. 2011;81(3):223-8.
11. Casanova C, Celli BR, Barria P, Casas A, Cote C, de Torres JP, et al. The 6-min walk distance in healthy subjects: reference standards from seven countries. Eur Respir J. 2011;37(1):150-6.
12. Mathiowetz V, Kashman N, Volland G, Weber K, Dowe M, Rogers S. Grip and pinch strength: normative data for adults. Arch Phys Med Rehabil. 1985;66(2):69-74. 13. Caporrino FA, Faloppa F, Santos JB, Réssio C, Soares
FH, Nakachima LR, et al. Estudo populacional da força de preensão palmar com dinamômetro Jamar. Rev Bras Ortop. 1998;33(2):150-4.
14. Dourado VZ, Antunes LC, Tanni SE, de Paiva SA, Padovani CR, Godoy I. Relationship of upper-limb and thoracic muscle strength to 6-min walk distance in COPD patients. Chest. 2006;129(3):551-7.
15. Gosselink R, Troosters T, Decramer M. Peripheral muscle weakness contributes to exercise limitation in COPD. Am J Respir Crit Care Med. 1996;153(3):976-80.
16. Steiner MC, Singh SJ, Morgan MD. The contribution of peripheral muscle function to shuttle walking performance in patients with chronic obstructive pulmonary disease. J Cardiopulm Rehabil. 2005;25(1):43-9.
17. Thompson RW, Gordon NF, Pescatello LS, American College of Sports Medicine. ACSM’s guidelines for exercise testing and prescription. Philadelphia: Lippincott Williams & Wilkins; 2009.
18. Standardization of Spirometry, 1994 Update. American Thoracic Society. Am J Respir Crit Care Med. 1995;152(3):1107-36.
19. Rodrigues SL, Mendes HF, Viegas CA. The six-minute walk test: effect of pre-test training on test results of chronic obstructive pulmonary disease patients. J Bras Pneumol. 2004;30(2):121-5.
20. Evans WJ, Campbell WW Sarcopenia and age-related changes in body composition and functional capacity. J Nutr. 1993;123(2 Suppl):465-8.
21. Callisaya ML, Blizzard L, Schmidt MD, McGinley JL, Srikanth VK. Sex modifies the relationship between age and gait: a population-based study of older adults. J Gerontol A Biol Sci Med Sci. 2008;63(2):165-70. 22. Lammers AE, Hislop AA, Flynn Y, Haworth SG. The
6-minute walk test: normal values for children of 4-11 years of age. Arch Dis Child. 2008;93(6):464-8. 23. Wasserman K, Hansen J, Sue DY, Stringer WW, Whipp
B. Principles of exercise testing and interpretation. Philadelphia: Lippincott Williams & Wilkins; 2005.
24. Dourado VZ, Banov MC, Marino MC, de Souza VL, Antunes LC, McBurnie MA. A simple approach to assess VT during a field walk test. Int J Sports Med. 2010;31(10):698-703.
25. Troosters T, Vilaro J, Rabinovich R, Casas A, Barberà JA, Rodriguez-Roisin R, et al. Physiological responses to the 6-min walk test in patients with chronic obstructive pulmonary disease. Eur Respir J. 2002;20(3):564-9. 26. Pelegrino NR, Lucheta PA, Sanchez FF, Faganello MM,
Ferrari R, Godoy I. Influence of lean body mass on
have introduced a selection bias. However, this type of sample has often been used in studies evaluating reference values for the total distance walked on field walking tests.(3-7,10) The GS
values, in combination with demographic and anthropometric attributes, did not increase the R2
values of the standard equations. This might be attributable to the fact that GS was consistently correlated with age, height, and weight, or there might have been multicollinearity among variables in the alternate models, which could also explain that finding. However, the variance inflation factor values were < 4, indicating that there was no such multicollinearity in the alternate models.
We conclude that GS is a determinant of the total distance covered on the 6MWT and ISWT. However, the inclusion of GS did not appreciably improve the power to predict 6MWD and ISWD in comparison with that of equations including only demographic and anthropometric attributes. Nevertheless, reference equations including muscle function could be useful for interpreting the walk performance of patients with skeletal muscle dysfunction.
References
1. ATS statement: guidelines for the six-minute walk test. ATS Committee on Proficiency Standards for Clinical Pulmonary Function Laboratories. Am J Respir Crit Care Med. 2002;166(1):111-7.
2. Singh SJ, Morgan MD, Scott S, Walters D, Hardman AE. Development of a shuttle walking test of disability in patients with chronic airways obstruction. Thorax. 1992;47(12):1019-24.
3. Enright PL, Sherrill DL. Reference equations for the six-minute walk in healthy adults. Am J Respir Crit Care Med. 1998;158(5 Pt 1):1384-7.
4. Troosters T, Gosselink R, Decramer M. Six minute walking distance in healthy elderly subjects. Eur Respir J. 1999;14(2):270-4.
5. Gibbons WJ, Fruchter N, Sloan S, Levy RD. Reference values for a multiple repetition 6-minute walk test in healthy adults older than 20 years. J Cardiopulm Rehabil. 2001;21(2):87-93.
6. Chetta A, Zanini A, Pisi G, Aiello M, Tzani P, Neri M, et al. Reference values for the 6-min walk test in healthy subjects 20-50 years old. Respir Med. 2006;100(9):1573-8.
7. Enright PL, McBurnie MA, Bittner V, Tracy RP, McNamara R, Arnold A, et al. The 6-min walk test: a quick measure of functional status in elderly adults. Chest. 2003;123(2):387-98.
29. Norman K, Schütz T, Kemps M, Josef Lübke H, Lochs H, Pirlich M. The Subjective Global Assessment reliably identifies malnutrition-related muscle dysfunction. Clin Nutr. 2005;24(1):143-50.
30. Taekema DG, Gussekloo J, Maier AB, Westendorp RG, de Craen AJ. Handgrip strength as a predictor of functional, psychological and social health. A prospective population-based study among the oldest old. Age Ageing. 2010;39(3):331-7.
cardiopulmonary repercussions during the six-minute walk test in patients with COPD. J Bras Pneumol. 2009;35(1):20-6.
27. Ling CH, Taekema D, de Craen AJ, Gussekloo J, Westendorp RG, Maier AB. Handgrip strength and mortality in the oldest old population: the Leiden 85-plus study. CMAJ. 2010;182(5):429-35.
28. Al Snih S, Markides KS, Ray L, Ostir GV, Goodwin JS. Handgrip strength and mortality in older Mexican Americans. J Am Geriatr Soc. 2002;50(7):1250-6.
About the authors
Victor Zuniga Dourado
Adjunct Professor. Universidade Federal de São Paulo – UNIFESP, Federal University of São Paulo – Baixada Santista Campus, Santos, Brazil.
Milena Carlos Vidotto
Adjunct Professor. Universidade Federal de São Paulo – UNIFESP, Federal University of São Paulo – Baixada Santista Campus, Santos, Brazil.
Ricardo Luís Fernandes Guerra