BAR, Curitiba, v. 6, n. 2, art. 5,
p. 153-172, Apr./June 2009
Is the Need to Evaluate a Real Consumers’ Need?
Is the Need to Evaluate a Real Consumers’ Need?
Is the Need to Evaluate a Real Consumers’ Need?
Is the Need to Evaluate a Real Consumers’ Need?
Valter Afonso Vieira *
E-mail address: [email protected] Universidade Tecnológica Federal do Paraná – UTFPR Pato Branco, PR, Brazil.
A
A
A
A
BSTRACTBSTRACTBSTRACTBSTRACTEvaluation is defined as the assessment of the positive and/or negative qualities of an object, which is assumed to be among the most pervasive and dominant human responses. Individuals constantly need to evaluate things, people, products and so forth. The main goal of this paper is to analyze the Need to Evaluate [NES] scale in Brazil. Specifically, the paper assesses its psychometric proprieties. From the evidence reported in the study, the validity of the NES scale is poor and its dimensionality questionable. The alpha value was above .70 in only one of the three dimensions. Furthermore, the outcomes did not suggest that the NES is a unidimensional scale, as originally constructed. Moreover, a formative (vs. reflexive) scale model presented the best adjustments from the concurrent models.
Key words: scale; NES; evaluate.
Received 30 July 2008; received in revised form 05 February 2009.
Copyright © 2009 Brazilian Administration Review. All rights reserved, including rights for
translation. Parts of this work may be quoted without prior knowledge on the condition that
the source is identified.
* Corresponding author: Valter Afonso Vieira
IIII
NTRODUCTIONNTRODUCTIONNTRODUCTIONNTRODUCTIONEvaluation is defined as the assessment of the positive and/or negative qualities of an object, which is assumed to be among the most pervasive and dominant human responses (Jarvis & Petty, 1996). Individuals constantly need to evaluate things, people, products and so forth. In fact, the possibility that people consistently vary in both the likelihood and extension of evaluative responding across situations and objects seems to have escaped consideration in the literature (Jarvis & Petty, 1996). Therefore, studying how consumers evaluate objects across different situations could help the literature to explain and/or to predict better some buying behaviors.
Markus and Zajonc (1985) comment on the magnitude of evaluating objects, saying that “it is not possible to view a social object or a social act without at the same time making an assessment on dimensions closely corresponding to good/bad, pleasant/unpleasant, high/low, etc” (p. 210). This suggests that assessment is intrinsic to consumers’ thinking. Moreover, there is the hypothesis that there is a chronic tendency among individuals to engage in evaluative responding, assessment inherent in decision making. In an effort to measure the magnitude of evaluating objects, Jarvis and Petty (1996) proposed the Need to Evaluate [NES] instrument. If this instrument is valid, it may be used by managers seeking to understand how people evaluate products, services, sellers, stores and the environment, etc.
The main purpose of this paper is to analyze the NES psychometric structure. Hence, this paper is structured as follows: the next part, the literature review, defines the NES construct and dimensions. After that, the method used in the field research is presented. Data analysis shows the results and general conclusions at the end of the paper.
L
L
L
L
ITERATURE ITERATURE ITERATURE ITERATURER
R
R
R
EVIEWEVIEWEVIEWEVIEWNeed to evaluate is defined as the assessment of the positive and/or negative qualities of an object (Jarvis & Petty, 1996). The term need is used here as it was intended to be understood in development of the Need for Cognition Scale (Cacioppo & Petty, 1982), the Personal Need for Structure Scale (Neuberg & Newsome, 1993) and the Need for Closure Scale (Webster & Kruglasnki, 1994). That is why we do not presume any biological basis for this individual difference, though one is possible.
According to Jarvis and Petty (1996) there are at “least four sources of evidence for the assertion the evaluation is a pervasive and dominant response for most consumers across the many situations and objects they encounter” (p. 173). These four sources are shared as (a) the factor analysis of adjective ratings, (b) research on the automatic activation of attitudes, (c) the common observation that most consumers can easily report their attitudes toward a wide variety of objects when asked, and (d) compelling though primarily theoretical literature on the functionality of attitudes. The hypothetical dimensions are discussed as follows.
(Osgood et al., 1957). In other words, it means that each participant has equally strong evaluative responses across the set of objects rated. Alternatively, the same apparent dominance could have emerged if the evaluative factor were accounting for an even greater proportion of variance in the judgments of some respondents, while accounting for a proportionately smaller amount of variance in other participants’ judgments (Jarvis & Petty, 1996).
Research on the Automatic Activation of Attitudes. A second line of research supporting the pervasiveness and dominance of evaluative responding comes from relatively recent studies on the automatic activation of attitudes (Bargh, Chaiken, Govender, & Pratto, 1992; Fazio, Sanbonmatsu, Powell, & Kardes, 1986). These studies have provided compelling evidence that attitudes are often activated from memory automatically, based on mere exposure to an attitude object and that the magnitude of this activation is proportional to the strength of the attitude (Jarvis & Petty, 1996). Although this evidence offers compelling support for the pervasiveness of attitudes toward common objects (Bargh et al., 1992), as yet there has been no evidence to suggest either that such effects and their magnitudes are similar across most consumers, or that there is consistency between individuals in the relative dominance of evaluation relative to other, forms of responding. In that sense, it assumes that if an object is presented to individuals, no matter where or when, they will automatically evaluate it, using their attitude toward the object as a basis (Jarvis & Petty, 1996). In addition, we should also recognize that the automatic activation of evaluative associations does not imply the dominance of evaluative thought over other types of thought across all people. According to most network models of memory (Collins & Loftus, 1975), most object representations in memory have multiple associations (e.g. color, size, etc) to which activation will spread on initial activation of the object. The automatic attitude activation effect primarily demonstrates that for common objects, one such association is evaluative. However, these findings do not suggest the strength or precedence of this association relative to the other object associations in memory.
Ease of Evaluative Responding. In this third presumed dominance of evaluation in human judgment, the grounding comes from the common observation of the invariable ease in which people are able to report attitudes toward an enormous array of stimuli and that these individuals having no trouble in reporting attitudes toward objects about which they have engaged in relatively little thought (Jarvis & Petty, 1996). For example, objects of negligible meaning, such as nonsense syllables, ideographs and faces of strangers (Zajonc, 1968) can be easily evaluated by consumers. In fact, this common observation has previously been offered as support for the pervasiveness of attitudes (Greenwald, 1989). Thus, the relative ease with which people report attitudes toward a variety of objects is clear and simple. However, whether this suggests that evaluative responding is equally pervasive among all people is not. Furthermore, these results do not indicate whether respondents would have engaged in evaluation if this was not required by the task.
These are at least the four hypothetical sources of evidence for the allegation that evaluation is an omnipresent and dominant reaction for most individuals across situations. The next topic presents the method used to assess the psychometric proprieties of NES scale.
R
R
R
R
ESEARCH ESEARCH ESEARCH ESEARCHD
D
D
D
ESIGNESIGNESIGNESIGNIn order to analyze the NES psychometric proprieties, back translation of the scale was used to create the Brazilian version of the NES instrument. Two marketing academics who were fluent in Portuguese did this job (Malhotra, 2001). The questionnaire was then translated back to English and compared with the original. The questionnaire was then submitted to three consumer behavior students fro pre-testing. An in-depth interview was conducted with each student to identify any eventual problems, in order to identify ambiguities and misleading aspects of the instrument. Modifications were implemented and a final version of the scale was shaped (see Appendix 1). A total of 171 observations were made at suitable university facilities. All those involved were undergraduate business students. The sample was defined as non-probabilistic by convenience (Malhotra, 2001). The questionnaire contained a 16-item the NES scale from Jarvis and Petty (1996) and an 18-item Need for Cognition [NFC] instrument from Cacioppo and Petty (1982). All scales were managed as a Likert 7-point style; varying from Strongly Disagree to Strongly Agree.
Construct Conceptual Definitions. Need to Evaluate is defined as the assessment of the positive and/or negative qualities of an object (Jarvis & Petty, 1996). Need for Cognition [NFC] is the necessity of extracting the best of reasoning in the decision making process (Cacioppo & Petty, 1982). Need for Cognition was associated with the NES scale, analyzing their correlation results and moderating effect.
D
D
D
D
ATA ATA ATA ATAA
A
A
A
NALYSISNALYSISNALYSISNALYSISInitially, all variables were analyzed in terms of missing values, outliers’ univariate (Z = ±3) multivariate (D²), linearity, multicoliniarity, skewness, kurtosis and normality (Hair, Anderson, Tatham, & Black, 1998). Although ten observations were excluded because of missing values, the remainder were found to be within the boundaries suggested in the literature (Kline, 1998). After that, exploratory factor analysis [EFA] sought to analyze the NES dimensionality (Floyd & Widaman, 1995). The criteria used for retaining the variables were three: factor loading above .35, eigenvalues over one, and parallel analysis. Tabachnick and Fidell (2001) suggested .32 as a minimum criterion for factor loading be retained. As a result, this paper chose .35 as more conservative criterion. The extraction method chosen was non-orthogonal (PAF-Oblimin). It is justified because (a) the factors are supposed to be correlated in social science, (b) oblique rotations will always meet the simple structure criterion better than orthogonal rotations and (c) some research supports a slight superiority of oblique rotations in terms of factor replicability (Reise, Waller, & Comrey 2000).
The solution suggested a three-factor structure (see Table 1). Kaiser-Meyer-Olkin = .67 was little under the .70 suggested by Hair et al. (1998). Communalities (h2) were all under the .45 suggested by Clark and Watson (1995), except variable ‘NES 15’. The minimum difference between the factor loadings was in the variable ‘NES 4’, which is .38 - .26=.12. It is above the minimum .10 criteria used by Laros and Puente-Palacios (2004). Interpreting the results, the NES scale is a three-factor model that explains 50.93%.
Table 1: Exploratory Factor Analysis of the NES Scale
Item Factor Analysis Cross Validation h² M s.d. CFA Thompson
NES 15 .85 .11 -.07 .81 -.15 .08 .46 4.97 1.67 .69
NES 13 .62 -.10 .21 .80 .13 -.02 .24 5.29 1.56 .78
NES 4 .38 .00 .26 .37 .02 .32 .26 5.47 1.56 .53
.83 .12
NES 8 -.03 .57 -.02 .00 .62 .02 .13 3.59 2.16 .57
NES 14 .13 .49 -.03 .09 .55 -.08 .20 3.82 1.79 .49
NES 6 .01 .44 .05 .05 .55 .01 .20 3.59 1.84 .45
NES 16 .09 .44 -.10 -.23 .45 .09 .31 3.57 1.80 .44
NES 2 -.13 .38 .06 .03 .44 -.05 .43 3.66 2.12 .36
.00 .99
NES 3 -.09 .01 .70 -.18 -.03 .81 .17 4.54 1.79 .54
NES 12 .19 .09 .56 .27 .14 .65 .22 4.74 1.78 .70
NES 10 .07 -.07 .45 .13 -.14 .57 .15 4.35 1.80 .51
.84 -.11
Note: M = mean of variable; s.d. =standard deviation, CFA = confirmatory factor loading standardized; Thompson = a third-order construct analysis; h2 = communalities; variables code are the same as from Jarvis and Petty (1996); see appendix III; from Thompson two item=.57.
The empirical eigenvalues found by the EFA were 2.95; 1.93 and 1.13. Initially these results rejected the unidimensional model originally proposed by Jarvis and Petty (1996). In practice, some authors suggested that eigenvalues over one, as the criterion for determining the number of components to retain, are problematic since this method has an approximately eighty percent chance of being wrong when compared to scree plot, parallel analysis, ²-Bartlett and MAP (Zwick & Velicer, 1986). Parallel analysis is the best one, since it produces errors near to ten percent. According to Zoski and Jurs (1996) “parallel analysis compares the eigenvalues of the correlation matrix to those of a matrix of randomly generated variables, where eigenvalues from the research data should be greater than those from the random data” (p. 444). Hence, parallel analysis (Enzmann, 1997) was done using the SPSS syntax (Appendix 2). The outcomes suggested the following artificial eigenvalues: 1.44, 1.31, 1.21 and 1.12. In that context, parallel analysis suggested that a two-factor model should exist rather than three components, rejecting again the Jarvis and Petty (1996) NES unidimensional structure and the initial three-factor structure presented by our EFA. It is because only the two empirical eigenvalues (2.95 and 1.93) were greater than the first two artificial eigenvalues (1.44 and 1.31).
Figure 1: Scree Plot of the NES Scale
Factor Number
11 10 9 8 7 6 5 4 3 2 1
E
ig
e
n
v
a
lu
e
3,0
2,5
2,0
1,5
1,0
,5
0,0
Summarizing, the three factors suggested the following values for internal consistence: factor 1 = .70; factor 2 = .57 and factor 3 = .61. Note that all alpha values were under the value suggested by Nunnally (1978) as an indicator of high reliability structure, indicating a possible lack of consistency. The correlation values from exploratory factor analysis components were: between factor 1 and factor 2 (r = .08; p = NS); between factor 1 and factor 3 (r = .36; p < .01) and between factor 3 and factor 2 (r = -.08; p = NS).
Cross-Validation. Laros and Puentes-Palacios (2004) indicated that cross validation is a method for assessing the scale structure stability across a second sample. The assumption is that the capacity of structure found be the same in a second sample, as it was in the first. Hence, the sample was random shared in 50% and this new sample was used for assessing the instrument stability (N= 81). In this analysis, it is important to recognize that the total sample proportion by variables is below the 20:1 indicated by Costello and Osborne (2005). However, the main assumption in the cross-validation is attempted to confirm the three component structure in this new random sample. It is hypothesized that the same three components found in the EFA will appear again or at least the two components from the first parallel analysis.
The cross-validation results were: Kaiser-Meyer-Olkin= .88, cumulative variance extracted = 57%, and empirical eigenvalues = 2.82; 2.11; and 1.35. Reliability coefficients for the factors were = .73; = .63 and = .72, respectively. According to Table 1, the outcomes of the cross validation confirm the three component structure found by the EFA. Therefore, parallel analysis was used again to prove whether it is the correct solution of the NES instrument. The artificial eigenvalues were 1.64; 1.44; 1.29; and when they are compared with the empirical eigenvalues (2.82; 2.11; and 1.35), a three-component structure appears.
To sum up, it can be inferred that the NES theoretical model was inconsistent across these analyses, since (a) the EFA showed a three-factor structure, (b) parallel analysis on the overall sample showed a two factor structure, (c) the scree plot showed a two factor structure, (d) the EFA on half sample showed a three-factor structure and (e) parallel analysis on half sample showed a three-factor structure. Hence, more tests need to be done in order to achieve a general conclusion of the NES dimensionality.
superordinate factors in an instrument (Smith & McCarthy, 1995). It was hypothesized that only one second-order factor might appear covering the three dimensions.
For testing the hypothetical hierarchical structure, an analysis of second-order factors was made using the SPSS Syntax of Thompson (2004), see Appendix 3. The three factors were then transformed into mean variables (on a scale of 1 to 7 points). After that, these mean variables were used in a second-order exploratory factor analysis. The mean variables (M), standardized deviation ( ), communalities (h²) and variance explained values [VE] found were: Factor 1 M = 5.24, =1.26, h²= .71, VE=46%; Factor 2 M = 3.65, =1.18, h²=.98, VE=33% and Factor 3 M = 4.54, =1.34, h² = .71, VE= 19%. According to the results, a second-order hierarchical structure did not appear. The factor loadings can be seen in the last two columns of Table 1.
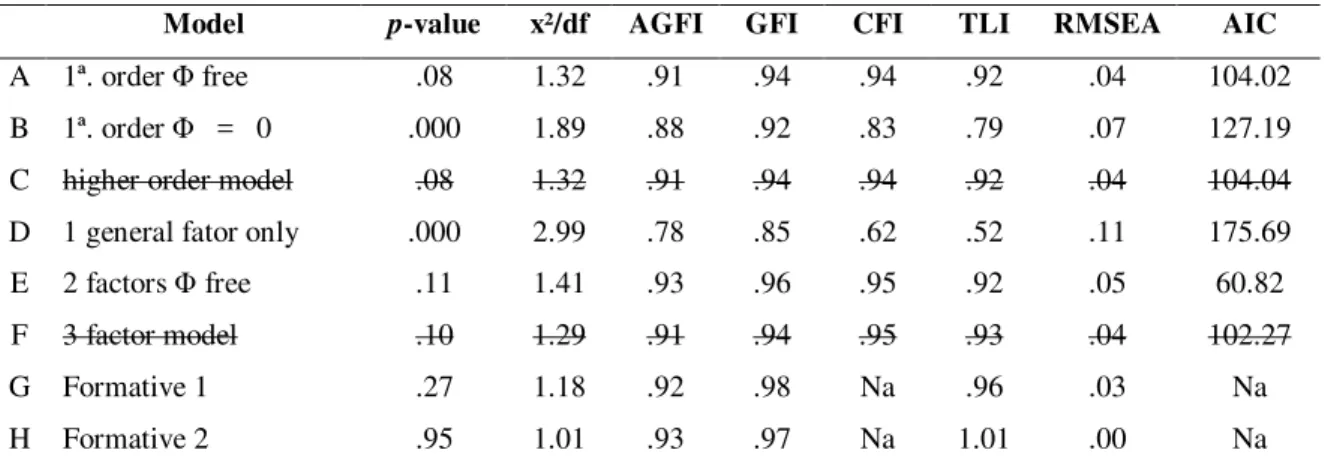
Confirmatory Factor Analysis. The next step in the data analysis was to assess scale structure using confirmatory factor analysis. Concurrent models using the covariance matrix were estimated with AMOS software (Byrne, 2001; Kline, 1998). Eight competing measurement models were examined for: (A) a first-order model with correlation ( ) free among the three factors (results from our EFA), (B) a first-order with fixed in 0 among the three factors, (C) a second-order model, (D) a single one-factor model hypothesized by Jarvis and Petty (1996), (E) a first-order model with free among the two factors (factor 1 and 2; results from first parallel analysis), (F) a third-order model from Thompson (2004) SPSS syntax suggestion and (G & H) two other models using formative constructs (Jarvis, Mackenzie, & Podsakoff, 2003), which will be explained later. The results and the adjustments of the concurrent models can be viewed in Table 2.
Table 2: Confirmatory Factor Analysis of the NES Scale and Competing Models
Model p-value x²/df AGFI GFI CFI TLI RMSEA AIC
A 1ª. order free .08 1.32 .91 .94 .94 .92 .04 104.02 B 1ª. order = 0 .000 1.89 .88 .92 .83 .79 .07 127.19 C higher order model .08 1.32 .91 .94 .94 .92 .04 104.04 D 1 general fator only .000 2.99 .78 .85 .62 .52 .11 175.69
E 2 factors free .11 1.41 .93 .96 .95 .92 .05 60.82
F 3 factor model .10 1.29 .91 .94 .95 .93 .04 102.27
G Formative 1 .27 1.18 .92 .98 Na .96 .03 Na
H Formative 2 .95 1.01 .93 .97 Na 1.01 .00 Na
Note: Maximum likelihood estimation; N.a. = not available; correlation between constructs = ; model “E” is the best model
According to the outcomes, model C did not present an admissible solution, since a negative variance appears in error/disturbance of factor 1 and, because of that, model C is scratched out. Model
F also did not present an admissible solution, since a Haywood case appears in the path from the third-order factor to the second-third-order factor. Model E appears as the best solution from the rival models to represent the NES construct. It uses only two factors generated by parallel analysis (Zwick & Velicer, 1986). The second best solution is model A, which is a first-order model with correlation free among the three factors. Looking to analyze the best one, a comparison of the models AversusE was done. It did not show a significant difference ² (d.f.)= 27.2 (22); p < .203. Thus, it can be concluded that these two models are the best from the eight rival models tested. Note that both models (A & E) have non-significant p-values, indicating similarities between the estimate and real covariance matrix.
fit may be too much to ask for, instead, the problem is to assess how well a given model approximates the true model” (p. 9).
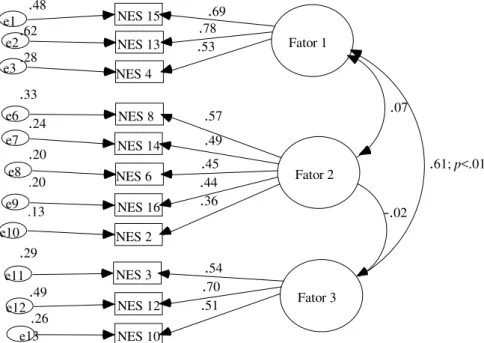
Figure 2 shows the confirmatory factor analysis of the NES Scale. The figure shows model A, where only one covariance is significant. It is from Factor 1 versus Factor 3 (r = .61; p < .000). The standardized residuals did not present values above ± 2.58.
Figure 2: Reflective Confirmatory Factor Analysis of the NES Scale
Note: standardized factor loadings and correlation among constructs.
Formative versus Reflective Constructs. Jarvis et al. (2003), McCallum and Browne (1993) and Diamantopoulos and Winkhofer (2001) comment that construct in majority of marketing and consumer behavior research is treated as reflective. However, some of them are in fact formative constructs, since the observed variation in the measures causes the latent construct. It makes more sense conceptually to view causality flowing from the measures to the construct (Fornell & Bookstein, 1982). In fact, formative models can be an alternative test of analyzing the featured phenomenon.
Bollen and Lennox (1991) justify this warning commenting that “researchers should not automatically confine themselves to the unidimensional classical test model” (p. 312). The importance of doing this alternative test for Diamantopoulos and Winkhofer (2001) is that “several marketing constructs currently operationalized by means of reflective indicators would be better captured if approached from a formative perspective” (p. 274). According to Jarvis et al. (2003) it is important to note that one could interpret the formative model is three ways: (a) as a single construct with six formative and five reflective measures, (b) as six exogenous variables influencing a single endogenous construct with five reflective measures, or (c) as a formatively measured construct that influences five manifest measures. In addition to the six concurrent models tested previously, two formative latent structures were assessed (G and H). Figure 3 shows one of them and Table 2 the results. .48 .62 .28 .33 .24 .20 .20 .13 .29 .49 .26 Fator 1 NES 15 e1 NES 13 e2 NES 4 e3 .69 .78 .53 Fator 2 NES 8 e6 NES 14 e7 NES 6 e8 NES 16 e9 NES 2 e10 .57 .49 .45 .44 .36 Fator 3 NES 3 e11 NES 12 e12 NES 10 e13 .54 .70 .51 .07
.61; p<.01
Figure 3: Formative Confirmatory Factor Analysis of the NES Scale
Model G assumes a formative construct using factor 1 and factor 3 to create the second-order NES construct, hierarchical comparison as suggested by Thompson (2004). In that model, variables from the factor 2 were used as reflective variables, as indicated by Jarvis et al. (2003) for specifying the formative model (see Figure 3). Model H assumes a formative construct using factor 1 and factor 2, as a result suggested by parallel analysis. Variables from factor 3 were used as reflective variables.
Model G adjustments values were ²/d.f.= 1.18; p-value= .27; AGFI= .92; GFI= .98; TLI= .96 and RMSEA= .03. Model H, which had best fits, values were ²/d.f.= .95; p-value= .54; AGFI= .93; GFI = .97; TLI = 1.01 and RMSEA = .00. The chi-squared difference between them was not significant ²(d.f.) = 8.67 (13); p-value=.79.
From the model G (see Figure 3), the variables that did not have a significant impact on the NES construct were: ‘NES 4’, ‘NES 3’ and ‘NES 10’ and Factor 2 over the NES Scale. From the model G, the variables that did not have a significant impact on the NES construct were ‘NES 15’, ‘NES 8’, ‘NES 14’ and ‘NES 16’ and factor 3 over the NES Scale.
The correlation matrix did not show many significant values. In fact, the majority of the matrix presented non-significant values. This could be an indicative of poor performance of factor analysis. Moreover, no negative significant values were found. The results can be seen in Table 3. From the 136 possible correlations, just 49 were significant (36%).
Fator 1 NES 15
NES 13 NES 4
Fator 3
NES 8 NES 14 NES 6 NES 16 NES 2 NES 3
NES 12 NES 10
1
d3
1 d2
1
1 1
NES - Scale
1 d1 1 1
g5 g6
g7 g8 g9
Table 3: Correlation Matrix of the NES Scale Items
1 2 3 4 5 6 7 8 9 10 11 12 13 14 15 16
NES 1 1,00
NES 2 0,08 1,00 NES 3 0,27** 0,07 1,00 NES 4 0,16* -0,01 0,25* 1,00 NES 5 0,16* 0,17* 0,07 0,02 1,00 NES 6 0,13 0,12 0,04 0,02 0,18* 1,00 NES 7 0,12 -0,11 0,05 0,05 0,04 0,12 1,00 NES 8 0,07 0,28** -0,09 -0,07 0,04 0,26** 0,15* 1,00 NES 9 0,22* 0,08 0,03 0,26** 0,03 -0,02 0,07 0,06 1,00 NES 10 0,14 -0,12 0,34** 0,13 0,12 -0,05 0,08 -0,02 0,21** 1,00 NES 11 0,23* -0,01 0,18* 0,12 0,12 0,06 0,11 0,07 0,25** 0,25** 1,00 NES 12 0,27* -0,05 0,37* 0,37** 0,08 0,05 0,27** 0,02 0,17* 0,33** 0,18* 1,00 NES 13 0,23* -0,06 0,23* 0,38** 0,12 0,05 0,37** -0,04 0,26** 0,25** 0,19** 0,37** 1,00 NES 14 0,19* 0,18* -0,05 0,05 0,05 0,25** 0,19* 0,23** 0,13 -0,04 0,10 0,10 0,02 1,00 NES 15 0,20* -0,03 0,11 0,37** 0,12 0,07 0,27** 0,10 0,22** 0,17* 0,14 0,25** 0,56** 0,20* 1,00 NES 16 0,02 0,10 -0,09 0,06 0,10 0,20* 0,06 0,26** -0,03 -0,06 0,01 0,03 -0,10 0,25* 0,16* 1,00 *p <,05; **p <,01
M
M
M
M
ODERATING ODERATING ODERATING ODERATINGR
R
R
R
OLE OF OLE OF OLE OF OLE OFNES
NES
NES
NES
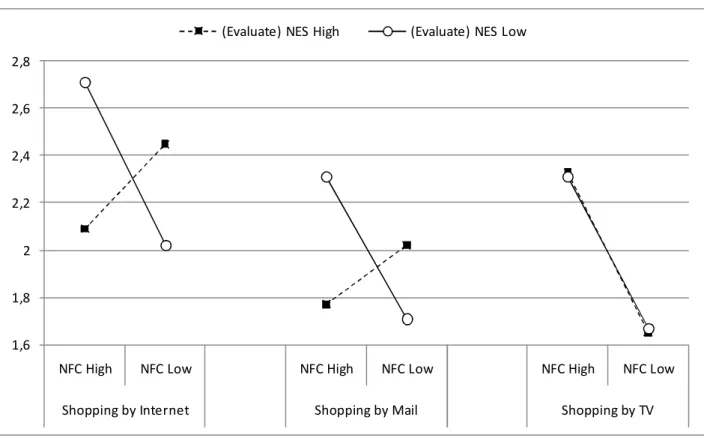
We supposed that NES moderates the association between need for cognition and direct media. Direct media are comprehended as shopping by mail, TV and Internet. Consumers high in need for cognition should indicate that they contemplated the decision process well prior to their shopping behavior. In that sense, since a strong cognitive effort was structured, the need to evaluation the store may be lower. Thus, consumers high in need for cognition and low in need to evaluate should have more intention of buying by direct media. On the contrary, consumers low in need for cognition should indicate that they did not contemplate the decision process prior to their shopping behavior. It may be an unexpected shopping intention which may generate doubts. In that sense, since a low or absent cognitive effort exists, the need to evaluate the store/place may be higher in order to eliminate the regret. Consequently, consumers low in need for cognition and high in need to evaluate should have greater intentions in buying by direct media, control balancing their judgment. Based on these arguments, we supposed that NES moderates the association between need for cognition and direct media.
To test this hypothesis, a 2 X 2 factorial design was used. Need for cognition and need to evaluate groups were created by sharing the groups by using median groups (high and low). As manipulation checking, the high need for cognition group had a greater mean when compared with low need for cognition (Mhigh NFC = 4.27 vs. Mlow NFC = 2.34; F (1, 154) = 320.81; p< .000). In addition, the high need
to evaluate group had a greater mean when compared with low need to evaluate (Mhigh NES = 6.00 vs. Mlow NES = 4.16; F (1, 159) = 283.86; p< .000). The results are shown in Figure 4.
As hypothesized, the moderation test showed a significant cross over interaction effect of NES on the relationship between NFC and shopping by internet (F(1,154) = 3.71, p< .05), between NFC and shopping by mail (F(1,154) = 3.72, p< .05) and not between NFC and shopping by TV (F(1,154) = 0.00, p=NS). Consumers in the low NES condition had more intention of shopping by internet in the high NFC rather than the low NFC (Mhigh NFC = 2.71 vs. Mlow NFC = 2.02; F(1,78) = 3.80, p<.05). When
changing the groups, the participants in the high NES condition had more intention of shopping by internet in the low NFC rather than the high NFC (Mhigh NFC = 2.09 vs. Mlow NFC = 2.45; F(1,74) = .67, p=NS).
of shopping by mail in the low NFC rather than the high NFC (Mhigh NFC = 1.77 vs. Mlow NFC = 2.02; F(1,74) = .74, p=NS). This evidence supports the NES cross over moderation effect, since when it is associated with need for cognition, greater intentions in buying by direct media appear.
Figure 4: Moderating Role of NES
1,6 1,8 2 2,2 2,4 2,6 2,8
NFC High NFC Low NFC High NFC Low NFC High NFC Low
Shopping by Internet Shopping by Mail Shopping by TV
(Evaluate) NES High (Evaluate) NES Low
R
R
R
R
ESULTS ESULTS ESULTS ESULTSD
D
D
D
ISCUSSIONISCUSSIONISCUSSIONISCUSSIONTheoretical Implications
Theoretical Implications
Theoretical Implications
Theoretical Implications
It is interesting to note that although Jarvis and Petty (1996) affirmed that the NES has “a single factor structure” (p. 172) their factor analysis suggested two factors. In addition, although the eigenvalues were not shown, from the scree plot it could be inferred that the NES has a three-factor structure, rather than one, as advocated by Jarvis and Petty (1996). The results found here confirm the multidimensional aspect presented in the literature.
Specifically, the outcomes from this research indicate that factor 1 contains items that assess whether people pay attention (NES 13), decide (NES 15) or want to know (NES 4) things as good or bad in their lives. In other words, it means that objects can have just a dichotomy view in terms of assessing positive and negative. In this first dimension, consumers are not so convinced of their opinions about assessing objects. In short, this paper classifies the first dimension as Avoiding Extreme Opinion.
when I have to and there are many things for which I do not have a preference. Hence, this paper nominates factor two as Preference for Neutrality.
Factor 3 clearly suggests that the domain of opinion is important to consumers. While factor 1 assesses whether people see things as good/ bad or positive/negative, factor 3 tries to know whether people have strong, clear and decisive opinions about things independently of being extremely good or bad. Items in this dimension indicate that it is very important for consumers to have strong opinions. Thus, this factor is defined as Preference for Decisive Opinion.
M
M
M
M
ANAGERIAL ANAGERIAL ANAGERIAL ANAGERIALA
A
A
A
PPLICATIONSPPLICATIONSPPLICATIONSPPLICATIONSThis paper, establishing individual differences in evaluative responding, provides a challenge to the prevailing assumption that evaluation invariably pervades and dominates the responses of most consumers in most situations. Need to evaluate may moderate the likelihood and extent of the automatic attitude activation effect, especially for those objects with which consumers are not highly familiar. For example, if participants high in the need to evaluate are more likely to engage in spontaneous evaluative responding, then perhaps the need to evaluate would moderate the effects of mere thought on attitude polarization.
Second, in the public opinion field, need to evaluate has a positive impact on presidential campaign information acquisition. It means that both constructs are related to measures of candidate information, i.e. correct ideological placement, correct policy placement and number of candidate articulations (Holbrook, 2006). Need to evaluate focuses specifically on willingness to engage in evaluation, which presumably requires information to play a role in information acquisition during presidential campaigns. To the extent that need to evaluate taps individual differences in the willingness or capacity to engage in affective processes, this might also be expected to lead to more active information gathering, as suggested by existing research on affective intelligence (Marcus, Neuman, & MacKuen, 2000).
Third, the need to evaluate scale may be used to support the hypothesis that people with high need to evaluate are more irritated after exposure to specifics ads. Commercial attributes generate negative reactions to that commercial and the brand advertised. This suggests that consumers with a high need to evaluate will show such a transfer of irritation more clearly than will low need to evaluate consumers. This hypothesis was support by Fennis and Bakker (2001), demonstrating that high need to evaluate individuals were more irritated after exposure to disliked or many ads and, consequently, more negatively affected in their evaluations of the neutral ad and brand.
Fourth, NES moderates the association between need for cognition and direct media in a cross over direction. Specifically, it means that consumers low (vs. high) in need for cognition (i.e. unexpected shopping intention) and high (vs. low) in need to evaluate (i.e. assessing the store, place and sellers) should have greater (vs. lower) intentions in buying by direct media.
C
C
C
C
ONCONCONCONCLUSIONLUSIONLUSIONLUSIONthree dimensions: Avoiding Extreme Opinion, Preference for Neutrality and Preference for Decisive Opinion.
Compose reliability and average of variance extracted were all under that suggested by literature (Fornell & Larcker, 1981). In addition, internal consistence was poor. The alpha value was above .70 in only one of the three components. Questions of validity and reliability need to retested in future studies. The other point demonstrated by the paper is that the variables suggested by Jarvis and Petty (1996) do not correlate well with each other. According to Table 3, just 36% of them were significant. Thus, future qualitative research could create new other variables to represent the NES construct. Another option for future research is to create a shorter version of the NES 16-item scale. For instance, Richins (2004) reported the development of a short version of the material values scale with better dimensions properties and described a psychometric approach for developing shorter versions of extant multi-item measures.
R
R
R
R
EFERENCESEFERENCESEFERENCESEFERENCESBargh, J. A., Chaiken, S., Govender, R., & Pratto, F. (1992). The generality of the automatic activation effect. Journal of Personality and Social Psychology, 62(6), 893-912.
Bollen, K., & Lennox, R. (1991). Conventional wisdom on measurement: a structural equation perspective. Psychological Bulletin, 110(2), 305-314.
Byrne, B. (2001). Structural equation modeling with AMOS: basic concepts, applications and programming. Mahwah, NJ: Lawrence Erlbaum Associates.
Cacioppo, J. T., & Petty, R. E. (1982). The need for cognition. Journal of Personality and Social Psychology, 42(1), 116-131.
Clark, L. A., & Watson, D. (1995). Constructing validity: basic issues in objective scale development. Psychological Assessment, 7(3), 309-319.
Collins, A. M., & Loftus, E. F. (1975). A spreading-activation theory of semantic processing. Psychological Review,82(6), 407-428.
Costello, A. B., & Osborne, J. W. (2005). Best practices in exploratory factor analysis: four recommendations for getting the most of your analysis. Practical Assessment, Research & Evaluation, 10(7), 1-9.
Diamantopoulos, A., & Winklhofer, H. M. (2001). Index construction with formative indicators: an alternative to scale development. Journal of Marketing Research, 38(2), 269-277.
Edwards, J. A., & Weary, G. (1993). Depression and the impression formation continuum: piecemeal processing despite the availability of category information. Journal of Personality and Social Psychology, 64(4), 636-645.
Enzmann, D. (1997). RanEigen: a program to determine the parallel analysis criterion for the number of principal components. Applied Psychological Measurement, 21(3), 232.
Fazio, R. H. (1995). Attitudes as object-evaluation associations: determinants, consequences and correlates of attitude accessibility. In R. E. Petty, & J. A. Krosnick (Eds.). Attitude strength: antecedents and consequences (pp. 247-282). Mahwah, N.J: Erlbaum.
Fennis, B. M., & Bakker, A. B. (2001). Stayed tuned we will be back right after these messages: need to evaluate moderates the transfer of irritation in advertising. Journal of Adversiting, 30(3), 15-26.
Floyd, F. J., & Widaman, K. F. (1995). Factor analysis in the development and refinement of clinical assessment instruments. Psychological Assessment, 7(3), 286-299.
Fornell, C., & Bookstein, F. L. (1982). Two structural equation models: LISREL and PLS applied to consumer exit-voice theory. Journal of Marketing Research, 19(4), 440-452.
Fornell, C., & Larcker, D. F. (1981). Evaluating structural equation models with unobservable variables and measurement error. Journal of Marketing Research, 18(1), 39-50.
Greenwald, A. G. (1989). Why are attitudes important? In A. R. Pratkanis, S. J. Beckler, & A. G. Greenwald (Eds.). Attitude structure and function (pp. 1-10). Hillsdale, N.J: Erlbaum.
Hair, J., Jr., Anderson, R. E., Tatham, R. L., & Black, W. (1998). Multivariate data analysis. New Jersey: Prentice Hall.
Holbrook, T. M. (2006). Cognitive style and political learning in the 2000 U.S. presidential campaign. Political Research Quarterly, 59(3), 343-353.
Hox, J. J., & Bechger, T. M. (1998). An introduction to structural equation modeling. Family Science Review, 11(4),354-373.
Jarvis, C. B., Mackenzie, S. B., & Podsakoff, P. M. (2003). A critical review of construct indicators and measurement model misspecification in marketing and consumer research. Journal of Consumer Research, 30(2), 199-218.
Jarvis, W. B. G., & Petty, R. (1996). The need to evaluate. Journal of Personality and Social Psychology, 70(1), 172-194.
Katz, D. (1960). The functional approach to the study of attitudes. Public Opinion Quarterly, 24(2), 163-204.
Kline, R. B. (1998). Principles and practice of structural equation modeling. New York: Guilford Press.
Laros, J., & Puente-Palacios, K. (2004). Validação cruzada de uma escala de clima organizacional. Estudos de Psicologia, 9(11), 113-119.
Malhotra, N. (2001). Pesquisa de marketing (3rd ed.). Porto Alegre: Bookman.
Marcus, G. E., Neuman, R. W., & Mackuen, M. (2000) Affective intelligence and political judgment. Chicago: University of Chicago Press.
Markus, H., & Zajonc, R. B. (1985). The cognitive perspective in social psychology. In G. Lindzey, & A. Aronson (Eds.). Handbook of social psychology (Vol. 1, pp. 137-230). Hillsdale, NJ: Erlbaum.
McCallum, R. C., & Browne, M. W. (1993). The use of causal indicators in covariance structure models: some practical issues. Psychological Bulletin, 114(3), 533-541.
McDonald, R. P., & Ho, M. R. (2002). Principles and practice in reporting structural equation analyses. Psychological Methods, 7(1), 64-82.
Nunnally, J. C. (1978). Psychometric theory (2nd ed.). New York: McGraw-Hill.
Osgood, C. E., Suci, G. J., & Tannenbaum, P. H. (1957). The measurement of meaning. Urbana: University of Illinois Press.
Reise, S. P., Waller, N. G., & Comrey, A. L. (2000). Factor analysis and scale revision. Psychological Assessment, 12(3), 287-297.
Richins, M. L. (2004). The material values scale: measurement properties and development of a short form. Journal of Consumer Research, 31(1) 209-219.
Russell, C. A., Norman, A. T., & Heckler, S. E. (2004). The consumption of Television programming: development and validation of the connectedness scale. Journal of Consumer Research, 31(1), 150-161.
Smith, G. T., & McCarthy, D. M. (1995). Methodological considerations in the refinement of clinical assessment instruments. Psychological Assessment, 7(3), 300-308.
Snyder, M., & DeBono, K. G. (1985). Appeals to images and claims about quality: understanding the psychology of advertising. Journal of Personality and Social Psychology, 49(3), 586-597.
Tabachnick, B. G., & Fidell, L. S. (2001). Using multivariate statistics. Boston: Allyn and Bacon.
Thompson, B. (2004). Exploratory and confirmatory factor analysis: understanding concepts and applications. Washington, DC: American Psychological Association
Webster, D. M., & Kruglanski, A. W. (1994). Individual differences in need for cognitive closure. Journal of Personality and social Psychology, 67(6), 1049-1062.
Zajonc, R. B. (1968). Attitudinal effects of mere exposure. Journal of Personality and Social Psychology, 9(2), 1-27.
Zoski, K. W., & Jurs, S. (1996). An objective counterpart to the visual scree test for factor analysis: the standard error scree. Educational and Psychological Measurement, 56(3),443-451.
Zwick, R., & Velicer, W. F. (1986). Comparison of five rules for determining the number of components to retain. Psychological Bulletin, 99(3), 432-442.
APPENDIX 1
APPENDIX 1
APPENDIX 1
APPENDIX 1
NES
NES
NES
NES
S
S
S
S
CALE CALE CALE CALEV
V
V
V
ARIABLESARIABLESARIABLESARIABLESNES 1: I form opinions about everything.
NES 2: I prefer to avoid taking extreme positions.**
NES 3: It is very important to me to hold strong opinions.
NES 4: I want to know exactly what is good and bad about everything.
NES 5: I often prefer to remain neutral about complex issues.**
NES 6: If something does not affect me, I do not usually determine if it is good or bad.**
NES 7: I enjoy strongly liking and disliking new things.
NES 8: There are many things for which I do not have a preference.**
NES 9: It bothers me to remain neutral.
NES 10: I like to have strong opinions even when I am not personally involved.
NES 11: I have many more opinions than the average person.
NES 12: I would rather have a strong opinion than no opinion at all.
NES 13: I pay a lot of attention to whether things are good or bad.
NES 14: I only form strong opinions when I have to.**
NES 15: I like to decide that new things are really good or really bad.
NES 16: I am pretty much indifferent to many important issues.**
APPENDIX 2
APPENDIX 2
APPENDIX 2
APPENDIX 2
P
P
P
P
ARALLEL ARALLEL ARALLEL ARALLELA
A
A
A
NALYSIS TO NALYSIS TO NALYSIS TO NALYSIS TOIIII
DENTIFY THE DENTIFY THE DENTIFY THE DENTIFY THEN
N
N
N
UMBER OF UMBER OF UMBER OF UMBER OFF
F
F
F
ACTORSACTORSACTORSACTORSDEFINE RanEigen( NItems !CharEnd ('/')
/NCases !CMDEnd).
/* --- */
/* --- SPSS-MACRO to compute Random Eigenvalues --- */
/* --- Enzmann, 2003 --- */
/* --- */
/* RanEigen computes random eigenvalues given the number of */
/* items (=variables) and number of cases by creating 2,000 */
/* correlation matrices based on normally distributed random */
/* numbers and by averaging the respective eigenvalues. In */
/* factor analyses the number of items should always (!) be */
/* less than the number of cases (a rule of thumb suggests a */
/* ratio of 2/3). The macro RanEigen gives no warning if this */
/* rule is violated. */
/* */
/* A replication of the random eigenvalues is possible by */
/* setting a certain seed-parameter each time the macro is */
/* run, for example */
/* */
/* SET SEED=12345. */
/* RanEigen Nitems = 8 */
/* /NCases = 24. */
/* */
/* The simulation is time consuming: 25 variables with 50 */
/* cases take about 5 minutes, 50 variables with 50 cases */
/* a Pentium 4, 1.7 GHz with 256 MB RAM) (much faster with */
/* SPSS 11.0). Thus, for 50 cases or more the Windows or DOS */
/* version of RanEigen (Enzmann, 2003) that is based on a */
/* method proposed by Lautenschlager (1989) should be used. */
/* */
/* More details concerning the use of random eigenvalues for */
/* parallel analysis can be found in Lautenschlager (1989) */
/* and Enzmann (1997). The Windows and DOS version of */
/* RanEigen is avaiable at */
/* http://www.kfn.de/softwareenzmann.html . */
/* */
/* References: */
/* Enzmann, D. (1997). RanEigen: A program to determine the */
/* the parallel analysis criterion for the number of */
/* principal components. Applied Psychological Measurement, */
/* 21, 232. */
/*, D. (2003). RanEigen 2.0. Internet: http://www. */
/* kfn.de/softwareenzmann.html . */
/* Lautenschlager, G. J. (1989). A comparison of alternatives */
/* to conducting Monte Carlo analyses for determining */
/* parallel analysis criteria. Multivariate Behavioral */
/* Research, 24, 365-395. */
/* --- */.
set mxloops=10000.
matrix.
compute r_eigen=make(!NItems,2000,0).
loop i=1 to 2000.
+ compute U1 = uniform(!NCases,!NItems).
+ compute U2 = uniform(!NCases,!NItems).
+ compute X = make(!NCases,!NItems,0).
- loop l=1 to !NItems.
+ compute x(k,l)=sqrt(-2*ln(U1(k,l)))*cos(8*artan(1)*U2(k,l)).
- end loop.
+ end loop.
+ compute D=X-(Make(nrow(x),1,1)*(CSum(X)/nrow(x))).
+ compute S=SSCP(D).
+ compute R=mdiag(1/sqrt(diag(S)))*S*mdiag(1/sqrt(diag(S))).
+ compute r_eigen(:,i)=eval(R).
end loop.
compute rnd_eig=rsum(r_eigen)/ncol(r_eigen).
print rnd_eig
/title "Random Eigenvalues:".
end matrix.
!EndDefine.
/* --- */.
/* The macro is called by: */.
/* */.
/* RanEigen NItems = number of variables */.
/* /NCases = number of cases/tamanho da amostra */.
/* */.
/* --- */.
SET SEED=12345.
APPENDIX
APPENDIX
APPENDIX
APPENDIX
3
3
3
3
T
T
T
T
HOMPSON HOMPSON HOMPSON HOMPSONS
S
S
S
YNTAX YNTAX YNTAX YNTAXH
H
H
H
IERARQUICAL IERARQUICAL IERARQUICAL IERARQUICALS
S
S
S
TRUCTURETRUCTURETRUCTURETRUCTUREsubtitle '5 n=1000 Faculty ^^^ first-order ^^^^^' .
execute .
temporary .
select if (ranktype eq 3) .
factor variables=var_0014 to var_0028/
analysis=var_0014 to var_0028/criteria=factors(3)/
extraction=pc/rotation=promax/
print=all/save=reg(all reg-pc)/ .
subtitle '6 second-order $$$$$$$$$$$$$$$$$$$$$$$'.
execute.
factor variables=mean_1 to mean_3/