Analysis of Psychometric Properties of the Cube Test
to Evaluate Visuospatial Reasoning
Análise das Propriedades Psicométricas do Teste dos Cubos:
Para a Avaliação do Raciocínio Visuoespacial
Monalisa Muniz
,a, Fabián Javier Marín Rueda
b& Juliana Carnevalli Siqueira Nery
baUniversidade Federal de São Carlos, São Carlos, São Paulo, Brasil
& bUniversidade São Francisco, Itatiba, São Paulo, Brasil
Resumo
O objetivo da pesquisa foi contribuir com novas informações acerca das evidências de validade do Teste dos Cubos. Mais especifi camente, analisaram-se as propriedades psicométricas dos itens por meio da Teoria de Resposta ao Item, e a estrutura do teste utilizando a Análise Fatorial Confi rmatória. A amostra foi composta por 684 sujeitos, com idade média de 21,3 anos (DP=5,94), sendo 50,3% feminino. Nos resultados, as análises realizadas pela Teoria de Resposta ao Item corroboraram o ajuste dos itens ao modelo, enquanto a Análise Fatorial Confi rmatória apontou o modelo com dois fatores como sendo o mais adequado. Os dados encontrados, além de oferecerem resultados favoráveis sobre o instrumento, sustentam as evidências de validade contidas no manual do Teste dos Cubos.
Palavras-chave: Raciocínio, processamento visual, análise fatorial confi rmatória, teoria de resposta ao item, teste psicológico.
Abstract
The objective of the present research was to contribute with new information regarding the validity evidence of the Cube Test. More specifi cally, psychometric properties of the items were analyzed through the Item Response Theory (IRT) and the test structure was analyzed using Confi rmatory Factor Analysis (CFA). The sample was composed of 684 subjects, with a mean age of 21.3 years (SD = 5.94) and 50.3% were female. Results showed that IRT analyses confi rm the adjustment of the items to the model, whereas the CFA suggested that a two-factor model was the most adequate. The fi ndings, besides offering favorable results about the instrument, supported the validity evidence present in the Cube Test manual.
Keywords: Reasoning, visual processing, confi rmatory factor analysis, item response theory, psychological test.
Mailing Address: Universidade Federal de São Carlos, Departamento de Psicologia, Rod. Washington Luis, km 235, São Carlos, SP. Caixa Postal 676, CEP: 13565-905, telefone (16) 3351-8361. Email: mo_nascimento@ yahoo.com.br
The construction of psychological tests is one area of psychological assessment that is increasing in Brazil. In recent years, practitioners have shown a greater awareness to the importance of how the tests are constructed and supported by the characteristics of the population that will be submitted to these tools. As noted by Urbina (2006), to construct a test, one must fi rst have an objective – a theoretical foundation that supports the construct which will be assessed – as well as knowing which population the instrument will aim to evaluate. Further, the existence of a variety of psychological tests to assess the same construct facilitates the work of the psychologist, because the profes-sional will be able to verify which test is most appropriate for a given subject, population and purpose.
In an inquiry conducted by the Psychological Testing Evaluation System (Satepsi) in 2011, no instrument was found with the assent of the Federal Council of Psychology that could specifi cally measure visuospatial reasoning. The measure of this construct is found in a battery of tests, such as Reasoning Battery Tests – BPR-5 (Primi & Almeida, 2000), applied together with other subtests that assess different types of reasoning. However, it is intriguing that the psychologist could also have the option of a test that addresses only the visuospatial reasoning, as well as a manual that contemplates information and more detailed studies of this construct.
This model conceives intelligence as a multidimensional construct that encompasses various capacities, which in turn are all linked to a general factor.
Initially, ten abilities integrated the CHC model, name-ly, fl uid intelligence (Gf), crystallized intelligence (Gc), quantitative reasoning/knowledge (Gq), reading-writing ability (Grw), short-term memory (Gsm), visual pro-cessing/intelligence (Gv), auditory processing/intelligence (Ga), long-term storage and retrieval (Glr), processing speed (Gs), and decision speed/reaction time (Gt). Since 2009 six other abilities were gradually incorporated into the model: those were general (domain-specifi c) knowledge (Gkn), psychomotor speed (Gps), the psychomotor abili-ties (Gp), olfactory abilities (Go), tactile abilities (Gh) and kinesthetic abilities (Gk; McGrew, 2009). With regard to the last six, though some are not yet well established, the chapter described by Schneider and McGrew (2012) notes that research is being developed and, besides approaching updates to the CHC theory, reaffi rms the existence of the abilities.
Considering the Cube Test, visuospatial reasoning contained in it is mainly grounded in the construct Gv. Schneider and McGrew (2012) describe that Gv can be better understood by the skills of Visualization (Vz), Speeded Rotation/Spatial Relations (SR), Closure Speed (CS), Flexibility of Closure (CF), Visual Memory (MV), Spatial Scanning (SS), Serial Perceptual Integration (PI), Length Estimation (LE), Perceptual Illusions (IL), Percep-tual Alternations (PN) and Imagery (IM).
Of these eleven skills, the items built into the Cube Test relate mainly to the skills Vz, SR and SS. The ability
Vz requires that the individual can imagine, manipulate or transform objects or visual patterns mentally, indepen-dent of the processing speed of the response. In addition, subjects also must provide, visualizing mentally, how a particular object would be after a few alterations, for example, when parts of an object are rearranged, removed or relocated to other parts of that object. In turn, SR refers to the ability to perceive and manipulate objects or visual patterns, also mentally, but quickly, by mental rotation or transformation. Thus, in this ability it is important to be able to identify objects at different angles and posi-tions with agility, because the fl uency of identifi cation is required. It is worth highlighting that identifi cation is the main difference between Vz and SR. Ability SS requires the subject to explore a broad or visually confusing fi eld quickly and accurately to identify objects or images. Therefore, in the implementation of the Cube Test, the successful individual will be able to imagine the suggested rotation, mentally manipulate the cube quickly and accu-rately, without being confused by other stimuli and, at the end of this activity, temporarily hold the image obtained, comparing it with stimuli suggested in the alternatives to fi nd the correct item.
Reasoning is a crucial activity of thought and is present in its whole structure (Wilhelm, 2005). As described by Vinod Goel (2005), reasoning is a cognitive activity that
allows derivation from information provided, involving deductions based on one or more premises that provide some information to accept another proposition, which is the conclusion. Goel’s explanation refers to the ability of fl uid intelligence (Gf), which is the mental operations of reasoning that the individual performs when faced with new situations that cannot be automatically performed, and which depend minimally on acquired knowledge. For Schneider and McGrew (2012), these operations involve relating ideas, inducing abstract concepts and solving problems, using mainly inductive and deductive reason-ing. Some psychological tests are proposed for evaluating a particular type of reasoning, as in the case of the Cube Test in assessing the visuospatial reasoning. However, these same instruments can encompass other types of rea-soning, as well as other abilities beyond the visuospatial. This is consistent with Schneider and McGrew (2012), who highlight that fl uid intelligence covers inductive and deductive reasoning.
In the Cube Test, visuospatial reasoning can also be related to the ability of fl uid intelligence, as in task reso-lution, wherein the subject will deal with new situations, minimally dependent on prior knowledge and seeking relationships within the contained information. In turn, inductive reasoning is a factor of fl uid intelligence and refers to the ability to analyze a set of information and es-tablish relationships within the set, creating new ideas and concepts, systematically organizing the information (Primi, 2002). Within the items of the Cube Test, it is necessary to discover the relationship between colors and position changes, in order to reach the correct answer, resulting in inductive reasoning.
Although deductive reasoning can also be a factor of fl uid intelligence, is not present in the Cube Test. To Holyoak and Morrison (2005), the differences between the two types of reasoning are subtle and emphasize conclusions from some initial assumptions. For these authors, an inference is deductive if the truth of the premise guarantees the truth of the conclusion by virtue of the form of the argument. But if the true premise does not guarantee reliable conclusions, the inference is called inductive. In the Cube Test, the premise is related to mental rotations, that is, it informs the subject that he needs to fi gure out how the cube will appear after one, two or three rotations. The correct response, which is part of a set of alternatives already stipulated, is not the only possible confi guration of the cube after the rotations, but on the test it is, because the other alternatives are incorrect.
(Flanagan & Ortiz, 2001) and is present in other abilities. Thus, to more specifi cally evaluate a certain ability, one can resort to the content, format, and task instructions that outline the type of reasoning to be employed in resolving them. To assess visuospatial reasoning through the Cube Test, items were created for which concrete images must be mentally manipulated to fi nd the correct response. This content (images), format (cubes), and instruction (to men-tally manipulate) to the test items requires the evaluated subject to predominantly utilize visuospatial reasoning. In the work of Primi, Cruz, Nascimento and Petrini (2006), we see the construction of a fl uid intelligence test that sought to specifi cally assess the simultaneous coordina-tion of tasks and selective attencoordina-tion/abstraccoordina-tion. For this, geometric shaped items were systematically constructed seeking to control the amount of irrelevant information and perceptual organization, that elements that are used to assess, respectively, the cited factors coordination and attention. To solve the tasks the subject must discover the underlying rule in a set of geometric fi gures.
Rueda and Muniz (2012) have generated two factors for the Cube Test, understood as one factor containing easier items, and a second factor with more diffi cult items. Despite being a test of visuospatial reasoning, other abilities that tend to be a subtle part of reasoning may have contributed to the study of internal structure contained in the test manual. The complexity of the items, which gradually increases from Item 1 through Item 15, further endorses the emergence of the factors, such as the increasing demand for the use of cognitive resources and, consequently, the visuospatial reasoning is not identical in the resolution of easier items and more diffi cult items. It is emphasized that the manual presents studies of its internal structure through the exploratory factor analysis by the Classical Test Theory, and by analyzing full information factor analysis (FIFA) based on Item Response Theory.
Considering the above so far, and especially the fact that the test was designed to measure visuospatial reason-ing, fi nding unidimensionality would be expected. How-ever, as already noted, other types of reasoning and abilities may be present, which makes it more diffi cult to achieve unidimensionality. Even the Raven’s Coloured Progressive Matrices (CPM), which measures the eduction of relations (similar to fl uid intelligence), has always been understood as unidimensional, though there are no studies that sug-gest unidimensionality. Two studies conducted in Brazil showed that the CPM tended to measure more than one dimension. The work of Pasquali, Wechsler and Bensusan (2002), found four factors, but at such a secondary level of as to indicate unidimensionality. Likewise, the study of Sisto, Rueda and Bartholomeu (2006), did not detect unidimensionality. Thus, it is important to do more studies seeking to investigate this question of structure.
Within this context, and seeking to further investigate the Cube Test, the objective of this study was to contribute
new information about the validity evidence of the instru-ment. The main analysis is on test structure, seeking to verify whether the structure of the two factors found by the test manual authors stands in light of new data from a sample differing from the normative. Additionally, the adjustment and the diffi culty of items has been studied, the item-theta and item-total correlation, and the accuracy, in order to compare data obtained from this research with the studies described in the test manual.
Method
Participants
The study includes 684 participants, high school and college students from both public and private institutions in the state of Minas Gerais. Of the total, 344 were female (50.3%). The mean age was 21.3 years (SD = 5.94), with a minimum age of 15 and maximum of 57. Of the total, 58.5% have incomplete higher education, and majors included Engineering (13.3%), Digital Game Design (11.5%), Psychology (13.2%), Life Sciences (11.8%) and Languages (8.6%); while 41.5% had incomplete secondary education, with 29.1% in the 2nd year and 12.4% in the 3rd
(and fi nal) year. The study sample was by convenience. It is emphasized that the Cube Test manual sample was also by convenience, but prioritized participants who at-tended college and majored in topics such as engineering, architecture and aerospace, which tend to demand a greater capacity for visuospatial reasoning. The present study, although with the participation of subjects in engineering and digital game design courses, had no such concern because the goal was not to verify differences between types of professions.
Instrument
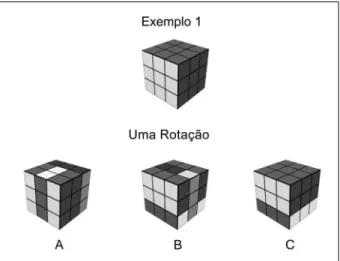
Cube Test: To Assess Visuospatial Reasoning (Rueda & Muniz, 2012). The objective is to assess visuospatial reasoning in subjects between ages 18 and 66 years, of both sexes, conforming to the standardization in the manual. The test consists of 15 tasks: Items 1 through 8 have three choice alternatives, and Items 9 through 15 have four alternatives. Each task includes a cube design, like a “Rubik’s Cube”, and the subject must ascertain how the cube would appear after one, two or three rotations. The subject selects one option from the alternatives, each with its own cube design, with only one being the correct answer. Figure 1 is an example of the test.
Figure 1. Test example of cubes taken from the manual with permission of the authors of the test (Rueda & Muniz, 2012).
The test manual testing contains the analyses of psy-chometric properties effected through Item Response Theory and demonstrates satisfactory fi t indices and item diffi culty of the Cube Test. Validity evidence of the inter-nal structure is also presented, suggesting two moderately correlated factors and interpreted as assessing the same construct, which is visuospatial reasoning. Also related to the internal structure, there is information for Differential Item Functioning, DIF, suggesting that the items have a similar statistical behavior depending on the gender of the participants.
Validity evidence based on relations with external variables are also contemplated. Age and gender were external criteria and a decline in visuospatial reasoning was observed as age increased, as well as better performance by males. The university major was also an important criterion and students of Engineering and Architecture performed better. Finally, the validity evidence with tests that measure similar constructs was found with the Spatial Reasoning Test of the Battery of Reasoning Tests – BPR-5 (Primi & Almeida, 2000). All results of validity evidence are consistent with those indicated in the literature on the visuospatial reasoning construct.
With regard to accuracy, a coeffi cient of .80 was ob-tained by means of Cronbach’s alpha, .84 by Spearman-Brown, and .83 by Guttman. All indices were considered highly satisfactory.
Procedure
Initially, contact with educational institutions was made, to explanation the research and request permission to collect data. After institutional authorization, the project was submitted to and approved by the Ethics in Research Committee (CEP).
After approval, again the institutions were contacted to schedule data collection. Before collection, high school students were given the Terms of Free and Clear Consent (TCLE) to take their guardians to read and, if they agreed,
to sign. For higher education students, everyone being 18 years of age or older, they were given the TCLE consent form to read and sign on the day of data collection. Only students with signed consent forms participated in the survey. Data collection was conducted in group sessions of about thirty minutes on the premises of each educational institution.
Data Analysis
The psychometric properties of the test items were analyzed by Item Response Theory, through the Rasch model, using the program Winsteps (Linacre, 2005), with the purpose of verifying the accuracy of the instrument, the item-theta correlation, the item diffi culty, and the adjust-ment of the items in relation to the scale. Regarding the adjustment, the outfi t and infi t were evaluated. The outfi t refers to the average of the settings of the items: this pa-rameter is more sensitive to outliers, wherein the misalign-ment of the item or discrepancy occurs in contradiction to skill level. That is, the cases of outfi ts refer to situations in which the subject does not ascertain items that fall within their ability, or conversely, ascertains correct answers for items outside the subject’s ability. In turn, the infi t is also a measure of item misfi t, being related to discrepancies near the skill level of the subject, that is, the subject does not ascertain the items near his/her skill level (Wright & Stone, 2004). With regard to the expected values, it is desirable that the accuracy is at least .60, the item-theta correlation is at least .30, and the adjustments at most 1.2 – the latter according to Wright and Stone (2004), though Linacre (2002) contends adjustments to 1.5 are acceptable. As for the diffi culty indices, values near zero are considered aver-age diffi culty; much below are considered very easy, and high above are very hard. It is emphasized that the Cube Test manual used the Item Response Theory through the Rasch model to perform the psychometric analyzes of the test items. As the present study also aims to compare the data contained in the manual with the present research, it was deemed appropriate to maintain the same type of analysis.
The confi rmatory factor analyses were conducted in the Mplus program (Muthén & Muthén, 2010a), through a tet-rachoric matrix, using the estimation method of Weighted Least Squares Mean and Variance-Adjusted (WLSMV), specifi c to dichotomous data (Muthén & Muthén, 2010b). Two adjustment models were tested, the fi rst following the division of two latent factors found through exploratory factor analysis. This model was assumed in the test manual and covers a factor with the easiest items (item 1-9), and another factor with the most diffi cult items (item 10-15), but assessing the same construct. The second model tested a general latent factor with the measures of visuospatial reasoning, where the 15 items carried in a single dimen-sion, expecting the existence of unidimensionality, since theoretically the Cube Test evaluates only a construct.
Root mean square error of approximation(RMSEA), Com-parative Fit Index(CFI) and Tucker-Lewis Index (TLI). For χ2/df, values less than 3 indicate models adjusted to the sample; for the RMSEA values between .06 and .08 (with confi dence interval below .10) indicate low levels of residuals; and for the CFI and TLI, values above .90 indicate fi t (Brown, 2006; Byrne, 2010; Schreiber, Stage, King, Nora, & Barlow, 2006).
In addition, the reliability of the factorial structures was evaluated by the Composite Reliability method, which evaluates the reliability of indicators of the determined construct through the specifi c variance of items in rela-tion to the measurement error (Fornell & Larcker 1981). Reliability values above .60, and preferably greater than .70, suggest adequacy of the model (Fornell & Larcker, 1981; Marôco, 2010).
Other data obtained was the variance of the factors as-sessed by the average variance extracted test (AVE; Fornell & Larcker, 1981; Marôco, 2010), which is the variance of indicators explained by the latent factor in relation to the variance due to measurement error (Marôco, 2010). Factors with greater than .50 AVE are adequate, since the latent construct explains more than half of the variance of the observed variables (Dillon & Goldstein, 1984; Fornell & Larcker, 1981; Hair, Anderson, Tatham, & Black, 1998; Marôco 2010).
Unlike the initial analysis of the psychometric prop-erties of the items, which maintained the same type of analysis, for the study of the test structure it was decided to test the model found by the manual’s authors, using the estimation method of Weighted Least Squares Mean and Variance-Adjusted (WLSMV), specifi c for dichotomous data (Muthén & Muthén, 2010b). In the Cube Test manual, there are two types of exploratory factor analysis, one conducted by using SPSS 11.5 (Statistical Package for the Social Sciences, 2002) based on Classical Item Theory and the other by Testfact based on TRI. In this case, the comparison between the data in the test manual and the present study is limited, but there is the possibility to test the proposed structure and verify that it maintains, even with other forms of analysis.
Results
Seeking to verify if the psychometric parameters of the Cube Test remain acceptable, an analysis was done of the items by the Rasch model. Table 1 presents the information related to the diffi culty of the items, infi t and outfi t values, the item-theta and item-total correlations. For comparison purposes, there are two columns for each psychometric property – the column in plain typeface presents the data in the manual, while the column with variables highlighted in bold refers to the data from current research.
Table 1
Psychometric Properties of the Items by the Rasch Model
Item Diffi culty Diffi culty Infi t Infi t Outfi t Outfi t Item-total Item-total Item-theta
15 2.09 2.77 1.07 1.00 1.38 1.70 .24 .24 .47
14 1.59 2.50 1.04 .88 1.19 1.12 .20 .28 .54
13 1.55 2.35 .96 .89 1.05 .90 .29 .34 .56
11 1.27 1.85 1.01 .81 1.07 .83 .27 .32 .61
12 .97 1.80 1.00 .98 1.09 1.03 .37 .32 .53
10 .95 1.34 1.04 .92 1.07 .95 .37 .30 .57
9 .92 .97 .96 1.00 1.08 1.14 .44 .37 .53
8 .34 -.12 1.03 .95 1.07 1.23 .30 .30 .52
6 -.34 -.84 .93 1.03 1.00 1.62 .37 .37 .44
5 -.90 -1.51 1.01 .91 1.09 .94 .30 .37 .48
7 -1.02 -1.12 .82 .75 .71 .63 .32 .44 .59
4 -1.11 -1.87 1.03 1.07 .95 1.35 .32 .27 .35
3 -1.32 -2.00 .98 1.16 .90 1.72 .34 .29 .29
2 -2.40 -2.74 .94 1.17 .97 2.06 .28 .20 .21
1 -2.58 -3.39 .96 1.12 1.07 1.53 .24 .24 .20
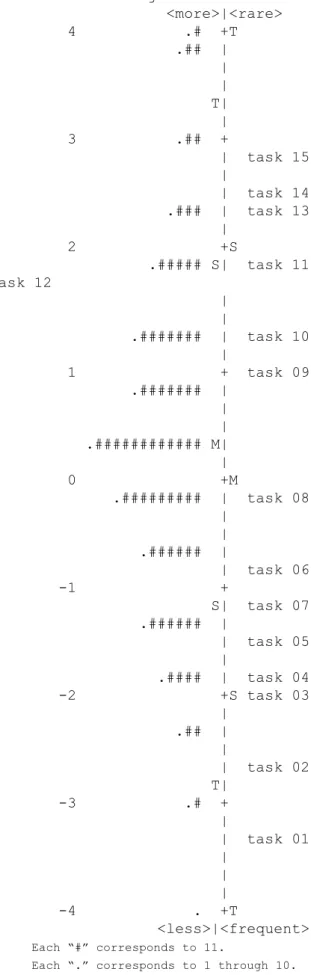
The results showed that four items presented unac-ceptable values ranges relative to outfi t, which according Linacre (2002) is between .70 and 1.50. The remaining items proved fi t, as in the study contained in the manual. In relation to infi t, all items show acceptable value ranges, both those in the research and those in the manual. With regards to item diffi culty, it is noted that the degree of dif-fi culty sequence is similar to that identifi ed in the manual. However, in the manual, item 5 tested with a higher level than 7. An interesting observation in this study sample is that, comparing the level of diffi culty of each item, up to item 9 the diffi culty levels are higher than the manual study, yet, from item 8, are smaller. Finally, with regard to the item-total correlation, it is observed that, as in test manual, all values were greater than .20. By comparing the data, it can also be observed that there was a balance between the two studies, that is, some items had higher values in the test manual, while others showed higher correlations in the present study. In Figure 2 the item representation can be seen on a scale from the most diffi cult to the easiest.
Figure 2 shows that the average ability of the subjects (letter ‘M’ on the left side of the fi gure) was slightly higher than the average diffi culty of the items (letter ‘M’ on the right side of the fi gure). This result was also found in the analysis conducted for the manual. Even item-theta cor-relations – except for items 1, 2 and 3 – were adequate. In the test manual information was used through the TCT of item-total correlation, similar to the item-theta correlation. The data contained in the manual were also adequate, hav-ing as parameter the values highlighted by the American Institutes for Research that establishes the value of .20 as a good indicator of item discrimination. Finally, the accuracy obtained through the Rasch was .72, through the TCT was .77, both deemed adequate, as well as the accuracy in the manual, which obtained .80 through Cronbach’s alpha.
With regard to the internal structure, in the Cube Test manual a two-factor structure is presented, verifi ed both by factorial analysis of the Classical Test Theory, and by the full information factor analysis (FIFA) based on the TRI. It is understood that this division resulted from the item diffi culty, since in the fi rst factor are items with lower diffi culty and featuring three response alternatives, while the second factor encompassed the more diffi cult items with four response choices, in addition to the item requir-ing three – not two – rotations of the fi gure to ascertain the correct response (Rueda & Muniz, 2012).
The greater complexity observed in the items of the second factor, just by increasing the number of alternatives and rotations to be considered, tends to require greater demand for cognitive resources, such as further developed working memory to store and operate the information per-taining to visuospatial reasoning with three, instead of one or two, rotations. However, all test items have the same content, fi gure type, and necessity of visuospatial reasoning to solve the task. Thus, independently of the two factors, the test assesses visuospatial reasoning, given that the second factor would be evaluated just as some specifi city of this construct (Rueda & Muniz, 2012).
Subjects - MAP - Item <more>|<rare> 4 .# +T .## | | | T| | 3 .## +
| task 15 |
| task 14 .### | task 13 |
2 +S
.##### S| task 11 task 12
| |
.####### | task 10 |
1 + task 09 .####### |
| | .############ M| | 0 +M
.######### | task 08 |
| .###### |
| task 06 -1 +
S| task 07 .###### |
| task 05 |
.#### | task 04 -2 +S task 03 |
.## | |
| task 02 T|
-3 .# + |
| task 01 |
| | -4 . +T
<less>|<frequent>
Each “#” corresponds to 11.
Each “.” corresponds to 1 through 10.
Table 2
Factor Loadings, Standard Errors and Signifi cance Values for the Two-Factor Model
Variables
Factor loadings
Standard
errors p-value Factor I Factor II
V1 V2 V3 V4 V5 V6 V7 V8 V9 V10 V11 V12 V13 V14 V15 .247 -.232 -.292 -.468 -.502 -.704 -.634 -.980 -.724 -.638 .728 .786 .918 .928 .828 .057 .088 .080 .070 .066 .043 .045 .034 .038 .043 .037 .033 .023 .022 .029 .000 .008 .000 .000 .000 .000 .000 .000 .000 .000 .000 .000 .000 .000 .000 Recognizing the presence of just one construct in the two factors, the test can also be considered a measure for evaluating a general dimension, which is visuospatial reasoning. Thus, we sought to verify by means of confi rmatory factor analysis, whether the one-factor model was more adequate than the two-factor model. So, initially we proceeded to the analysis with the two-factor model, as described in the manual, followed by the one-factor model, comprised of all test items. Tables 2 and 3 present the factor loadings, standard errors and signifi cance values of the factor loadings for two-factor and one-factor models, respectively.
For Factor I a composite reliability of .445 and the average variance extracted of .339. In Factor II, the values achieved were .701 and .657, respectively. The values of composite reliability for Factor I were lower than expected, and acceptable for Factor II. The average variance extracted showed suitable only for Factor II. The correlation between the factors was -.074 (p <.001).
In the structure with one factor the composite reliability index showed .466 and the average variance extracted of .369. Both values are lower than expected. Regarding the fi t indices for both models tested, these can be seen in Table 4.
Table 3
Factor Loadings, Standard Errors and Signifi cance Values for the One-Factor Model
Variables Factor loadings
Standard
errors p-value
V1 V2 V3 V4 V5 V6 V7 V8 V9 V10 V11 V12 V13 V14 V15 .158 -.145 -.184 -.324 -.376 -.579 -.487 -.814 -.610 -.596 -.677 -.738 -.890 -.910 -.786 .052 .083 .071 .066 .063 .043 .046 .032 .039 .039 .035 .032 .024 .022 .030 .002 .080* .009 .000 .000 .000 .000 .000 .000 .000 .000 .000 .000 .000 .000
Note. *Insignifi cant factor load.
Table 4
Fit indices for Both Models Tested by the Cube Test
Models evaluates Fit indices
2 gl 2/gl RMSEA (90% IC) CFI TLI
One-factor model 632.198 90 7.02 .094 (.084 – .101) .86 .84 Two-factor model 223.443 89 2.51 .047 (.039 – .055) .96 .96
Considering the fit indices, the two-factor model showed acceptable values while the one-factor model showed all indices lower than expected (Brown, 2006; Byrne, 2010; Schreiber et al., 2006).
Discussion
The main objective of the study was to verify whether the internal structure with two factors of the Cube Test, presented in the manual, would remain with data analysis from another sample, using the Confi rmatory Factor Analy-sis. In addition, we did a comparison of results obtained using the TRI between this sample and the manual data. The purpose of these objectives was to contribute new information about the validity evidence of the Cube Test, approved for use by professional psychologists.
In the analyses conducted through TRI, indices of dif-fi culty, fi t, and item-theta and item-total correlation were conducted. The diffi culty of the items followed an upward pattern, with ending items having greater diffi culty than the initial items, following a sequence very similar to that contained in the manual. The difference was that in this study, item 7 is easier than item 6, and in the manual it is easier than items 6 and 5. Despite this diffi culty inversion among items, the results are consistent with those proposed in the construction of the Cube Test, which requires a more complex ability to use visuospatial reasoning for each test item, especially when increasing the number of rotations to be mentally visualized in representing the fi nal object (Rueda & Muniz, 2012). For example, in items 1, 2, 3, one must imagine the cube and rotate it once to get to the correct answer. The ability of Speeded Rotation/Spatial Relations is necessary so that the subject can mentally manipulate the cube, quickly (since there is a time limit). Moreover, the mental rotation for the fi rst three items is less complex than when this same subject must mentally manipulate the object, but doing two (items 4, 5, 6, 7, 8, 9, 10 and 11) or three rotations (items 12, 13, 14 and 15). Still, specifi c to the diffi culty inversion of items 6 and 7, one might consider the necessity of reversing the order of these test items.
The diffi culty indices, both in the manual and in the current study showed balance between easy, medium and diffi cult items. However, from item 10 onward, in this study there were higher levels of diffi culty than in the study within the manual. This might have happened, justifi ably, because the manual study was composed, in its majority, by student majoring in fi elds that tend to attract subjects with more developed visuospatial reasoning (architecture, engineering and aeronautics training). Thus, they tend to present a skill level closer to, or in some cases higher than, the diffi culty level of the items.
Despite this fact, in the two samples it can be verifi ed that, in general, the subject’s ability was slightly greater than the item diffi culty, which can be considered similar. But this is a result that shows the average diffi culty and
ability, and does not mean that the test is easy, since the average score was 7.96, or half the test. Analyzing the cases individually, we identifi ed that most people tended to choose correctly on the fi rst 8 items, but missed the others, and many fail to reach the end of the test, given the time limit of 30 minutes.
With regard to the item-theta correlations, with the exception of items 1, 2 and 3, all others were within the acceptable standard, above .30, and item 3 reached .29. The TRI data obtained in this study endorse the psychometric quality of the Cube Test items. About the accuracy of the test, it can be noted that indices remained adequate, .72 by TRI and .77 by Classical Test Theory, both compatible with the manual.
After analysis of the psychometric properties of the Cube Test items, Confi rmatory Factor Analysis was ap-plied. As can be seen, the two-factor model showed better fi t quality, with all indices, as expected. The fi rst factor is comprised of items 1, 2, 3 and 4, 5, 6, 7, 8 and 9, and the second factor covers items 10, 11, 12, 13, 14 and 15. However, the composite reliability values and average variance extracted were lower than expected for the fi rst factor, which tends to be an indication that the factor can be improved. The factor loadings of the fi rst three items, taken from the same factor, contribute to this statement, as they are below .30. Furthermore, the correlation between Factor I and II was signifi cant, but low.
The fi rst three items of the Cube Test seem to contribute to the fact that Factor I is not as robust as Factor II.
Considering that on these fi rst three items, one arrives at the correct response after employing only one rotation of the cube as stated, the subject tends to ascertain them without much demand for visuospatial reasoning, but by simply inferring that, when compared to the stimulus cubes, the correct alternatives exhibit little color variation while the larger color variation occurs on incorrect cubes. For example, with only one rotation, the colors of the cube faces on the correct choice must vary little from the stimulus cube, so alternatives with very different color ar-rangement compared to the stimulus cube are automatically eliminated. In contrast, from items 4 and 12, for which the correct response requires thinking through two and three rotations, respectively, only analyzing the arrangement of colors does not help, since the cube face color changes of all alternatives are greater. This makes the visuospatial reasoning essential to seek the correct alternative.
which assess reasoning, also defi ne the diffi culty of the task. These complexity factors that are the attributes of the items can be number of elements, number and type of transformations, and perceptual organization of the stimulus. Considering that from item 9 onward, there are four alternatives and from item 12 onward it is necessary to use three rotations, we observe that the cognitive demand for the items of Factor II is greater and may involve skills not required for the items of Factor I. One example of the constitution of a factor by the items’ complexity can be seen in the work of Primi et al. (2006), which, in investigat-ing the internal structure of a fl uid intelligence assessment test through items of simultaneous task coordination and selective attention/abstraction, found three factors, one of them comprised by only the most diffi cult test items. These authors realized that the complexity of the items composing this factor resulted from irrelevant information contained in the items’ content and tended to require more selective attention, fl exibility and attention control.
The argument of the item complexity used by the authors in Cube Test manual, on the two-factor structure of the test, is consistent with the research of Primi et al. (2006). Likewise, the understanding of the Cube Test structure presented in the current work tends to reaffi rm the prevalence of visuospatial reasoning as primary con-struct measured by the test, as indicated in the Cube Test manual. The items and the action that the subject must perform to respond to the instrument require visuospatial reasoning. All items and alternatives are cubes, the task is to encode the images of a cube (item) and fi nd, among 3 or 4 alternatives, which is the correct image after rotating the item (Cube) once, twice or three times.
As can be seen, between one item and another the difference is the structure of the cube, represented by the array of colors of each face, besides the varying quantity of rotations that must be effected to fi nd the correct answer, and the number of alternatives. In addition, all items were constructed based on the need to use visuospatial reason-ing, more specifi cally, the ability of Visualization (to men-tally manipulate objects and be able to predict how they appear after a reorganization), Speeded Rotation/Spatial Relations (to manipulate objects quickly and using mental rotation and to identify objects in different positions) and Spacial Scanning (scanning, exploration, or visual search of an indicated path). On the Cube Test the subject must manipulate the fi gure and predict how it would appear (Visualization), rapidly using mental rotation as required in the task (Speeded Rotation/Spatial Relations), given that to do this the subject scans and searches the reorganization of colors from the rotation (Visual Scanning). All items require these abilities to be solved, and as such, one can say that the instrument measures the visuospatial reasoning.
These particularities of the items require the reasoning to be, aside from visuospatial, more complex and may also require other cognitive abilities such as working memory (Rueda & Muniz, 2012). As indicated by Primi (2002),
more complex items of perceptual organization require the attention control processing of selective attributes or elements, having in view the association of these selec-tive encoding and abstraction processes, given that visual processing is also required.
In the case of the Cube Test, since there is visual pro-cessing, using some visuospatial abilities that, together with the complexity of items, also tends to overwhelm working memory, which is temporary warehouse for stor-age of information that can be accessed, manipulated and reorganized to be used in some task (Malloy-Diniz, Sedo, Fuentes, & Leite, 2008). Thus, in the more diffi cult items there is a larger quantity of information to be rearranged to arrive at the correct answer, which may be an important variable contributing to the formation of another factor.
This analysis, more cognitive of the understanding of the test items’ structure, is very important, because establishing reasoning ability measures is diffi cult, and the construction is generally directed by the application of psychometric criteria, that is, items are constructed, applied to a sample and parameters are verifi ed, such as correlation and factor structure, and from this the test is concluded to be “good or not,” often without analyzing the psychological sense of the data. In truth, the construction should be guided by indicators strictly based on theories, derived from a cognitive model of the thinking process (Wilhelm, 2005).
The Cube Test was also cognitively grounded for the items’ construction, seeking to understand which cognitive functions were present together with visuospatial reason-ing. Therefore, the non-confi rmation of unidimensionality is understandable, and the factors that emerged in this study and the manual mean that a more cognitive response process is very relevant to understanding the test structure. The statistical analyses and procedures amplify the scien-tifi c merit and quality of the psychological instruments, but the theoretical understanding and qualitative analysis of cognitive processes should be considered as much as the psychometric.
Both methods, psychometric and cognitive-experi-mental, should be used together because the benefi ts are mutual. Differences in the correlations between items of reasoning used in cognitive research, and the latent vari-ables of the ability test, can reveal important differences between the experimental tasks, as well as the variability of the differences of the items in psychometric reasoning tests may possibly be explained by the application of vari-ous reasoning process theories, like the theory of mental models (Wilhelm, 2005).
each of them. After the construction of test, items for each paradigm which presupposed different forms of inductive reasoning, the structure was tested, and only two factors were identifi ed. The factors correlated moderately and the authors opted to consider the unidimensionality, because analyzing the items, all demanded inductive reasoning and utilization of the proposed paradigms.
The results presented here reinforce the quality of the Cube Test and increase the number of empirical studies concerning the validity and accuracy of the test. It also shows that good results are maintained in a different sample than the study in the manual, and contributes to confi dence in the greater use of this instrument for the Brazilian population. Even so, it is recommended that more studies be conducted with other samples from different regions of the country, and to continue to seek an increasingly robust understanding of the test structure.
Indeed, the test structure is the part that deserves fur-ther study to understand the multidimensionality found in the manual study and this research. It is necessary to investigate which other skills are demanded together with the visuospatial reasoning, which causes the test to be more than unidimensional. The complexity of the items, the quantity of alternatives and rotations required are variables that affect the formation of the test structure, but if there is such an infl uence, it is because these variables also tend to require different cognitive elements beyond the visuospatial abilities reported herein. This exploration of the cognitive demands of the Cube Test is even more important to be able to identify the cognitive processes used by the subjects and, thus, also contributes to a better understanding of the strengths and weaknesses in the test, and those that the subject needs to develop to improve their performance.
References
Almeida, L. S., Nascimento, E., Lima, A. O. F., Vasconcelos, A. G., Akama, C. T., & Santos, M. T. (2010). Bateria de Provas de Raciocínio (BPR-5): Estudo exploratório em alunos uni-versitários. Avaliação Psicológica, 9(2), 155-162.
Brown, T. A. (2006). Confi rmatory factor analysis for applied research. New York: The Guilford Press.
Byrne, B. M. (2010). Structural equation modeling with MPLUS: Basic concepts, applications, and programming. New York: Routledge, Taylor, & Francis.
Carrol, J. B. (1997). The Three-Stratum Theory of Cognitive Abilities. In D. P. Flanagan, J. L. Gensheft, & P. L. Harrison (Eds.), Contemporary intellectual assessment: Theories, tests and issues (pp. 122-130). New York: The Guilford Press. Dillon, W., & Goldstein, M. (1984). Multivariate analysis:
Methods and applications. New York: Wiley.
Flanagan, D. P., & Ortiz, S. O. (2001). Essentials of cross-battery assessment. New York: John Wiley & Sons.
Fornell, C., & Larcker, D. F. (1981). Evaluating structural equa-tion models with unobservable variables and measurement er-ror. Journal of Marketing,18(1), 39-50. doi:10.2307/3151312
Goel, V. (2005). Cognitive neuroscienceof deductive reasoning. In K. J. Holyoak & R. G. Morrison (Eds.), The Cambridge handbook of thinking and reasoning (pp. 475-492). New York: Cambridge University Press.
Hair, J. F., Jr., Anderson, R. E., Tatham, R. L., & Black, W. C. (1998). Multivariate data analysis (5th ed.). Upper Saddle River, NJ: Prentice Hall.
Holyoak, K. J., & Morrison, R. G. (2005). Thinking and reason-ing: A reader´s guide. In K. J. Holyoak & R. G. Morrison (Eds.), The Cambridge handbook of thinking and reasoning
(pp. 1-9). New York: Cambridge University Press.
Klauer, J. K. (1990). A process theory of inductive reasoning tested by the teaching of domain-specifi c thinking strategies.
European Journal of Psychology of Education, 5(2), 191-206. Linacre, J. M. (2002). What do infi t and outfi t, mean-squared and
standardized mean? Rasch Measurement Transactions, 16(2), 878. Retrieved April 25, 2006, from http://209.238.26.90/ rmt/rmt82a.htm
Linacre, J. M. (2005). WINSTEPS Rasch measurement computer program (Version 3.60) [Computer software]. Chicago, IL: Winsteps.com.
Malloy-Diniz, L. F., Sedo, M., Fuentes, D., & Leite, W. B. (2008). Neuropsicologia das funções executivas. In D. Fuentes, L. F. Malloy-Diniz, C. H. P. Camargo, & R. M. Consenza (Eds.),
Neuropsicologia: Teoria e prática (pp. 187-206). Porto Alegre, RS: Artes Médicas.
Marôco, J. (2010). Análise de equações estruturais: Fundamen-tos teóricos, software e aplicações. Pero Pinheiro, Portugal: Report Number.
McGrew, K. S. (2009). CHC theory and the human cognitive abilities project: Standing on the shoulders of the giants of psychometric intelligence research. Intelligence, 37, 1-10. Muniz, M., Seabra, A. G., & Primi, R. (2012). Validity and
reli-ability of the Inductive Reasoning Test for Children – IRTC.
Psicologia: Refl exão e Crítica, 25(2), 275-285.
Muthén, L. K., & Muthén, B. O. (2010a). Mplus: Statistical analy-sis with latent variables (Version 6.12) [Computer software]. Los Angeles, CA: Muthén & Muthén.
Muthén, L. K., & Muthén, B. O. (2010b). Mplus: Statistical analysis with latent variables. User’s guide. Los Angeles, CA: Muthén & Muthén.
Pasquali, L., Wechsler, S., & Bensusan, E. (2002). Matrizes Progressivas do Raven Infantil: Um estudo de validação para o Brasil. Avaliação Psicológica, 2, 95-110.
Primi, R. (1998). Desenvolvimento de um instrumento infor-matizado para avaliação do raciocínio analítico (Tese de doutorado, Instituto de Psicologia, Universidade de São Paulo, SP, Brasil).
Primi, R. (2002). Complexity of geometric inductive reasoning tasks: Contribution to the understanding of fl uid intelligence.
Intelligence, 30(1), 41-70.
Primi, R., & Almeida, L. S. (2000). Manual prático daBateria de Provas de Raciocínio (BPR-5). São Paulo, SP: Casa do Psicólogo.
Primi, R., Cruz, M. B. Z., Nascimento, M. M., & Petrini, M. (2006). Validade de construto de um instrumento informa-tizado de avaliação dinâmica da inteligência fl uida. Psico, 37(2), 109-122.
Rueda, F. J. M., & Muniz, M. (2012). Cube Test para avaliação do raciocínio visuoespacial. São Paulo, SP: Vetor.
Schreiber, J. B., Stage, F. K., King, J., Nora, A., & Barlow, E. A. (2006). Reporting structural equation modeling and confi rmatory factor analysis results: A review. The Journal of Educational Research, 99(6), 324-337. doi:10.3200/ JOER.99.6.323-338
Sisto, F. F., Rueda, F. J. M., & Bartholomeu, D. (2006). Estudo sobre a unidimensionalidade do Teste Matrizes Progressivas Coloridas de Raven. Psicologia: Refl exão & Crítica, 19(1), 66-73.
Statistical Package for the Social Sciences. (2002). (Version 11.5) [Computer software]. Chicago, IL: Author.
Urbina, S. (2006). Fundamentos da testagem psicológica. Porto Alegre, RS: Artes Médicas.
Wilhelm, O. (2005). Measuring reasoning ability. In O. Wilhelm & R. W. Engle (Eds.), Handbook of understanding and mea-suring intelligence (pp. 373-407). London: Sage.
Wright, B. D., & Stone, M. H. (2004). Making measure. Chicago, IL: The Phaneron Press.