Adjustment to Public and Private
Information
Ricardo R.G. Avelino
∗
Contents: 1. Introduction; 2. The IPO Pricing Process; 3. Description of the Data; 4. Model; 5. Empirical Results; 6. Endogeneity of Underwriter Choice; 7. Conclusion. Keywords: IPO; Underpricing; Partial Adjustment; Book-Building.
JEL Code: G14; G24: G32.
This paper examines the underwriters’ treatment of information throughout the IPO pricing process based on a sample of Brazilian com-panies that went public between 2004 and 2011. There is evidence that the offer price partially incorporates the information contained into the Bovespa index during the book-building period, reacting symmetrically to upward and downward movements. The first-day return, as a re-sult, is predictable on the basis of this information. Positive private information disclosed during the book-building period is also partially incorporated into the offer price. Issues priced above the midpoint of the initial price range are associated with higher initial returns.
Este artigo examina o tratamento da informação pelo coordenador líder durante o processo de apreçamento do IPO baseado em uma amostra de fir-mas brasileiras que abriram o capital entre 2004 e 2011. O preço de oferta in-corpora parcialmente a informação contida no Ibovespa durante o período de book-building, reagindo simetricamente a movimentos de alta e baixa. O retorno inicial, como resultado, pode ser previsto com base nesta infor-mação. Informação privada positiva revelada durante o período de book-building também é parcialmente incorporada no preço de oferta. Ofertas com preço acima do ponto médio do intervalo inicialmente estabelecido pro-duzem maiores retornos iniciais.
1. INTRODUCTION
There is extensive evidence that U.S. initial public offerings (IPOs) are underpriced, i.e., that the initial return, measured as the percentage change between the first-day closing price and the offer price, is, on average, positive (see,inter alia, Ibbotson (1975) and Ritter and Welch (2002)). Moreover, as Hanley (1993) first documented, issues that have the offer price revised upwards relative to the midpoint of the initial price range disclosed in the preliminary prospectus tend to display greater underpricing. The same patterns emerge from a sample of Brazilian companies that went public between 2004 and 2011, with IPOs being underpriced, on average, by 4.79% and the subset of offerings priced above the initial price range producing an average initial return of 21.74%. Thus, it seems that issuers do not incorporate all available information when setting the offer price and acquiesce in leaving money on the table (defined as the first-day price gain multiplied by the number of shares sold).
In Brasil, like the U.S., the pricing and allocation of IPOs are established through a process known as book-building, whereby an issuer hires an investment bank to market the IPO to potential clients and to determine the offer price based on nonbinding indications of interest solicited from investors. Benveniste and Spindt (1989) view the underpricing phenomenon as a means of inducing potential investors to be forthright with their information during this process and predict that the offer price will partially adjust to private information but that it will fully incorporate all available public information. The prospect theory advocated by Loughran and Ritter (2002), by contrast, based on the idea that issuers care about the change in their wealth rather than about the level of their wealth, does not make a distinction between public and private information.
This paper evaluates whether the Benveniste and Spindt (1989) and Loughran and Ritter’s (2002) models are useful in explaining the underpricing of Brazilian IPOs and the process whereby the offer price is set. In particular, I examine whether the public information available throughout the IPO pricing process and the private information revealed during the book-building period help predict the price update, defined as the percentage change between the final offer price and the midpoint of the file price range, and first-day returns.
The benchmark econometric specification that I employ in this paper models both the price update and the initial return as a function of the market return during the book-building period and of firm and deal specific characteristics such as the presence of secondary shares in the offering and the financial assets prior to the offering. The empirical relation between the price update and the initial return is driven by the correlation of the idiosyncratic shocks of the two equations, which can be interpreted as factors outside the issuing firm (e.g. the perception of barriers to entry in the industry by potential investors) conveying private information about the long-run performance of the company. The coef-ficients of the equations are allowed to differ across underwriters and in this simple model I abstract from the potential endogeneity of the lead underwriter.
The main results are as follows. Positive and negative market movements during the book-building period affect the final offer price in a similar way. The market return alone explains approximately only 6% of the cross-sectional variation in the price update, but its coefficient is statistically significant. The inclusion of a dummy for secondary shares leads to an increase in the explanatory power of the model (theR2raises from 0.06 to 0.16 in the whole sample of IPOs) and suggests that underwriters are more conservative in setting the initial price range of IPOs containing secondary shares.
in predicting initial returns. IPOs with secondary shares are, on average, 6% more underpriced than those IPOs containing only primary shares.
The main conclusions regarding the effects of public and private information on the price update and initial return equations are not substantially altered when the benchmark econometric specification is extended to account for the potential endogeneity of the lead underwriter. This is accomplished by the use of a multinomial probit model to explain the underwriter selection under the simplifying assumption that the issuer chooses the investment bank so as to maximize the expected proceeds from the offering.
It must be stressed that this is not the first paper that analyzes Brazilian IPOs. Previous research, however, has focused on different aspects of the IPO pricing process. Cassotti and Motta (2008), for example, examine whether Brazilian companies that went public between 2004 and 2006 were under or overvalued at the time of their IPOs using multiples to value the equities. Rossi Jr and Marotta (2010) test the existence of equity market timing using a sample of IPOs from January 2004 to December 2007, while Aldrighi et al. (2010) investigate the determinants of the firm’s decision to go public and the owner’s choice regarding the design of the IPO. Neither of these papers, nevertheless, addresses the underwriters’ treatment of public and private information throughout the IPO pricing process in Brazil. The remainder of the paper is structured as follows. Section 2 discusses in detail the four basic stages of the IPO pricing process and reviews the models of Benveniste and Spindt (1989) and Loughran and Ritter (2002). Section 3 describes the dataset used in this study and some stylized facts of Brazilian IPOs. Section 4 sets forth the benchmark econometric model, which makes the restrictive assumption that the underwriter is assigned exogenously to the firms. Section 5 presents the empirical estimates and analyzes the underwriter’s treatment of public and private information throughout the IPO pric-ing process. Section 6 extends the econometric model to incorporate the endogeneity of underwriter choice. Finally, Section 7 concludes.
2. THE IPO PRICING PROCESS
The decision of a firm to go public can be thought of as a process occuring in four stages. In the first stage, the issuing firm, offering a fraction of its capital for sale to raise additional cash for future growth or to enable existing stockholders to cash out by selling part of their holdings, chooses an investment bank as the lead underwriter. The selection of the underwriter is dictated by the maximization of the proceeds from going public and by other factors such as the quality of the investment banker’s research coverage (see, for instance, Carter and Manaster (1990) and Loughran and Ritter (2004)).
In the second stage, the issuing firm files a preliminary prospectus withComissão de Valores Mo-biliários(CVM) containing basic information on the company and on the proposed offering such as the last financial statements, the risk factors associated with the offering, a projected number of shares to be issued and a price range within which the company and its underwriter expect to take the is-sue to market. At the same time, the issuing firm and its underwriter promote the IPO through the road show, making numerous presentations to market the issue to potential investors and soliciting from them nonbinding indications of interest, which are collected into a book. For more details of the book-building process and of the different types of bids submitted by investors, the reader is referred to Cornelli and Goldreich (2003).
The third stage typically takes place after the market closes on the day before the issuing firm releases the final prospectus. Once the book is closed, the investment bank aggregates the several bids into a demand curve and sets the final offer price at his discretion and in consultation with the issuing firm. The initial price range contained in the preliminary prospectus is only indicative and the final offer price may be outside that range.
e.g. Ibbotson (1975) and Ritter and Welch (2002)). Hence, it seems that issuing firms systematically acquiesce in leaving money on the table in the sense that if the shares had been sold at the closing market price, the same proceeds could have been raised by selling fewer shares.
Benveniste and Spindt (1989) provide a rationale for the underpricing phenomenon. They recog-nize that setting the offer price of an IPO is problematic. To the extent that investors are likely to be asymmetrically well informed about factors outside the issuing firm affecting the valuation of the stock, they have no incentive to reveal positive information during the book-building process, in hopes of buying shares at a depressed offer price. Benveniste and Spindt (1989) model the premarket as an auction conducted by the underwriter, in which the expected proceeds from the offering can be max-imized if investors are induced to be forthright with their information by expecting to profit more by being truthful than by revealing false information. This is accomplished by setting IPO offer prices low and by giving allocation priority to regular investors (those actively involved on an ongoing basis in purchasing shares of firms going public) who reveal good information. The model predicts that IPO offer prices partially adjust to private but not to public information acquired during the book-building process and that underpricing will be more severe for issues priced in the upper part of the offer range. An alternative explanation for the underpricing of IPOs that does not make a distinction between public and private information is offered by Loughran and Ritter (2002). It is based on a prospect theory model that posits that issuers have a value function defined in terms of gains and losses rather than in terms of levels. They argue that issuers, in most situations, when faced with a gain and a loss, will inte-grate the events, summing the wealth loss from the money left on the table with the increase in wealth stemmed from the impact of a price jump on the retained shares, and will feel better off. Prospect theory claims that, to the extent that underpricing is a form of indirect compensation to underwriters and that issuers view underpricing as less important than the direct fees paid to investment bankers, underwriters are able to receive a higher revenue if the stock is underpriced than if compensation was entirely in the form of gross spreads.
Like Lowry and Schwert (2004), I investigate the underwriters’ treatment of public and private in-formation throughout the Brazilian IPO pricing process. Before presenting the benchmark econometric model used in the empirical analysis, however, I describe the sample of IPOs used in this study.
3. DESCRIPTION OF THE DATA
The initial sample consists of all 139 companies that completed an IPO between 2004 and 2011.1 I exclude from the initial sample seven Brazilian Depository Receipts, one firm that went public whose total assets were below R$ 10 million, one IPO with a midpoint of the file price range of less than R$ 2.00 and one IPO listed on theBovespa Maissegment. The final sample includes 129 IPOs and contains detailed information on firm and offering specific characteristics such as the dates of the preliminary and final prospectuses, the lower and upper bound of the initial price range, the final offer price, the lead underwriter, the percentage of secondary shares in the offering excluding the overallotment option and the first-day closing price. All information was collected from the prospectuses of the companies and from the historical daily stock prices provided by Bovespa.
1The full list of IPOs is available at http://bmfbovespa.comunique-se.com.br. Lojas Renner is classified by Bovespa as a seasoned
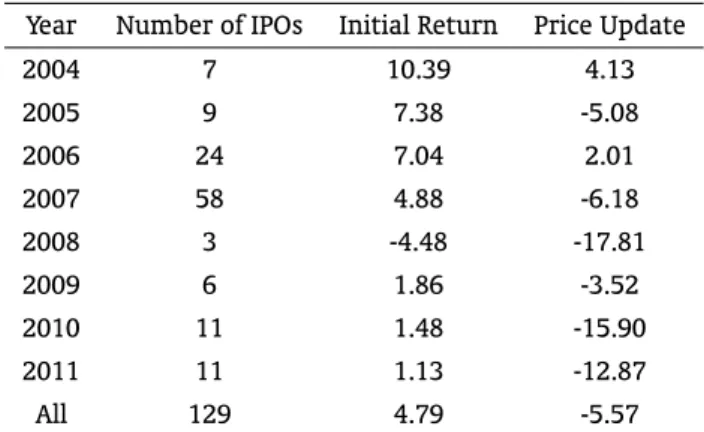
Table 1: Summary Statistics of Brazilian IPOs from January 2004 to December 2011
Year Number of IPOs Initial Return Price Update
2004 7 10.39 4.13
2005 9 7.38 -5.08
2006 24 7.04 2.01
2007 58 4.88 -6.18
2008 3 -4.48 -17.81
2009 6 1.86 -3.52
2010 11 1.48 -15.90
2011 11 1.13 -12.87
All 129 4.79 -5.57
This table shows some summary statistics for the sub-sample of IPOs from 2004 to 2011 used in the study. The initial return and price update are defined, respec-tively, as the percentage change between the first-day closing price and the offer price and the percentage change between the offer price and the midpoint of the file price range.
Table 1 presents the evolution of the number of IPOs from 2004 to 2011, along with the average unadjusted initial return and the price update.2The number of IPOs grew steadily from 7 to 58 offerings between 2004 and 2007 and then reverted from 2008 onwards, oscillating between 3 and 11 issues, as a result of the global financial crisis that ecloded with the burst of the U.S. housing bubble.
From 2004 to 2011, the average initial return on IPOs was 4.79%, being positive in every year with the exception of 2008. The underpricing is fairly modest in comparison with the sizable early initial returns earned by investors in the U.S. Loughran and Ritter (2004), for example, document that the average first-day return doubled from 7% in the 1980s to almost 15% in the 1990s in the U.S., achieving 65% in 1999-2000 before reverting to 12% during 2001-2003.
The last column of Table 1 shows the annual behavior of the price update. The average price update of all firms going public during the sample period was−5.57% and was negative in six of the eight
years between 2004 and 2011. It is possible to conclude that this negative price update is statistically different from zero using a simplettest in spite of the small sample size. The statistic of−3.94 has an
associatedpvalue of less than 0.01%.
Hanley (1993) first documented the “partial adjustment phenomenon”, whereby issues that have positive revisions in the offer price and, therefore, are hypothesized to have positive information re-vealed during the book-building period, display greater underpricing. Table 2 presents the annual number of issues and the first-day return for IPOs categorized on the basis of the final offer price rela-tive to the original price range. We observe that the majority of the offerings (91 out of 129 or 70.5%) are priced within the range and that IPOs with an offer price above the range are much less frequent
2I do not adjust the initial return for market movements because they are substantially smaller than first-day returns in
than those with an offer price below the range. Further, we see that the statistics seem to support the Benveniste and Spindt’s (1989) prediction that IPOs with an offer price above the price range will be more underpriced. The issues with an offer price above the maximum anticipated in the preliminary prospectus have an initial average return of 21.74%, which is more than four times greater than the first-day return of 5.22% associated with the 91 IPOs priced within the range. The average initial return for those companies that decreased the offer price to a level below the range, by contrast, is negative and equal to−1.04%.
Table 2: First-Day Returns of IPOs Priced Above, Below and Within the Anticipated Price Range
Year IPOs with OP < LO IPOs within the range IPOs with OP > HI Number of IPOs Initial Return Number of IPOs Initial Return Number of IPOs Initial Return
2004 0 - 6 11.22 1 5.38
2005 2 5.58 5 4.55 2 16.25
2006 3 -0.32 20 7.96 1 10.61
2007 11 -0.49 43 3.54 4 31.36
2008 2 -10.88 1 8.31 0
-2009 1 -3.33 5 2.90 0
-2010 6 -3.05 5 6.92 0
-2011 5 -0.67 6 2.64 0
-All 30 -1.04 91 5.22 8 21.74
This table shows the annual number and average initial return of IPOs categorized with respect to the minimum (LO) and maximum (HI) of the initial price range. OP stands for the offer price. The initial return is defined as the percenta-ge chanpercenta-ge between the first-day closing price and the offer price.
Table 3 sorts the IPOs by both the update in the offer price and by market movements during the book-building period. Not surprisingly, in view of the numbers presented in Table 2, we see that there is a sharp increase in first-day returns as we move from IPOs priced below the range to IPOs priced above the range, regardless of the magnitude of market returns during the book-building period. However, there is no evidence that market returns help predict IPO initial returns.
Table 3: First-Day Returns of IPOs Categorized by the Offer Price Relative to the Initial Price Range and by the Market Return during the Book-building Period
IPOs with OP < LO IPOs within the range IPOs with OP > HI
Market Return < 1.0% -0.25 5.20 37.07
1.0%<= Market Return <=4.0% -5.20 5.45 16.84
Market Return > 4.0% 2.52 5.04 16.42
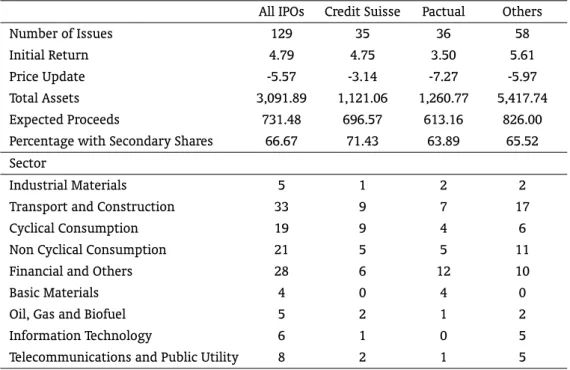
Table 4 evaluates to what extent companies that go public differ across lead underwriters. The 129 IPOs in the subsample were managed by 14 different investment banks.3 Two of them, Credit Suisse and
Pactual, had a prominent role in bringing the issues to market, being the lead underwriter, respectively, of 35 and 36 of the IPOs. The 12 investment banks that handled the remaining 58 IPOs are grouped into a unique category, which I refer to as “Others”.4
Table 4: Descriptive Statistics of Firm and Offering Specific Characteristics
All IPOs Credit Suisse Pactual Others
Number of Issues 129 35 36 58
Initial Return 4.79 4.75 3.50 5.61
Price Update -5.57 -3.14 -7.27 -5.97
Total Assets 3,091.89 1,121.06 1,260.77 5,417.74 Expected Proceeds 731.48 696.57 613.16 826.00 Percentage with Secondary Shares 66.67 71.43 63.89 65.52 Sector
Industrial Materials 5 1 2 2
Transport and Construction 33 9 7 17
Cyclical Consumption 19 9 4 6
Non Cyclical Consumption 21 5 5 11
Financial and Others 28 6 12 10
Basic Materials 4 0 4 0
Oil, Gas and Biofuel 5 2 1 2
Information Technology 6 1 0 5
Telecommunications and Public Utility 8 2 1 5 This table shows the number of IPOs managed by each of the underwriters and some firm and offering specific characteristics. The initial return is defined as the percentage change between the first-day closing price and the offer price and the price update as the percenta-ge chanpercenta-ge between the offer price and the midpoint of the file price ranpercenta-ge. Total assets and expected proceeds are converted to January 2004 reals using the IPCA, expressed in millions and refer, respectively, to the total assets in the most recent financial statement reported in the preliminary prospectus and to the midpoint of the initial price range times the num-ber of shares the firm plans to issue in the preliminary prospectus, excluding the overallot-ment option. Percentage with secondary shares is the percentage of offerings that includes secondary shares and the sector of the firm is based on the classification adopted by Bovespa.
3Pactual was named UBS Pactual after its acquisition by UBS in 2006. In 2009, as a result of the takeover of UBS Pactual by BTG,
the bank was renamed BTG Pactual. I treat Pactual, UBS Pactual and BTG Pactual as a single underwriter and use the term Pactual to refer to this investment bank.
4This category includes ABN Amro Real, Bradesco BBI, Citigroup, Deutsche Bank, Fator, Itau BBA, JP Morgan, Merrill Lynch,
The IPOs managed by Pactual and Credit Suisse have smaller initial returns than those handled by underwriters with less market power, providing some support for the hypothesis that more prestigious underwriters (with higher market shares) are associated with less underpricing. On the other hand, the price update reveals no tendency of more prestigious investment banks to be more conservative in setting the initial price range. The IPOs managed by the three underwriters also differ in terms of firm size, measured by total assets, with Credit Suisse and Pactual bringing to market, on average, issues four times smaller than those handled by other underwriters, and, to a lesser extent, in terms of expected proceeds. The difference in issue size does not stem from a tendency of banks (which have much larger assets) to select less prestigious underwriters. Indeed, three quarters of the issues in the financial and related sectors have Credit Suisse or Pactual as the lead underwritervis-à-vis55% in the whole sample. Finally, we see that the percentage of IPOs with secondary shares is not noticeably different across underwriters.
4. MODEL
In this section, I present a simple model aimed at capturing the essential features of the IPO pricing process. For simplicity, I assume that the choice of the lead underwriter is exogenous. This assumption is relaxed in Section 6 below. Lety1iandy2idenote, respectively, the price update and the initial return
of an IPO managed by thei-th underwriter (i= 1,2,3). I assume thaty1iis a linear function of a vector
of observable characteristics, such as the market return during the book-building period and the log of assets prior to the offering, contained in the vectorx1i, and of an idiosyncratic shocku1i,independent
ofx1i, i.e.,
y1i=x1iβi+u1i
x1i⊥⊥u1i
Likewise, I assume thaty2i depends linearly on a set of explanatory variablesx2i including firm
and deal specific characteristics, such as those contained inx1i, and on an idiosyncratic shocku2i,
independent ofx2i, that is,
y2i=x2iζi+u2i
x2i⊥⊥u2i
To complete the description of the model, it is necessary to specify the distribution of the vector of shocks(u1i,u2i)
′
.They are allowed to be correlated for thei-th underwriter but not across underwrit-ers and firms or over time and assumed to follow a bivariate normal distribution with mean zero and covariance matrixΣi,given by5
Σi= σ i
11 σ
i
12
σi
12 σ22i
!
The idiosyncratic shocks can be thought of as business factors outside the issuing firm such as barri-ers to entry which will affect the probability of emergence of a new competitor and the expected future demand and price of the good or service produced by the firm. It is conceivable that potential investors combined are asymmetrically well informed about these factors. Rock (1986), for instance, argues that
5These assumptions rule out spillover effects arising from the overlapping waiting periods of IPOs that partially adjust to a
the issuer gives up its informational advantage by revealing its proprietary knowledge to the market through the prospectuses. The private information conveyed by the idiosyncratic factors will impact the long-run performance of the company and hence the bids submitted by potential investors during the book-building period. To the extent that the private information that is revealed is not fully incor-porated into the final offer price, it will also influence the demand for the stock in the aftermarket, inducing a correlation betweenu1iandu2i.Since the offer price is usually set immediately before trade
begins, conditioned on the realized value ofy1i,we have
y2i=
σi
12
σi
11
(y1i−x1iβi) +x2iζi+ ˜u2i, u˜2i∼N
0,σi
22−
σi2 12
σi
11
This setup makes it clear that there is no causal relation between the price update and the initial return in the sense that if the firm deliberately revises upward the offer price of a badly received IPO, this will not ensure a positive initial return. Nevertheless, ceteris paribus, a positive shock into the update equation, captured by the bids of investors, will translate itself into a higher initial return as long asσi
12>0.
The model proposed in this section is similar in nature to the framework employed by Lowry and Schwert (2004), but with some important differences. First, they include the underwriter rank among the explanatory variables in both the price update and the initial return equations, which means that they implicitly treat the underwriter choice as exogenous and that the underwriter rank simply shifts the intercepts of the regressions. Second, they include the price update directly among the covariates of the equation for the initial return. In other words, they do not orthogonalize the change in the offer price with respect to the public information variables, which means, for instance, that their model predicts a greater underpricing even if the upward revision in the offer price was solely due and fully reflects a large index run-up.
5. EMPIRICAL RESULTS
This section presents the estimates of the parameters of the model and assesses to what extent the price update and initial return are affected by public and private information revealed during the book-building period and by firm and offering specific characteristics known at the time the preliminary prospectus is filed.
5.1. Price Update
5.1.1. The Response of the Price Update to Public Information Revealed During the Book-building Period
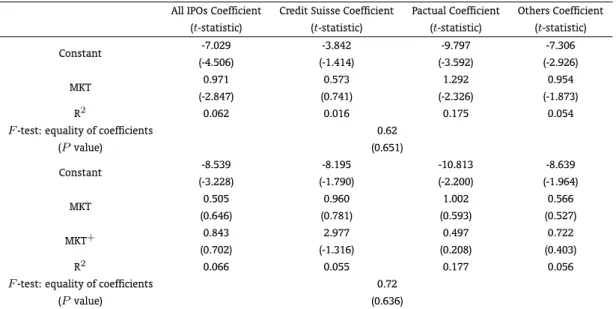
Table 5 contains the estimates of the coefficients of price update regressions, witht statistics in parentheses, for the whole sample of IPOs and for the subsamples of issues managed by each of the three underwriters.
The bottom of the table introduces an additional explanatory variable among the regressors,
M KT+
, which equals the market return if it is positive and zero otherwise, thereby enabling positive and negative public information to affect the offer price differently. This asymmetric response can arise if potential investors anchor at the midpoint of the file price range and the investment bank is reluctant to raise the offer price above this level to avoid defections from investors (Loughran and Ritter (2002)). The results presented at the bottom of Table 5 do not support this conjecture though. The estimated coefficients onM KT+
are not statistically different from zero both across underwriters and for the whole sample of IPOs. Further, we observe that in most cases the R2
changes marginally with the addition of this extra variable.
Table 5: OLS Regressions – Impact of Market Return on the Price Update
All IPOs Coefficient Credit Suisse Coefficient Pactual Coefficient Others Coefficient (t-statistic) (t-statistic) (t-statistic) (t-statistic)
Constant -7.029 -3.842 -9.797 -7.306
(-4.506) (-1.414) (-3.592) (-2.926)
MKT 0.971 0.573 1.292 0.954
(-2.847) (0.741) (-2.326) (-1.873)
R2 0.062 0.016 0.175 0.054
F-test: equality of coefficients 0.62
(Pvalue) (0.651)
Constant -8.539 -8.195 -10.813 -8.639
(-3.228) (-1.790) (-2.200) (-1.964)
MKT 0.505 0.960 1.002 0.566
(0.646) (0.781) (0.593) (0.527)
MKT+ 0.843 2.977 0.497 0.722
(0.702) (-1.316) (0.208) (0.403)
R2 0.066 0.055 0.177 0.056
F-test: equality of coefficients 0.72
(Pvalue) (0.636)
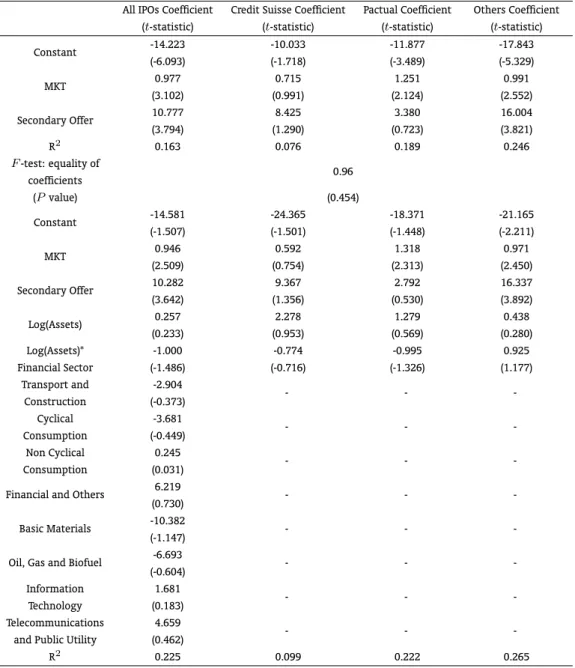
Table 6: OLS Regressions – Impact of Public Information on the Price Update
All IPOs Coefficient Credit Suisse Coefficient Pactual Coefficient Others Coefficient (t-statistic) (t-statistic) (t-statistic) (t-statistic)
Constant -14.223 -10.033 -11.877 -17.843
(-6.093) (-1.718) (-3.489) (-5.329)
MKT 0.977 0.715 1.251 0.991
(3.102) (0.991) (2.124) (2.552)
Secondary Offer 10.777 8.425 3.380 16.004
(3.794) (1.290) (0.723) (3.821)
R2 0.163 0.076 0.189 0.246
F-test: equality of
0.96 coefficients
(Pvalue) (0.454)
Constant -14.581 -24.365 -18.371 -21.165
(-1.507) (-1.501) (-1.448) (-2.211)
MKT 0.946 0.592 1.318 0.971
(2.509) (0.754) (2.313) (2.450)
Secondary Offer 10.282 9.367 2.792 16.337
(3.642) (1.356) (0.530) (3.892)
Log(Assets) 0.257 2.278 1.279 0.438
(0.233) (0.953) (0.569) (0.280)
Log(Assets)* -1.000 -0.774 -0.995 0.925
Financial Sector (-1.486) (-0.716) (-1.326) (1.177)
Transport and -2.904
- -
-Construction (-0.373) Cyclical -3.681
- -
-Consumption (-0.449) Non Cyclical 0.245
- -
-Consumption (0.031)
Financial and Others 6.219 - -
-(0.730)
Basic Materials -10.382 - -
-(-1.147)
Oil, Gas and Biofuel -6.693 - -
-(-0.604) Information 1.681
- -
-Technology (0.183) Telecommunications 4.659
- -
-and Public Utility (0.462)
R2 0.225 0.099 0.222 0.265
5.1.2. The Impact of Firm and Offering Specific Characteristics on the Price Update
Table 6 presents a more comprehensive analysis of the price updating process, examining whether or not it is predictable on the basis of information known at the time the preliminary prospectus is filed. I rule out from the analysis the expected proceeds from the sale and the fraction of secondary shares in the offering, since these variables are possibly endogenous. I use instead the logarithm of total assets of the firm in the last quarter before the offering, converted to January 2004 reals to adjust for inflation, to capture the effect of issue size and a dummy variable for the presence of secondary shares in the offering, that is equal to one if the issue includes secondary shares and zero otherwise. Thus, I implicitly assume that shareholders can adjust the amount of secondary shares with the goal of maximizing the expected proceeds of the IPO but that their decision to diversify their portfolios occurs in a previous stage and is not influenced by these considerations.
It is worth noting that the coefficients on market return at Table 6 are in general not affected by the inclusion of the dummy for secondary shares in the regression. The dummy coefficients at the top of the table are positive, but are not statistically different from zero for Credit Suisse and Pactual. Once again we cannot reject the hypothesis that the coefficients are the same across underwriters, as indicated by the pvalue of 0.45 associated with the statistic. The results suggest that underwriters are more conservative in setting the initial price range of IPOs containing secondary shares. Maybe shareholders willing to add liquidity to their investments are particularly risk averse and strive to guarantee the successful completion of the IPO. Accounting for the presence of secondary shares in the offering increases the explanatory power of the model. In the restricted model that constrains the coefficients of the different underwriters to be equal, theR2
jumps from 0.06 to 0.16.
The bottom of the table includes the logarithm of assets and the interaction between the logarithm of assets and a dummy variable for banks, which assumes the value of one if the firm is a bank and zero otherwise, among the covariates of the regressions and, in the case of the whole sample, dummy variables for the industrial sector of the firm.6 All the coefficients of the industrial sector dummies
are not individually significant. A test of the hypothesis that they are jointly zero (not shown in the table) yields a statistic of 1.18 with a correspondingpvalue of 0.32, favoring the more restricted spec-ification employed for each underwriter. Further, the point estimates suggest that the price update is positively related to the size of the firm, but the coefficients are not statistically different from zero at any reasonable level of significance. Inspection of the table also shows that the coefficients of the loga-rithm of assets are not statistically different from zero for banks, thereby supporting the more restricted specification at the top of Table 6.
5.2. Initial Return
5.2.1. The Response of First-Day Returns to Public and Private Information Revealed During the Book-building Period
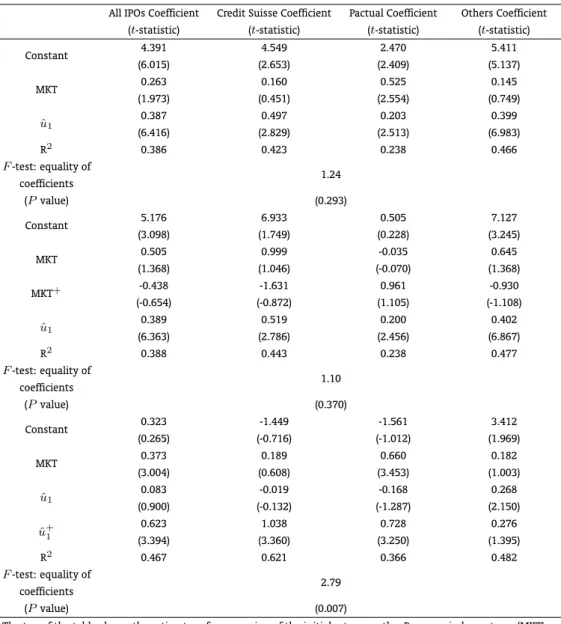
This subsection examines the sensitiveness of first-day returns to private and public information revealed during the book-building period. The top of Table 7 reports regression results with first-day returns as the dependent variable and the residual of the price update regression (which I henceforth, with some abuse of terminology, simply refer to as the price update) and market return during the wait-ing period as explanatory variables. The coefficients of the price update are positive and statistically significant for the three underwriters and for the whole sample, indicating that private information acquired during the waiting period is not fully incorporated into the final offer price. The evidence regarding public information is mixed. The coefficient in the whole sample is barely statistically sig-nificant and largely driven by the IPOs handled by Pactual. For Credit Suisse and the other investment
6These industrial sector dummies were not included in the specifications for each underwriter due to the relatively small number
Table 7: OLS Regressions – Impact of Market Return and of the Price Update on Initial Returns
All IPOs Coefficient Credit Suisse Coefficient Pactual Coefficient Others Coefficient (t-statistic) (t-statistic) (t-statistic) (t-statistic)
Constant 4.391 4.549 2.470 5.411
(6.015) (2.653) (2.409) (5.137)
MKT 0.263 0.160 0.525 0.145
(1.973) (0.451) (2.554) (0.749)
ˆ
u1 0.387 0.497 0.203 0.399
(6.416) (2.829) (2.513) (6.983)
R2 0.386 0.423 0.238 0.466
F-test: equality of
1.24 coefficients
(Pvalue) (0.293)
Constant 5.176 6.933 0.505 7.127
(3.098) (1.749) (0.228) (3.245)
MKT 0.505 0.999 -0.035 0.645
(1.368) (1.046) (-0.070) (1.368)
MKT+ -0.438 -1.631 0.961 -0.930
(-0.654) (-0.872) (1.105) (-1.108)
ˆ
u1 0.389 0.519 0.200 0.402
(6.363) (2.786) (2.456) (6.867)
R2 0.388 0.443 0.238 0.477
F-test: equality of
1.10 coefficients
(Pvalue) (0.370)
Constant 0.323 -1.449 -1.561 3.412
(0.265) (-0.716) (-1.012) (1.969)
MKT 0.373 0.189 0.660 0.182
(3.004) (0.608) (3.453) (1.003)
ˆ
u1 0.083 -0.019 -0.168 0.268
(0.900) (-0.132) (-1.287) (2.150)
ˆ u+
1
0.623 1.038 0.728 0.276
(3.394) (3.360) (3.250) (1.395)
R2 0.467 0.621 0.366 0.482
F-test: equality of
2.79 coefficients
(Pvalue) (0.007)
The top of the table shows the estimates of a regression of the initial return on the Bovespa index return (MKT) during the book-building period and on uˆ1, the residual of the price update regression with MKT as the independent variable at Table 5.tstatistics are reported in parentheses. In the middle, MKT+, which equals
1 if MKT is positive and zero otherwise, and the residual of the price update regression with MKT and MKT+
as independent variables at Table 5 are included among the explanatory variables. The bottom of the table shows the regression results when MKT,uˆ1, defined as the residual from a regression of the price update on MKT, and uˆ+
1, which equals 1 if uˆ1 is positive and zero otherwise, are included among the covariates.
banks, by contrast, there is no evidence that public information helps predict initial returns. In the whole sample of IPOs, the coefficient on market return is roughly two thirds the estimated value of the price update coefficient, suggesting that the partial adjustment of the ultimate offer price to public information leads to predictable first-day returns, with the underwriter freely rewarding all investors at the expense of the issuer. The top of the table also shows that the hypothesis that the coefficients across underwriters are equal cannot be rejected. The observed value of the statistic is 1.24 and the associatedpvalue 0.29. It is noteworthy how this simple specification explains a sizeable fraction of the cross-sectional variation of first-day returns. TheR2
varies between 0.24 for Pactual and 0.47 for “Others” and reaches 0.39 in the sample of all IPOs.
In the middle of Table 7, I relax the assumption that positive and negative public information have the same effect on the initial return. The coefficients onM KT+
are not statistically significant in all specifications. We also see that the price update coefficients in this more general specification concur with the estimated values reported for the restricted specification at the top of the table and that there is a negligible increase in the coefficients of determination. In sum, there is no evidence that public information learned during the waiting period has an asymmetric effect on initial returns.
The bottom of Table 7 carries out a similar exercise for private information disclosed during the book-building period. Letuˆ+
1 be equal to one if the price update,uˆ1,is positive and zero otherwise. When we includeuˆ+1 among the independent variables, the sum of the coefficients onuˆ
+
1 and onuˆ1 gives the effect of positive private information revealed during the waiting period on the initial return, while the coefficient onuˆ1gives the effect of negative private information. All the coefficients onuˆ
+ 1 are positive and, apart from “Others”, statistically different from zero, indicating that the effect of the price update on initial returns is strongly asymmetric. In addition, notice that, conditional upon a downward revision in the offer price, private information learned during the book-building period does not predict first-day returns. As emphasized by Lowry and Schwert (2004), the lower magnitude of initial returns following negative private information is consistent with underwriters trying to avoid losses on overpriced issues while allowing informed investors to share the gains on underpriced issues. Finally, we observe that, when positive and negative private information have an asymmetric effect on initial returns, anF test provides evidence that the coefficients differ across underwriters.
5.2.2. The Impact of Firm and Offering Specific Characteristics on First-Day Returns
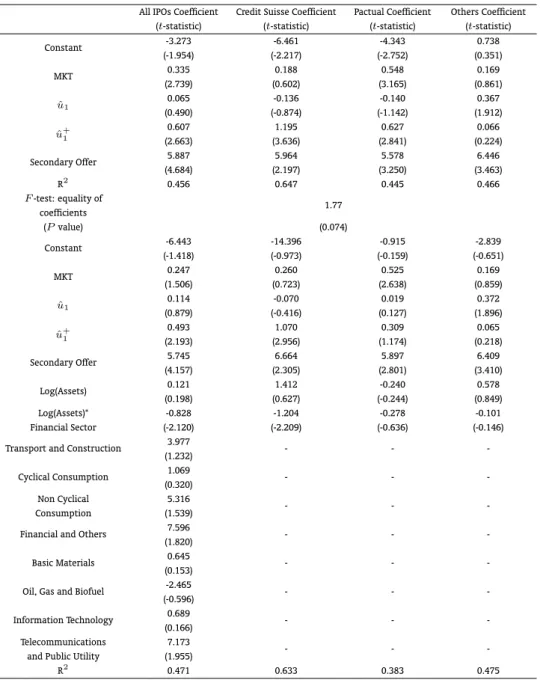
Table 8 investigates to what extent readily available public information at the time of the filing of the preliminary prospectus is useful for predicting IPO underpricing. The first set of regressions includes the dummy for secondary shares among the explanatory variables. Recall that the coefficient on this variable is statistically significant in the price update regressions for the whole sample and for “Others”, but not for Credit Suisse and Pactual. The results in Table 8, by contrast, show that the presence of secondary shares in the offering increases the IPO initial returns for all underwriters and for the whole sample. Offerings with secondary shares,ceteris paribus, are, on average, 6% more underpriced than those IPOs selling only primary shares.
Other firm specific characteristics known before the offering date are not significantly related to first-day returns. A test of the joint hypothesis that the industrial sector dummies are jointly equal to zero, for instance, yields an observed statistic of 1.88 with a correspondingpvalue of 0.07, not enabling us to reject the null hypothesis at the conventional level of significance of 5%. The coefficients on the logarithm of assets are also not statistically different from zero, not supporting the hypothesis that smaller issues are more risky and, as a consequence, tend to have greater underpricing. The proxy of firm size, however, seems to have an effect on the initial return of banks, at least in the whole sample and for those IPOs underwritten by Credit Suisse.
Table 8: OLS Regressions – Impact of Public and Private Information on Initial Returns
All IPOs Coefficient Credit Suisse Coefficient Pactual Coefficient Others Coefficient (t-statistic) (t-statistic) (t-statistic) (t-statistic)
Constant -3.273 -6.461 -4.343 0.738
(-1.954) (-2.217) (-2.752) (0.351)
MKT 0.335 0.188 0.548 0.169
(2.739) (0.602) (3.165) (0.861)
ˆ
u1 0.065 -0.136 -0.140 0.367
(0.490) (-0.874) (-1.142) (1.912)
ˆ
u+1 0.607 1.195 0.627 0.066
(2.663) (3.636) (2.841) (0.224)
Secondary Offer 5.887 5.964 5.578 6.446
(4.684) (2.197) (3.250) (3.463)
R2
0.456 0.647 0.445 0.466
F-test: equality of
1.77 coefficients
(Pvalue) (0.074)
Constant -6.443 -14.396 -0.915 -2.839
(-1.418) (-0.973) (-0.159) (-0.651)
MKT 0.247 0.260 0.525 0.169
(1.506) (0.723) (2.638) (0.859)
ˆ
u1 0.114 -0.070 0.019 0.372
(0.879) (-0.416) (0.127) (1.896)
ˆ
u+1
0.493 1.070 0.309 0.065
(2.193) (2.956) (1.174) (0.218)
Secondary Offer 5.745 6.664 5.897 6.409
(4.157) (2.305) (2.801) (3.410)
Log(Assets) 0.121 1.412 -0.240 0.578
(0.198) (0.627) (-0.244) (0.849)
Log(Assets)* -0.828 -1.204 -0.278 -0.101
Financial Sector (-2.120) (-2.209) (-0.636) (-0.146)
Transport and Construction 3.977 - -
-(1.232)
Cyclical Consumption 1.069 - -
-(0.320) Non Cyclical 5.316
- -
-Consumption (1.539)
Financial and Others 7.596 - -
-(1.820)
Basic Materials 0.645 - -
-(0.153)
Oil, Gas and Biofuel -2.465 - -
-(-0.596)
Information Technology 0.689 - -
-(0.166) Telecommunications 7.173
- -
-and Public Utility (1.955)
R2 0.471 0.633 0.383 0.475
The top of the table shows the estimates of a regression of the initial return on the Bovespa market return (MKT) during the book-building period, on a dummy variable for secondary shares, which assumes the value of one if the offering contains secondary shares and zero otherwise, onuˆ1, the residual from the price update regression on MKT and on the dummy
for secondary shares, and onuˆ+1, which equals 1 ifuˆ1is positive and zero otherwise. The OLS regression is run for the
6. ENDOGENEITY OF UNDERWRITER CHOICE
The model proposed in Section 4 can be readily extended to accommodate the situation in which the underwriter choice is endogenous. In the next subsection, I use the multinomial probit (MNP) model to explicitly model the underwriter selection under the simplifying assumption that the issuer chooses the investment bank so as to maximize the expected proceeds from going public. In the sequel, I briefly discuss the estimates of the MNP model and the consequences for the estimates of the price update and initial return equations of controlling for the endogeneity of underwriter choice.
6.1. A Simple Model of Underwriter Selection
LetVi(i= 1,2,3) denote the expected proceeds associated with underwriteriand suppose that the
outcomes can be expressed as linear functions of a set of explanatory variablesziand of an idiosyncratic
shockεi,independent ofzi, namely,
Vi=ziγi+εi
zi⊥⊥εi
and
ε∼N(0,Ω)
whereε= (ε1,ε2,ε3)
′ .
The expected proceeds are in general not observed by the econometrician. He observes only the actual choice of the issuer, which is dictated by whichever expected proceeds is greatest:
I=i⇔Vi= max(V1,V2,V3)
This unrestricted MNP model is not identified, since the choice depends only on the signs of ex-pected proceeds differences. To achieve identification, it is necessary to impose some normalizations. Specifically, I normalize the expected proceeds from underwriter1to zero and the variance ofε2to one so that
ε2
ε3
!
∼N
"
0 0
#
,
"
1 Ω12
Ω12 Ω22
#!
The MNP model relaxes the restrictive assumption of independence of irrelevant alternatives im-posed by the multinomial logit model. In this more general framework, ordinary least squares yields inconsistent estimates of the parameters of the price update and initial return equations unless
Cov(εi,u1j) =Cov(εi,u2j) = 0,∀i,j.In order to consistently estimate the parameters of these two
equations, I apply a generalization of the two-step procedure proposed by Heckman (1979), making use of the moments of a truncated multi-normal distribution derived by Tallis (1961). I note in passing that the standard errors of the estimates must take into account the heteroskedasticity of the error term in the second step and the fact that we are using an estimated regressor rather than the true value of the explanatory variable.
6.2. Maximum Likelihood Estimates of the MNP Model
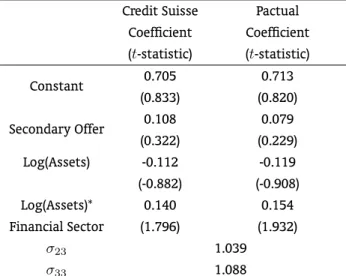
Most of the coefficients are not statistically different from zero, even if we adopt a conservative level of significance of 10%. It must be stressed that the poor performance of the explanatory variables in the model of underwriter selection may translate itself to biased second step estimates if we inadvertently omit fromzi explanatory variables correlated withu1i andu2i.In this sense, the empirical results in
the sequel must be interpreted with caution.
Table 9: Maximum Likelihood Estimates of the Multinomial Probit Model of Underwriter Selection
Credit Suisse Pactual Coefficient Coefficient (t-statistic) (t-statistic)
Constant 0.705 0.713
(0.833) (0.820)
Secondary Offer 0.108 0.079 (0.322) (0.229) Log(Assets) -0.112 -0.119 (-0.882) (-0.908) Log(Assets)* 0.140 0.154 Financial Sector (1.796) (1.932)
σ23 1.039
σ33 1.088
6.3. Two-Step Estimates of the Impact of Public Information on the Price Update
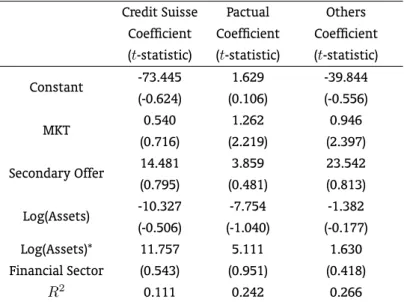
Table 10 shows the two-step estimates of the coefficients of the more general specification of the price update regressions considered in this paper. A few comments are in order. First, the incorporation of the additional variables that control for the endogeneity of the underwriter choice leads to a small increase in theR2
of the regressions. The improvement in the in-sample fit ranges from 0.38% for “Others” to 12.12% for Pactual. This is not surprising in view of the weak association between the explanatory variables and the underwriter choice revealed in Table 9. Second, the magnitudes of the coefficients on market return are comparable to those reported in Table 6 and the associatedtstatistics are marginally altered. Third, in spite of the change of sign of most of the coefficients on the logarithm of assets and on the interaction between the latter and the dummy for banks, they remain statistically insignificant. Fourth, when we take into account the possible endogeneity of underwriter choice, the coefficient on the dummy for secondary shares turns out to be statistically insignificant for “Others”.
Table 10: Two-Step Estimates of the Impact of Public Information on the Price Update
Credit Suisse Pactual Others Coefficient Coefficient Coefficient (t-statistic) (t-statistic) (t-statistic)
Constant -73.445 1.629 -39.844 (-0.624) (0.106) (-0.556)
MKT 0.540 1.262 0.946
(0.716) (2.219) (2.397)
Secondary Offer 14.481 3.859 23.542 (0.795) (0.481) (0.813)
Log(Assets) -10.327 -7.754 -1.382 (-0.506) (-1.040) (-0.177) Log(Assets)* 11.757 5.111 1.630 Financial Sector (0.543) (0.951) (0.418)
R2
0.111 0.242 0.266
6.4. Two-Step Estimates of the Impact of Public and Private Information on Initial
Returns
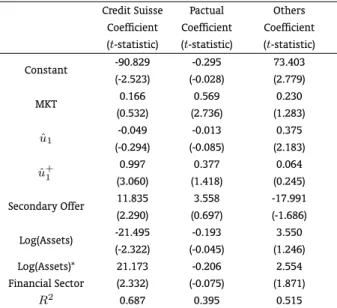
Table 11 considers the impact of the correction for endogeneity on the conclusions regarding the initial return equation. The effects of public and private information disclosed during the book-building period on first-day returns are not altered, both in terms of magnitude and of statistical significance. The main consequence is on the impact of secondary shares in the offering, which switches sign for “Others” and turns out to be statistically significant only for Credit Suisse. Finally, we see that the coefficients on both the logarithm of assets and on the interaction between the latter and the dummy for banks for Credit Suisse turn out to be statistically significant and much greater in magnitude than the coefficients reported in Table 8.
Table 11: Two-Step Estimates of the Impact of Public and Private Information on Initial Returns
Credit Suisse Pactual Others Coefficient Coefficient Coefficient (t-statistic) (t-statistic) (t-statistic)
Constant -90.829 -0.295 73.403 (-2.523) (-0.028) (2.779)
MKT 0.166 0.569 0.230
(0.532) (2.736) (1.283)
ˆ
u1 -0.049 -0.013 0.375
(-0.294) (-0.085) (2.183)
ˆ u+
1
0.997 0.377 0.064
(3.060) (1.418) (0.245)
Secondary Offer 11.835 3.558 -17.991 (2.290) (0.697) (-1.686)
Log(Assets) -21.495 -0.193 3.550 (-2.322) (-0.045) (1.246) Log(Assets)* 21.173 -0.206 2.554 Financial Sector (2.332) (-0.075) (1.871)
R2 0.687 0.395 0.515
This table presents the two-step estimates of the regression of the initial return on the Bovespa market return (MKT) during the book-building period, on a dummy variable for secondary shares, which assumes the value of one if the offering contains secondary shares and zero otherwise, on the logarithm of assets, on the interaction between the logarithm of assets and a dummy for banks, which takes on the value of one if the issuer is a bank and zero otherwise, onuˆ1, the residual from the price update regression on MKT, on the dummy for secondary shares, on the logarithm of assets and on the interaction between the logarithm of assets and a dummy for banks, and on uˆ+
1, which equals
7. CONCLUSION
This paper investigated the process whereby the offer price is set and whether IPO initial returns in Brazil are predictable on the basis of public and private information revealed during the book-building period. The results suggest that the underwriter partially incorporates the public and private infor-mation learned during the waiting period into the offer price, rewarding both the informed and unin-formed investors at the expense of the issuer. Positive and negative market returns during the book-building period affect the ultimate offer price and first-day returns symmetrically. The effect of private information on initial returns, by contrast, is strongly asymmetric. Only positive revisions into the offer price with respect to the midpoint of the initial price range help predict first-day returns.
The market return and price update alone explains almost half of the cross-sectional variation of first-day returns in the sample of 129 IPO’s used in this paper. Other firm and deal specific character-istics known at the time of the filing of the preliminary prospectus are not useful in predicting initial returns. The exception is the presence of secondary shares in the offering. There is evidence that un-derwriters are more conservative in setting the initial price range of IPO’s containing secondary shares and more reluctant to revise their final offer price upward, which leads to initial returns that are, on average, 6% higher than those of IPOs containing only primary shares.
It is reassuring that the main conclusions are not altered when the potential endogeneity of the lead underwriter is taken into account. However, a more thoroughly investigation of this aspect of the IPO pricing process is clearly desirable in view of the poor explanatory power of the independent variables in the MNP model fitted to explain the choice of the investment bank.
BIBLIOGRAPHY
Aldrighi, D., Afonso, L., Capparelli, G., & dos Santos, A. (2010). As ofertas públicas iniciais na Bovespa no período recente: Características das empresas, estrutura de propriedade e de controle, e desempenho. Salvador, XXXVIII Encontro Nacional de Economia ANPEC.
Benveniste, L. & Spindt, P. (1989). How investment bankers determine the offer price and allocation of new issues.Journal of Financial Economics, 24:343–361.
Carter, R. & Manaster, S. (1990). Initial public offerings and underwriter reputation. Journal of Finance, 45(4):1045–1067.
Cassotti, F. & Motta, L. (2008). Oferta pública inicial no Brasil (2004-2006): Uma abordagem da avaliação através de múltiplos e do custo de capital próprio.Revista Brasileira de Finanças, 6(2):157–204.
Cornelli, R. & Goldreich, S. (2003). Bookbuilding: How informative is the order book? Journal of Finance, 58(4):1415–1443.
Edelen, R. & Kadlec, G. (2005). Issuer surplus and the partial adjustment of IPO prices to public infor-mation. Journal of Financial Economics, 77:347–373.
Hanley, K. (1993). The underpricing of initial public offerings and the partial adjustment phenomenon.
Journal of Financial Economics, 34:231–250.
Heckman, J. (1979). Sample selection bias as a specification error. Econometrica, 47(1):153–161.
Ibbotson, R. (1975). Price performance of common stock new issues. Journal of Financial Economics, 2:235–272.
Loughran, T. & Ritter, J. (2002). Why don’t issuers get upset about leaving money on the table in IPOs?
Loughran, T. & Ritter, J. (2004). Why has IPO underpricing changed over time? Financial Management, 33(3):5–37.
Lowry, M. & Schwert, G. (2004). Is the IPO Pricing Process Efficient? Journal of Financial Economics, 71:3–26.
Ritter, J. & Welch, I. (2002). A review of IPO activity, pricing, and allocations. Journal of Finance, 57(4):1795–1828.
Rock, K. (1986). Why new issues are underpriced.Journal of Financial Economics, 15:187–212.
Rossi Jr, J. & Marotta, M. (2010). Equity marketing timing: Testando através de IPO no mercado brasileiro.
Revista Brasileira de Finanças, 8(1):85–101.
