The relation between dielectric breakdown and transported power
density in high-voltage transmission lines
(A rela¸c˜ao entre ruptura diel´etrica e densidade de potˆencia transportada em linhas de transmiss˜ao de alta tens˜ao)
A. Heilmann
1,2, C.A. Dartora
31
Instituto Tecnol´ogico Simepar, Curitiba, PR, Brasil. 2
Faculdade Educacional Arauc´aria, Arauc´aria, PR, Brasil. 3
Departamento de Engenharia El´etrica, Universidade Federal do Paran´a, Curitiba, PR, Brasil. Recebido em 16/6/2014; Aceito em 13/8/2014; Publicado em 23/10/2014
Three-phase electric power systems can transmit large amounts of power, typically in the range of 2000 MVA with a voltage of 765 kV. Under such extreme conditions, the air surrounding the transmission lines is ionized, which significantly increases the conductivity. The present contribution proposes a simple model which allows one to estimate the ionization and the electric conductivity of the air as a function of the power density flowing in the power line system. Near the transmission lines, it is shown that the air conductivity is increased by several orders of magnitude relative to normal conditions. In this scenario, the dielectric breakdown is favored by avalanche processes and lightning stroke probability is significantly increased.
Keywords: air ionization, transmission lines, lightning.
Sistemas el´etricos de potˆencia trif´asicos podem transmitir grandes quantidades de energia, tipicamente na faixa de 2000 MVA com uma tens˜ao de 765 kV. Sob tais condi¸c˜oes extremas, o ar em torno das linhas de trans-miss˜ao se ioniza, aumentando significativamente a sua condutividade. A presente contribui¸c˜ao prop˜oe um modelo simples, que permite estimar a ioniza¸c˜ao do ar e a condutividade el´etrica, como uma fun¸c˜ao da densidade de potˆencia que flui no sistema de linhas de energia. Perto das linhas de transmiss˜ao, mostra-se que a condutividade do ar ´e aumentada por v´arias ordens de grandeza em rela¸c˜ao ´as condi¸c˜oes normais. Neste cen´ario, a ruptura diel´etrica ´e favorecida por processos de avalanche e a probabilidade de impacto de relˆampagos ´e discutida de forma significativa.
Palavras-chave: ioniza¸c˜ao do ar, linhas de transmiss˜ao, descargas atmosf´ericas.
1. Introduction
The environmental conditions are important to esti-mate the frequency of lightning strokes incidence on transmission lines [1]. The overvoltage produced by lightning in transmission lines is among the most im-portant causes of shutdown. The increase of the elec-tric field near the power transmitting conductors is the main cause of lightning. It induces corona-discharges, a phenomenon in which the air surrounding the power conductors ionises, leading to a significant increase of air conductivity near the transmission line. Astinfeshan
et al.[2] considered the influence of corona-discharge on overvoltages produced by lightning strokes terminating on the transmission line. Using finite-difference time-domain (FDTD) electromagnetic calculations, Thanget al.[1] calculated the critical electric field value for which a corona-discharge starts. Indeed, corona discharge is
affected by a large number of parameters, such as con-ductor diameter, concon-ductor surface condition, weather, altitude, temperature and line voltage [3]. The ionised air surrounding the conductor acts as a virtual conduc-tor and increases the effective diameter of the metallic conductor [4, 5].
For the dielectric breakdown to take place in a given insulator, the applied electric field must exceed a criti-cal value at which the medium starts to behave as a con-ductor. The critical electric field of the air is strongly influenced by the air density and atmospheric condi-tions. Under normal conditions, the dielectric break-down of the air occurs at approximately 3 MV/m [4,5]. The critical electric field (Eo) on the surface of a
cylin-drical conductor of radiusrofor initiating a corona
dis-charge is approximately given by [5]
Eo= 2.594×10⁶m [
1 +
(
0.1269
r0.4346 o
)] ,
1
E-mail: mando [email protected].
wherem is a coefficient depending on the surface state of the conductor. A critical electric field on the sur-face of a conductor of radius ro = 5 mm, for
initiat-ing corona-discharge was determined to be E0 = 1.8
MV/m, usingm = 0.3. D’Alessandro and Gumley es-timated that the value of the corona radius is 30-38 cm from the surface of the conductor [4, 5].
The present contribution proposes a simple model which allows one to estimate air ionisation and electric conductivity as a function of the power density flowing in the power line system. Usually, the dielectric break-down is considered as a function of the total electric field near the transmission lines produced by the trans-mission line voltage superimposed to the atmospheric electric field. Under these assumptions, the influence of the electric current transported by the transmission line is being neglected. The theoretical model presented here considers the effect of the electromagnetic power density transported by the transmission lines in the nearby environment on the air ionisation, allowing to predict the increase of the air conductivity within the Drude model.
The content of this paper can be described as fol-lows: in Sections II and III we will briefly review the basic formulae of electric and magnetic fields generated by linear conductors above ground planes. In Section IV we will present the expression for the volumetric electromagnetic energy density. In Section V we will discuss the effects of electromagnetic energy density in the air ionisation, and finally, in the last Section a few conclusions and remarks are added.
2.
Electric fields produced by
three-phase conductors above ground
The three-phase transmission lines are modeled as an array of conductors above a ground plane, where
V(x,y) is the electric potential measured in volts, E(x,y) is the electric field, measured in V/m and
λ(x,y) is the linear charge density, measured in C/m. The electric field created by the transmission lines is superimposed to the local atmospheric electric field. Therefore, the larger the electric potentialV(x, y) of the transmission line conductors respective to the ground plane, the greater the electric field in the surrounding medium, increasing the corona-discharge effect near the transmission lines. The electric field produced by a sin-gle linear conductor loaded with a linear charge density
λin free space is given by
Eρ= λ
2πεoρb
aρ, (1)
where εo is the vacuum permissivity (8.854×10⁻¹²
F/m) andEρ is the electric field on conductor (V/m),
b
aρ is the unit vector pointing towards the radial
direc-tion in cylindric coordinates (ρ, ϕ, z).
Applying the method of images for an array of con-ductors above a perfectly conducting ground plane (see Fig. 1) and using the expression E = −∇V we can easily obtain the expression for the total electric field generated in a high-voltage three-phase power system
Etot = N ∑
k=1
Vokeiθk
ln(2.hk
ak
)(Ekxˆax+Ekyˆay),
Ekx = [
x x2+ (y−h
k)2 −
x x2+ (y+h
k)2 ]
,
Eky = [
(y−hk) x2+ (y−h
k)2 −
(y−hk) x2+ (y+h
k)2 ]
, (2)
where N = 3 is the number of conductors,i=√−1 is the imaginary unit,θis the relative phase of the conduc-tors (θ= 0,2π
3,− 2π
3 in three-phase system),hdifferent
height from the ground conductors, the distancesxand
y are horizontal and vertical axis, respectively, (Vo) is
the potential difference of a given conductor relative to the ground and ais the radius of the conductor.
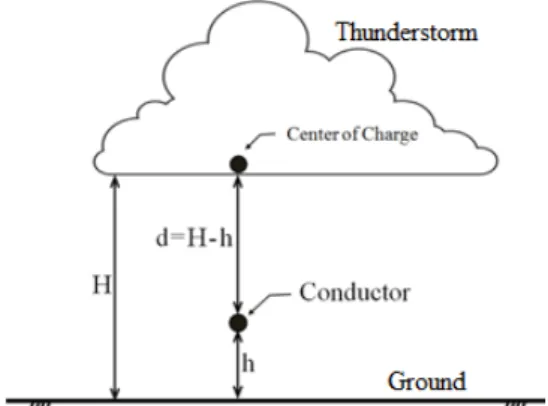
Figure 1 - Method of images to calculate the electric field of a linear conductor.
Figure 2 - Distribution of the heights of the phase conductor and the center of the cloud charges.
The effect of a storm cloud will be approximated by the presence of an atmospheric electric field created by a point charge located at the bottom of the storm cloud, situated at a distance dfrom the conductors
Eatm=
Qcos(θ) 2πεod2b
ar, (3)
where Eatm is the atmospheric local electric field (V/m), θ is the angle formed between the center of charge and conductor(in this caseθ≃0).
3.
Magnetic fields produced by
three-phase conductors above ground
The three-phase conductors studied here admit a vari-able electric current during peak of electricity supply. Ignoring the effects of lightning conductors, it is possi-ble to calculate the magnetic field intensity (H) in the transmission line from Ampere’s Law and the method of charge image. The result is
H =
N ∑
k=1 Ik.eiθk
2π (Hkxˆax+Hkyˆay),
Hkx = [
(y−hk)
(x2+ (y−h k)2)
+ y+h
(x2+ (y+h k)2)
] ,
Hky = [
x x2+ (y−h
k)2 −
x x2+ (y+h
k)2 ]
. (4)
The Poynting vectorS(measured in W/m2), which represents the power carried by the conductor per unit area, can be obtained from the equation below
Smean= 1
2ℜe(E×H
∗), (5)
whereH∗is the complex conjugate of the magnetic in-tensity vector H. Solving the equation for the mean power density transported along the transmission lines we have
Smean= 1
2ℜe(ExH ∗
y−EyHx∗)bz, (6)
corresponding to average power density in (W/m2),
ori-ented in the longitudinal direction of the conductor. To discuss the effects of a mean power density in transmis-sion lines, it is necessary to review the basic aspects of electromagnetic energy density, which is done in the following section.
4.
Volumetric electromagnetic energy
density
As the electric and magnetic fields can store energy, we can calculate the volumetric electromagnetic energy density in the region next of conductor. The total en-ergy density (u) in a region occupied by an electromag-netic wave isu=uE+uB. For plane electromagnetic
waves,EandB have the following relationship [7]
B=1
ckb×E. (7)
In Eq. (7), kb is a unitary vector in the propagation direction,c≈3×10⁸m/s is the speed of light.
There-fore the density of electromagnetic energy in (J/m3) is
given by
u= |S|
c , (8)
where |S| is the module of mean power density in (W/m2) [7]. The air will ionise when the density of
electromagnetic energy is sufficient to match the called ionisation potential expressed in (eV). The next section will analyze the behavior of electromagnetic energy den-sity (u) compared to the rate of air ionisation.
5.
Discussion and results
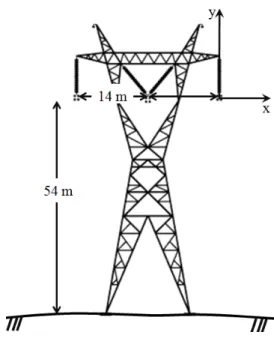
High-voltage transmission lines also transport large power densities, increasing the rate of air ionisation in the nearby region. It is assumed here that the three-phase conductors have radius of 6.0 cm, being approxi-mately equidistant 14 m and 54 m from the ground (see Fig. 3).
The center of charges from the cloud (H) is lo-cated 1500 m above the ground (see Fig. 4). Look-ing at Fig. 4, the dotted line represents the intensity of the electric field generated solely by the three-phase conductors, assuming a transmission line potential of 765 kV.
The solid line represents the intensity of the electric field generated by the conductors superimposed to the critical atmospheric electric field (2023 kV/m), which is capable of producing corona-discharges. The electric fields in the side conductors is minimal, but the electric field near central conductor increases to 1500 kV/m.
Figure 5 shows the behavior of the magnetic field, obtained byB =µ0H, for transmitted powers of 500,
Figure 3 - Tower profile of 765 kV transmission line.
Figure 4 - Resulting electric field on conductor with 765 kV.
Figure 5 - Magnetic field of conductors with 765kV, and total transmitted power of 500 MVA, 1000 MVA and 2000 MVA.
Figure 6 shows the mean power density for the cen-ter conductor of the 765kV transmission lines. The magnitude of the mean power density in the neighbor-hood of the conductors for a three-phase system is in the range of 5×10⁹ W/m2 for transmitted power of
2000 MVA. The distance around the line conductor in which the electric field exceeds 2200 V/m, at which the dielectric breakdown of the air takes place, is approxi-mately 20 cm.
Figure 6 - Mean power density for the center conductor of the transmission line 765 kV.
When the electric field is large enough, electrons are accelerated and collide with other atoms or molecules, increasing the number of charge carriers in the envi-ronment in an exponential manner. This process is called electron avalanche [8]. As the corona-discharge on a transmission line is generated and sustained by the mechanisms of air ionisation, the air ionisation rate can be correlated with the density of electromagnetic energy around the conductor.
If the electric field in the conductor is enhanced by the electric field of the atmosphere, electrons are ac-celerated and collide with other atoms, releasing more electrons, increasing the amount of electrons in the en-vironment. This process is called ionisation through particle collision [8, 9].
In what follows, the kinetic theory of gases will be considered, assuming that the air composition is 78% (minimum ionisation energy required of 15.6 eV) Ni-trogen and 21% (12.1 eV) Oxygen, the mean ionisation energy is 14.7 eV [10]. When an electron gets enough energy and collides with other electrons, it will create an avalanche effect, initiating the process of air ioni-sation [11]. Considering the number of molecules per cubic meter near the conductor, a good estimate of the air conductivity in the neighborhood of the conductor will be made.
Under standard atmospheric conditions and before dielectric breakdown, i.e., without the existence of lightning channels, the air conductivity (in S/m) is in the range 10−15< σ
air <10−11[12, 13]
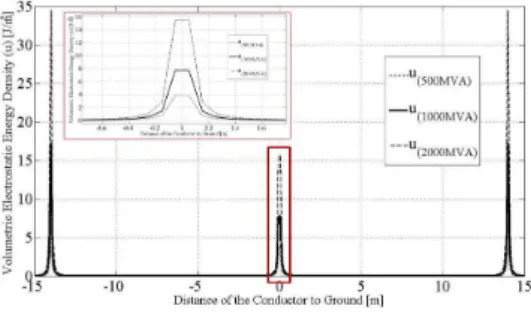
For a transmission line carrying a total power of 2000 MW, the density of electromagnetic energy around the conductor in J/m3, given by Eq. (7), is shown in
Fig. 7. For a conductor of radius 6 cm, the electro-magnetic energy near the surface of the conductor is approximately 16 J/m3.
Considerging a volume of about 1 m3 of air in the
that 0.16 J of energy (≃1×10¹⁸ eV) is lost in corona
effect.
Figure 7 - Volumetric energy density (J/m3
) of the transmission line 765 kV.
Making the ratio of the total electromagnetic energy contained in 1 m3 of air and the average ionisation en-ergy per molecule of air (approximately 14.7 eV), the number of generated free electrons (e) per cubic meter is of the order of 6.7938×10¹⁶. This number is in fairly
good agreement with the result of Ref. [14], showing that the electron density in return strokes is between 1013 and 1019 e/m3.
Assuming that the Drude model is valid, it is pos-sible to estimate the conductivity in (S/m) in terms of intrinsic properties of air [12]. The Drude conductivity is given by
σ= ne¯
2τ m¯e
, (9)
where n = 6.7938×10¹⁶is the number of free electrons
per cubic meter, ¯e = 1.6020×10⁻¹⁹ C is the electron charge, me = 9.1193×10⁻³¹ kg is the electron mass
and τ is the averaged time between collisions. For the air a good estimate for the averaged free time is τ = 5.0311×10⁻¹² s, leading to an electric conductivity
σair = 0.009617 S/m. Such a value is about 8 orders
of magnitude greater than the conductivity of air in standard atmospheric conditions.
According to the prestrike condition theorized by Griscom (1958), the return-stroke current is anticipated by the transfer of the charge around the power line conductors. Therefore, the enhanced air conductivity near the transmission line conductors allows for pro-duction of small filamentary current steps known as
Stepped Leader Initiation, generating sparks [11, 14]. An upward-moving discharge would meet the negative leader at some point above ground and, at that point the return stroke would be initiated. A smaller field is probably necessary to launch an upward-moving dis-charge from a lightning rod, a TV antenna, or trans-mission line tower, according to the literature [11, 15].
Although some values are roughly estimated, the magnitude of results confirm a larger air ionisation in the neighborhood of the conductors, which results in i) runaway process of breakdown and ii) a region near the conductor which guarantees the corona-discharge effects, acting as a precursor for lightning to occur (see
Fig. 8). A return stroke from the conductor can be cre-ated when the electric field reaches the critical value, which can be interpreted as the upward leader in a “pre-ionised” channel.
Figure 8 - Spark caused by the high conductivity of the air near the surface of power line conductor in 765 kV.
As a final remark, it is debatable to observe the re-sults of electric field measurements (using Field Mills sensors) under transmission lines, in order to evaluate the effect of the electric field of the three-phase conduc-tors in relation to the atmospheric local electric field. These results may influence the perspective of transmis-sion line projects and correct classification of electric potential available in a system.
6.
Conclusion
In summary, using a very simple model, it was shown that standard electric power transmission lines oper-ating in three-phase mode with nominal transmitted powers as large as 2000 MVA and voltages of 765 kV can produce highly favorable conditions for air ioniza-tion. The model is based on the power density flowing in the power system, allowing one to estimate the air ionization and electric conductivity of the air in the neighborhood of high power conductors. It was shown that the air conductivity can be increased by several orders of magnitude near the transmission line system, relative to normal conditions. In this scenario, the di-electric breakdown is favored by avalanche processes and lightning stroke probability is significantly raised.
Acknowledgments
A. Heilmann would like to acknowledge SIMEPAR and FACEAR for financial support. C.A. Dartora acknowl-edges CNPq for partial financial support.
References
[1] T.H. Thang, Y. Baba, N. Nagaoka, A. Ametani, J. Takami, S. Okabe and V.A. Rakov, in: Symposium on Electromagnetic Compatibility, China (2010).
[3] F. D’Alessandro and J.R. Gumley, Journal of Electro-statics50, 279 (2001).
[4] N.L. Aleksandrov, E.M. Bazelyan and Yu P. Raizer, Atmospheric Research76, 307 (2005).
[5] V.L. Granatstein and G.S. Nusinovich, Journal of Ap-plied Physics108, 063304 (2010).
[6] D.R. Macgorman and W.D. Rust, The Electrical Na-ture of Storms (Oxford University Press, New York, 1998).
[7] J.D. Jackson, Classical Electrodynamics (Wiley, New York, 1998), 3rd ed.
[8] C.K.C. Arruda, Modeling of Corona Effect in Direct Current Transmission Lines (UFRJ/COPPE, Rio de Janeiro,(2012).
[9] R. Morrow and J.J. Lowke, Journal of Physics D: Ap-plied Physics30, 614 (1997).
[10] J. Gross, Mass Spectrometry: A Textbook (Springer, New York, 2011), 2nd ed.
[11] M.A. Uman, Lightning (McGraw-Hill, New York, 1984).
[12] C. Kittel, Introduction to Solid State Physics (Wiley, New York, 2004), 8th ed.
[13] V.A. Rakov and M.A. Uman, Lightning Physics and Effects (Cambridge University Press, Cambridge, 2006).
[14] N. Kolcio, V. Caleca, S. Marmaroff and W.L. Gregory, IEEE Transactions on Power Apparatus and Systems PAS-88, n. 9, 1343 (1969).