Photosynthetic characteristics of the freshwater red alga
Batrachospermum delicatulum
(Skuja) Necchi & Entwisle
Orlando Necchi Júnior1,2 and Abner H.S. Alves1
Received: March 03, 2003; Accepted: August 06, 2004
RESUMO– (Características fotossintéticas da alga vermelha continental Batrachospermum delicatulum (Skuja) Necchi & Entwisle).
Seis populações da alga vermelha Batrachospermum delicatulum (Skuja) Necchi & Entwisle, incluindo gametófito e estágio ‘Chantransia’, foram analisadas em condições de campo e cultura aplicando as técnicas de fluorescência da clorofila e oxigênio dissolvido. Parâmetros derivados das curvas fotossíntese-irradiância indicaram adaptação a baixa irradiância em todas populações, que foi caracterizada por fotoinibição, baixos valores de Ik e Ic e altos valores de α. Dados de ambas técnicas revelaram diferenças significativas entre populações e fases para a maioria dos parâmetros. A fotossíntese também respondeu diferentemente a variações de temperatura em cada população, com taxas semelhantes sob ampla faixa de temperatura. Nenhum padrão consistente foi encontrado quando a mesma população ou fase foi testada, sugerindo alta capacidade para ajustar o aparato fotossintético a distintas condições de temperatura e irradiância. Experimentos de pH mostraram tendência decrescente sob pH mais alto ou taxas maiores em pH 6,5 sugerindo, respectivamente, maior afinidade por carbono inorgânico como CO2 ou uso indistinto de bicarbonato e CO2. O padrão de variação diurna observado concorda com o de macroalgas marinhas e algumas rodófitas continentais, consistindo de dois picos: o primeiro (geralmente maior) durante a manhã e o segundo (tipicamente menor) à tarde. As características fotossintéticas de B. delicatulum (Skuja) Necchi & Entwislemostraram amplas respostas à irradiância, temperatura e pH/carbono inorgânico, refletindo sua ampla tolerância à estas variáveis, que provavelmente contribui para sua ampla distribuição espacial e temporal.
Palavras-chave: Batrachospermum, fotossíntese, irradiância, pH, ritmo diário, temperatura
ABSTRACT– (Photosynthetic characteristics of the freshwater red alga Batrachospermum delicatulum (Skuja) Necchi & Entwisle). Six
populations of the freshwater red alga Batrachospermum delicatulum (Skuja) Necchi & Entwisle, including gametophyte and ‘Chantransia’ stage, were analysed in culture and natural conditions applying chlorophyll fluorescence and oxygen evolution. Parameters derived from the photosynthesis-irradiance curves indicated adaptation to low irradiance for all populations, which was characterized by photoinhibition, low values of Ik and Ic and high values of α. Data from both techniques revealed significant differences among populations and phases for most photosynthetic parameters. Similarly, photosynthesis responded differently to variations in temperature in each population with similar rates under a wide range of temperature. No consistent pattern was found when the same population or phase was tested, suggesting high capacity to adjust the photosynthetic apparatus to distinct conditions of irradiance and temperature. pH experiments showed a decreasing trend towards higher pH or higher rates at pH 6.5, suggesting, respectively, higher affinity to inorganic carbon as CO2 or indistinct use of bicarbonate and CO2. The diurnal pattern of photosynthesis essentially agree with that for seaweeds and freshwater red algae, consisting of two peaks: a first (generally higher) during the morning and a second (typically lower) in the afternoon. Photosynthetic characteristics of B. delicatulum (Skuja) Necchi & Entwisleexhibited a wide range of responses to irradiance, temperature and pH/inorganic carbon, reflecting its wide tolerance to these variables, which probably contributes to its wide spatial and temporal distribution.
Key words: Batrachospermum, photosynthesis, irradiance, pH, diurnal rhythm, temperature
1 Universidade Estadual Paulista, Departamento de Zoologia e Botânica, Rua Cristóvão Colombo, 2265. CEP 15054-000, São José do Rio
Preto, SP, Brasil
2 Corresponding Author: orlando@dzb.ibilce.unesp.br
Introduction
The temperature and light regime have been recognized as major environmental factors affecting distribution and seasonality (Sheath 1984; Sheath & Hambrook 1990; Necchi et al. 1999), as well as growth,
pigment content and photosynthetic characteristics of freshwater Rhodophyta (Zucchi & Necchi 2001;
Necchi & Zucchi 2001). Despite the recognized importance of light and temperature on metabolism and ecological distribution of these algae, photosynthesis studies are few and sparse, particularly those focusing on inter-populational variations of a single species.
Kaczmarczyk & Sheath (1991) analyzed the effect of the light regime (irradiance and spectral
Batrachospermum boryanum Sirodot and concluded
that the alga was equally productive under most of the visible spectrum. Karsten et al. (1993) described the
photosynthesis rates of two freshwater and two marine isolates of Bostrychia moritziana (Kützing) J. Agardh.
Leukart & Hanelt (1995) reported the photosynthesis-irradiance (PI) curves and their respective parameters for some stream macroalgae, including three red algal species. Both studies indicate characteristics of shade plants, e.g. low compensation and saturation irradiances and high photosynthetic efficiencies. More recently, Necchi & Zucchi (2001) investigated the responses of photosynthesis to temperature and irradiance in 15 populations of eight species of freshwater red algae in culture and natural conditions. Optimum temperatures for photosynthesis were variable among species and populations (10 to 25oC), whereas rates of dark
respiration exhibited an increasing trend with temperature, the highest values occurring at 20 to 25oC.
Parameters derived from PI curves indicated adaptation to low irradiance for all freshwater red algae tested, including low saturation and compensation points, and photoinhibition.
The interaction between pH and the form of inorganic carbon can greatly influence productivity and distribution of freshwater red algae (Sheath 1984), whereas the restriction or preference of some species to specific pH ranges can be related to the form of inorganic carbon. Raven & Beardall (1981) and Raven
et al. (1982) analyzed the sources of inorganic carbon
in Batrachospermum sp. and Lemanea mamillosa
Kützing, which utilized only free carbon dioxide and not bicarbonate as the carbon source. Necchi & Zucchi (2001) described the responses of photosynthesis to pH in eight species of freshwater red algae and showed best performances under pH 6.5 or 8.5 for all but one species, suggesting indistinct use of bicarbonate and free carbon dioxide or higher affinity for inorganic carbon as bicarbonate.
The existence of a general diurnal rhythm pattern in photosynthetic rates has been demonstrated for marine macroalgae (Ramus 1981) but little is known on freshwater red algae. Necchi & Zucchi (2001) investigated the diurnal variation in photosynthetic rates of four species and found a general pattern for all algae tested, which was characterized by two relatively clear peaks: a first (higher) during the morning and a second (lower) in the afternoon.
Raven (1994) made a theoretical study on the contribution of the ‘Chantransia’ stage to the gametophyte on the basis of a
physiological-hydrodynamic modelling of Lemaneafluviatilis. He
concluded that the ‘Chantransia’ stage has a negligible role in provisioning the growing gametophyte, and that its role is to occupy space with living biomass throughout the year and also in dispersal via production of monospores. Results for one population of
Batrachospermum delicatulum (Necchi & Zucchi
2001) revealed higher values in the gametophyte, but the difference was much lower than reported by Raven (1994) (two vs. 20 times). Although the arguments presented by Raven (1994) are logical, the physiological role of the ‘Chantransia’ stage needs to be better analysed, involving comparison of metabolic parameters (photosynthesis and respiration) in a representative number of populations of a same species.
Investigations using in vivo chlorophyll
fluorescence had proven to be a valuable tool for in situ estimates of photosynthesis in marine (Häder et al.
1998; Beer et al. 2000; Franklin & Badger 2001) and
freshwater macroalgae (Ensminger et al. 2001).
However, photosynthetic rates of freshwater red algae derived from chlorophyll fluorescence and from oxygen evolution have not been compared.
Despite the progress from previous investigations cited above, information is still scarce on inter-populational photosynthetic responses of an individual species of freshwater algae to irradiance and temperature, sources of inorganic carbon, and effects of diurnal changes. Data are mostly restricted to species comparisons and populations from tropical regions have been poorly investigated. This study was carried out to evaluate the photosynthetic performance in response to temperature, irradiance, pH/inorganic carbon and diurnal rhythm of representative populations of the freshwater red alga B. delicatulum. A comparative
analysis of field and culture populations was carried out, including the gametophyte and ‘Chantransia’ stage, using the techniques of chlorophyll fluorescence and oxygen evolution.
Material and methods
Six populations of B. delicatulum were analyzed
(Tab. 1-2), including three in culture conditions (three gametophytes and one ‘Chantransia’ stage), and three in field conditions (three gametophytes and two ‘Chantransia’ stages), both collected in the northwest region of São Paulo State (20o18’-20o51’S and
49o13’-49o46’W).
samples of field populations were collected or measured (noon ± 2 h) at the end of the typical growth period in this region (September to October, Necchi 1993, 1997). The same populations were tested, whenever possible, under field and culture conditions in order to evaluate differences in the photosynthetic parameters. However, in some cases measurements were not reliable or feasible. Isolation into culture and measurements of environmental data (Tab. 1) followed procedures described in previous studies (Necchi & Zucchi 1997; Necchi et al. 1999, respectively).
Two techniques were applied: oxygen evolution
and in vivo chlorophyll fluorescence. Experiments
using oxygen evolution followed the general procedures described in a previous study (Necchi & Zucchi 2001). Photosynthesis and dark respiration rates were determined by changes in oxygen concentration using the light and dark bottles technique (Littler & Arnold 1985; Thomas 1988). Initial and final oxygen concentrations of incubated samples were measured with an oxygen meter (Yellow Springs Instruments, model 5000), equipped with a self-stirring probe, and exchange rates calculated using the formulae of Littler & Arnold (1985). Algae were incubated in 100ml borosilicate glass bottles (98.5% transparency) with
orbital agitation (100 ± 5rpm) and digital temperature control. Frontal illumination was supplied by one to three cool-white fluorescent lamps (Osram 15W). Dark bottles were covered with thick black plastic. In order to prevent inorganic carbon depletion during incubations, 2mM NaHCO3 (10ml l-1) was supplied
three times to culture media or stream water.
Photosynthesis-irradiance (PI) curves were measured under constant temperature (20 ± 0.5oC)
using eight increasing irradiances from 0 to 425µmol m-2 s-1. These are within the saturation ranges
previously reported for freshwater red algae (Kremer 1983; Leukart & Hanelt 1995; Necchi & Zucchi 2001). Incubation lengths were 30 min for each irradiance. Parameters from the PI curves were calculated using the equation proposed by Platt et al. (1980), which
includes a photoinhibition parameter because all freshwater red algae exhibited photoinhibition in a previous study (Necchi & Zucchi 2001).
Chlorophyll fluorescence was measured using a Diving-PAM underwater fluorometer (Walz, Effeltrich, Germany). Apices (gametophytes) or entire algal thalli (‘Chantransia’ stage) were placed directly on the tip of the fluorometer fibreoptic using the supplied magnet sample holder. Rapid light curves (White & Critchley
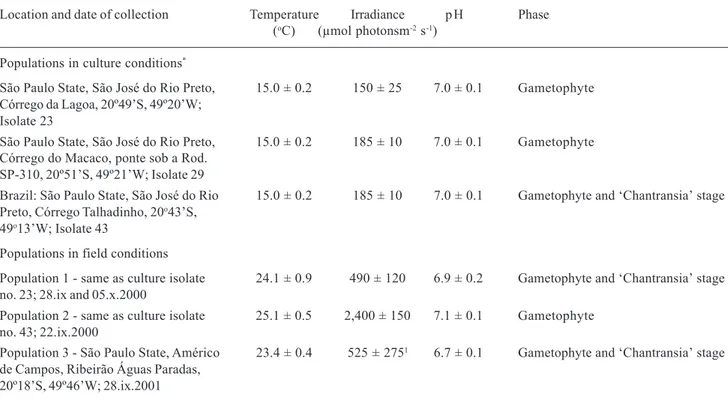
Table 1. Location, collection dates and environmental or culture maintenance conditions of the populations of Batrachospermum
delicatulum (Skuja) Necchi & Entwisle analysed in this study. Data are expressed as means ± standard-deviations (n = 3, except for
irradiance n = 5).
Location and date of collection Temperature Irradiance p H Phase (oC) (µmol photonsm-2 s-1)
Populations in culture conditions*
São Paulo State, São José do Rio Preto, 15.0 ± 0.2 150 ± 25 7.0 ± 0.1 Gametophyte Córrego da Lagoa, 20º49’S, 49º20’W;
Isolate 23
São Paulo State, São José do Rio Preto, 15.0 ± 0.2 185 ± 10 7.0 ± 0.1 Gametophyte Córrego do Macaco, ponte sob a Rod.
SP-310, 20º51’S, 49º21’W; Isolate 29
Brazil: São Paulo State, São José do Rio 15.0 ± 0.2 185 ± 10 7.0 ± 0.1 Gametophyte and ‘Chantransia’ stage Preto, Córrego Talhadinho, 20o43’S,
49o13’W; Isolate 43
Populations in field conditions
Population 1 - same as culture isolate 24.1 ± 0.9 490 ± 120 6.9 ± 0.2 Gametophyte and ‘Chantransia’ stage no. 23; 28.ix and 05.x.2000
Population 2 - same as culture isolate 25.1 ± 0.5 2,400 ± 150 7.1 ± 0.1 Gametophyte no. 43; 22.ix.2000
Population 3 - São Paulo State, Américo 23.4 ± 0.4 525 ± 2751 6.7 ± 0.1 Gametophyte and ‘Chantransia’ stage
de Campos, Ribeirão Águas Paradas, 20º18’S, 49º46’W; 28.ix.2001
1999) consisted of the fluorescence responses to eight increasing irradiances from 0 to 690µmol m-2 s-1, using
the “light curve” option of the Diving-PAM. A halogen lamp provided actinic and saturating-pulse light. The exposure time at each irradiance was 15s, each separated by a saturating flash (0.8s, ~6,000µmol m-2 s-1).
The illumination periods of rapid light curves are too short to achieve true steady-states but provide sound information on the overall photosynthetic performance of a plant (White & Critchley 1999). Two main parameters were determined from each sample: 1) effective quantum yield of photosystem II (PSII),
∆F/Fm’, where: ∆F = Fm’- Ft; Fm’ - maximal fluorescence of an illuminated sample; Ft - transient fluorescence (Schreiber et al. 1994); 2) relative
electron transport rate (rETR). As the amount of absorbed irradiance by PSII in an optical cross section (generally assumed as 0.84), could not be measured by each alga tested, rETR was calculated as ∆F/Fm’ x irradiance (according to Kromkamp et al. 1998), where
irradiance is the actinic irradiance in µmol m-2 s-1.
The calculations and terminology followed Schreiber et al. (1994) and van Kooten & Snel (1990),
respectively. PI curves were generated on the basis of rETR and the respective parameters were calculated applying the equation of Platt et al. (1980):
photosynthetic efficiency (αETR), Pmax (rETRmax), saturation parameter (Ik) and photoinhibition parameter (βETR). The values of α were determined by linear fitting using the three first points of the rETR versus irradiance curve (Conde-Álvarez et al. 2002).
Five temperatures were tested (10, 15, 20, 25 and 30oC) including the ranges reported for freshwater red
algae in this region (Necchi 1993; Necchi et al. 1999).
Incubations were made in increasing order of
temperature under constant irradiance
(70µmol m-2 s-1). This irradiance was chosen because
it is an intermediary value in the range of the saturation parameter (Ik) found in P-I curves for the populations
of B. delicatulum analysed in this and a previous study
(10-90µmol m-2 s-1, Necchi & Zucchi 2001).
Immediately after incubations (length of 1 hour), specimens were measured for chl fluorescence. Incubations for pH and diurnal rhythm were also conducted with this same constant irradiance and length, under temperature of 20 ± 0.5 oC. The pH values tested
were 4.0, 6.5 and 8.5, based on the typical relationship of pH and inorganic carbon form in freshwater, as follows (Wetzel & Likens 1991): pH 4.0 ca. 100% of CO2/H2CO3; pH 6.5 ca. 50% of both CO2 and HCO3-;
pH 8.5 ca.100% of HCO3-. pH was adjusted by addition
of 0.5 N HCl or KOH to the culture media or stream water samples.
Data were analyzed using Student’s t test or one way analysis of variance (ANOVA), followed by a multiple comparison Newman-Keuls test (Zar 1999) to test for significant differences (p<0.05) in photosynthetic parameters among the populations/ phases and treatments (temperature, irradiance, pH and time of the day). Relationships among photosynthetic parameters were evaluated with the Pearson moment-product correlation coefficient (Zar
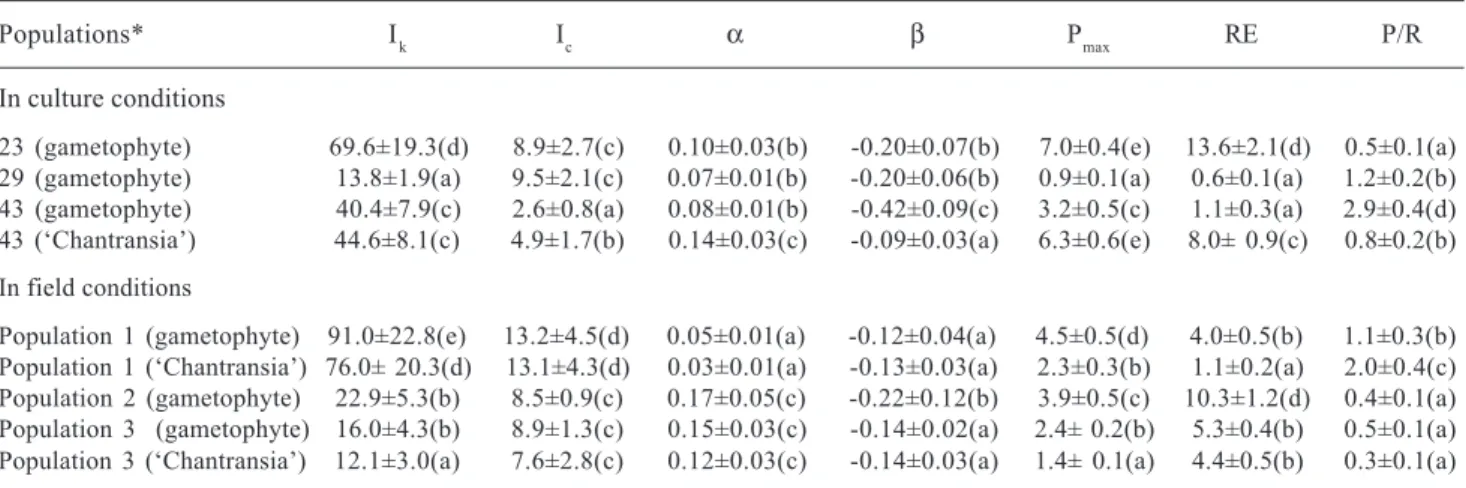
Table 2. Parameters of the photosynthesis versus irradiance curves for the populations of Batrachospermum delicatulum (Skuja) Necchi
& Entwisle measured by oxygen evolution. Data (means ± standard-deviations, N = 5) are expressed as: mg O2 g-1 dry weigth h-1 for
maximal photosynthetic rate (Pmax) and dark respiration (RE); µmol photons m-2 s-1 for compensation (I
c) and initial saturation (Ik)
irradiances; mg O2 g-1 dry weight h-1 (µmol photons m-2 s-1)-1 for photosynthetic efficiency (α) and photoinhibition parameter (β). P/R
represents the ratio of Pmax/dark respiration. Distinct letters indicate significant differences (p<0.05) by Newman-Keuls test.
Populations* Ik Ic α β Pmax RE P/R
In culture conditions
23 (gametophyte) 69.6±19.3(d) 8.9±2.7(c) 0.10±0.03(b) -0.20±0.07(b) 7.0±0.4(e) 13.6±2.1(d) 0.5±0.1(a) 29 (gametophyte) 13.8±1.9(a) 9.5±2.1(c) 0.07±0.01(b) -0.20±0.06(b) 0.9±0.1(a) 0.6±0.1(a) 1.2±0.2(b) 43 (gametophyte) 40.4±7.9(c) 2.6±0.8(a) 0.08±0.01(b) -0.42±0.09(c) 3.2±0.5(c) 1.1±0.3(a) 2.9±0.4(d) 43 (‘Chantransia’) 44.6±8.1(c) 4.9±1.7(b) 0.14±0.03(c) -0.09±0.03(a) 6.3±0.6(e) 8.0± 0.9(c) 0.8±0.2(b) In field conditions
Population 1 (gametophyte) 91.0±22.8(e) 13.2±4.5(d) 0.05±0.01(a) -0.12±0.04(a) 4.5±0.5(d) 4.0±0.5(b) 1.1±0.3(b) Population 1 (‘Chantransia’) 76.0± 20.3(d) 13.1±4.3(d) 0.03±0.01(a) -0.13±0.03(a) 2.3±0.3(b) 1.1±0.2(a) 2.0±0.4(c) Population 2 (gametophyte) 22.9±5.3(b) 8.5±0.9(c) 0.17±0.05(c) -0.22±0.12(b) 3.9±0.5(c) 10.3±1.2(d) 0.4±0.1(a) Population 3 (gametophyte) 16.0±4.3(b) 8.9±1.3(c) 0.15±0.03(c) -0.14±0.02(a) 2.4± 0.2(b) 5.3±0.4(b) 0.5±0.1(a) Population 3 (‘Chantransia’) 12.1±3.0(a) 7.6±2.8(c) 0.12±0.03(c) -0.14±0.03(a) 1.4± 0.1(a) 4.4±0.5(b) 0.3±0.1(a)
1999). Statistical tests were performed using Statsoft Statistica 6.0 software, whereas graphs and calculations from PI curve parameters were made using Microcal Origin 5.0.
Results
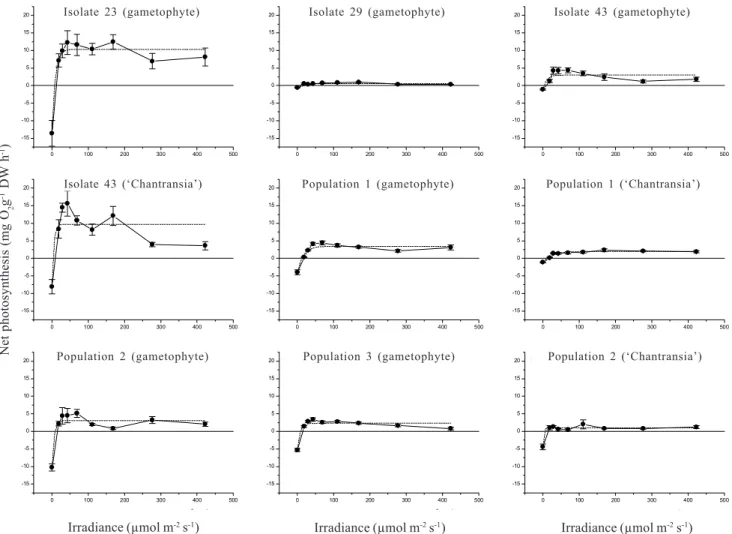
PI curves - PI curves based on oxygen evolution (Tab. 2, Fig. 1) were characterized (excluding atypical values) by photoinhibition (β-0.09), low values of Ik (<45µmol m-2 s-1) and I
c (< 10µmol m-2 s-1) and relatively
high values of α (0.07). Significant differences were found by ANOVA (F=2.5-12.1, p<0.05) and Newman-Keuls test (indicated by distinct letters on Tab. 2) among populations for most parameters in field and culture. Photoinhibition was observed in all populations of both phases (gametophyte and ‘Chantransia’), under either field or culture conditions (Tab. 2, Fig. 1). However, it was generally higher in culture than in field conditions
[-(0.20-0.22) × -(0.12-0.14)] with the exception of ‘Chantransia’ isolate 43 (-0.09) and gametophyte population 2 (-0.22). No clear trend was observed between culture and field populations for the other parameters. Significant differences were also observed between gametophyte and ‘Chantransia’ for most parameters, except in population 3 (Tab. 2). Gametophytes had higher photosynthetic rates, as indicated by Pmax, than ‘Chantransia’(1.7-2.0 times), except for ‘Chantransia’ in culture (isolate 43), which had rates 2.0 times higher than the gametophyte. Dark respiration rates were widely variable with no trend between gametophyte and ‘Chantransia’ and field or culture populations (Tab. 2, Fig. 1). P/R ratios ranged from low (0.5) to high (2.0) values with no clear trend for phases and culture or field populations (Tab. 2). Values of Ic, Ik and α were not associated with irradiances at the collecting sites or culture maintenance (Tab. 1-2).
Figure 1. Photosynthesis-irradiance curves for the populations of Batrachospermum delicatulum (Skuja) Necchi & Entwisle analysed
under field and culture conditions based on data of oxygen evolution. Bars indicate ± standard-deviation (N = 5 for net photosynthesis; N = 3 for dark respiration). Dotted lines represent the fitting curves by application of Platt et al. (1980) equation.
0 100 200 300 400 500
-15 -10 -5 0 5 10 15
20 Isolate 23 (gametophyte)
0 100 200 300 400 500
-15 -10 -5 0 5 10 15
20 Isolate 29 (gametophyte)
0 100 200 300 400 500
-15 -10 -5 0 5 10 15
20 Isolate 43 (gametophyte)
0 100 200 300 400 500
-15 -10 -5 0 5 10 15
20 Isolate 43 ('Chantransia')
0 100 200 300 400 500
-15 -10 -5 0 5 10 15
20 Population 1 (gametophyte)
0 100 200 300 400 500
-15 -10 -5 0 5 10 15
20 Population 1 ('Chantransia')
0 100 200 300 400 500
-15 -10 -5 0 5 10 15 20
2 1
Population 2 (gametophyte)
0 100 200 300 400 500
-15 -10 -5 0 5 10 15 20
2 1
Population 3 (gametophyte)
0 100 200 300 400 500
-15 -10 -5 0 5 10 15 20
2 1
Population 3 ('Chantransia')
Net
photosynthesis
(mg
O2
g
-1 DW
h
-1)
Irradiance (µmol m-2 s-1) Irradiance (µmol m-2 s-1) Irradiance (µmol m-2 s-1)
Isolate 23 (gametophyte) Isolate 29 (gametophyte) Isolate 43 (gametophyte)
Isolate 43 (‘Chantransia’) Population 1 (gametophyte) Population 1 (‘Chantransia’)
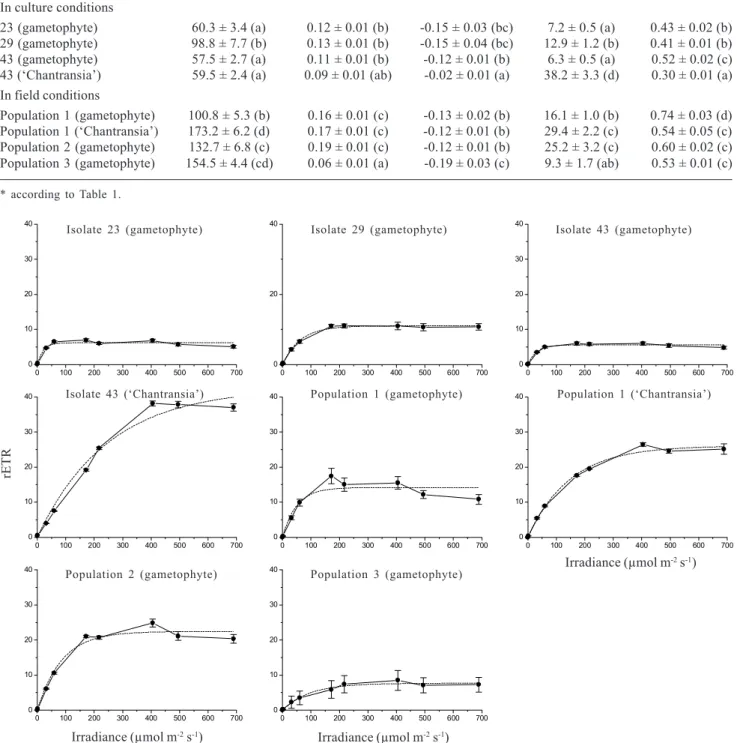
Table 3.Parameters of the photosynthesis versus irradiance curves for the populations of Batrachospermum delicatulum (Skuja) Necchi
& Entwisle measured by chlorophyll fluorescence. Data are expressed as means ± standard-deviations (N=5). Distinct letters indicate significant differences ((p<0.05) by Newman-Keuls test.
Populations* Ik α β Pmax ∆F / Fm’
In culture conditions
23 (gametophyte) 60.3 ± 3.4 (a) 0.12 ± 0.01 (b) -0.15 ± 0.03 (bc) 7.2 ± 0.5 (a) 0.43 ± 0.02 (b) 29 (gametophyte) 98.8 ± 7.7 (b) 0.13 ± 0.01 (b) -0.15 ± 0.04 (bc) 12.9 ± 1.2 (b) 0.41 ± 0.01 (b) 43 (gametophyte) 57.5 ± 2.7 (a) 0.11 ± 0.01 (b) -0.12 ± 0.01 (b) 6.3 ± 0.5 (a) 0.52 ± 0.02 (c) 43 (‘Chantransia’) 59.5 ± 2.4 (a) 0.09 ± 0.01 (ab) -0.02 ± 0.01 (a) 38.2 ± 3.3 (d) 0.30 ± 0.01 (a) In field conditions
Population 1 (gametophyte) 100.8 ± 5.3 (b) 0.16 ± 0.01 (c) -0.13 ± 0.02 (b) 16.1 ± 1.0 (b) 0.74 ± 0.03 (d) Population 1 (‘Chantransia’) 173.2 ± 6.2 (d) 0.17 ± 0.01 (c) -0.12 ± 0.01 (b) 29.4 ± 2.2 (c) 0.54 ± 0.05 (c) Population 2 (gametophyte) 132.7 ± 6.8 (c) 0.19 ± 0.01 (c) -0.12 ± 0.01 (b) 25.2 ± 3.2 (c) 0.60 ± 0.02 (c) Population 3 (gametophyte) 154.5 ± 4.4 (cd) 0.06 ± 0.01 (a) -0.19 ± 0.03 (c) 9.3 ± 1.7 (ab) 0.53 ± 0.01 (c)
* according to Table 1.
Figure 2. Photosynthesis-irradiance curves for the populations of Batrachospermum delicatulum (Skuja) Necchi & Entwisle analysed
under field and culture conditions based on data of chlorophyll fluorescence. Bars indicate ± standard-deviation (N = 5). Dotted lines represent the fitting curves by application of Platt et al. (1980) equation.
In comparison to data derived from oxygen evolution, PI curves based on chlorophyll fluorescence (Tab. 3, Fig. 2) also revealed photoinhibition (β-0.02) and relatively high values of photosynthetic efficiency
(α0.06), but much higher values of Ik (> 55µmol m-2 s-1). Significant differences were found
by ANOVA (F=2.8-25.1, p<0.05) and Newman-Keuls test (Tab. 3) among populations for most parameters
0 100 200 300 400 500 600 700 0
10 20 30 40
Isolate 23 (gametophyte)
0 100 200 300 400 500 600 700 0
20 40
Isolate 29 (gametophyte)
0 100 200 300 400 500 600 700 0
10 20 30 40
Isolate 43 (gametophyte)
0 100 200 300 400 500 600 700 0
10 20 30 40
Isolate 43 ('Chantransia')
0 100 200 300 400 500 600 700 0
10 20 30 40
Population 1 (gametophyte)
0 100 200 300 400 500 600 700 0
10 20 30 40
Population 1 ('Chantransia')
0 100 200 300 400 500 600 700 0
10 20 30 40
Population 2 (gametophyte)
0 100 200 300 400 500 600 700 0
10 20 30
40 Irradiance (µmol m
-2
s-1)
Population 3 (gametophyte)
Irradiance (µmol m-2 s-1) Irradiance (µmol m-2 s-1)
Irradiance (µmol m-2 s-1)
Isolate 23 (gametophyte) Isolate 29 (gametophyte) Isolate 43 (gametophyte)
Isolate 43 (‘Chantransia’) Population 1 (gametophyte) Population 1 (‘Chantransia’)
Population 2 (gametophyte) Population 3 (gametophyte)
in field and culture. Values of Ik and quantum yield were lower in culture than in field conditions, < 100 × > 100 µmol m-2 s-1 and 0.52 × 0.53, respectively
(Tab. 3) and were probably directly associated with irradiances at the collecting sites or culture maintenance (Tab. 1, 3). Significant differences were also observed between gametophyte and ‘Chantransia’ for most parameters, except for (Tab. 3). Pmax values were higher (> 2.0 times) in ‘Chantransia’ than in gametophyte, whereas the opposite trend was found for quantum yield.
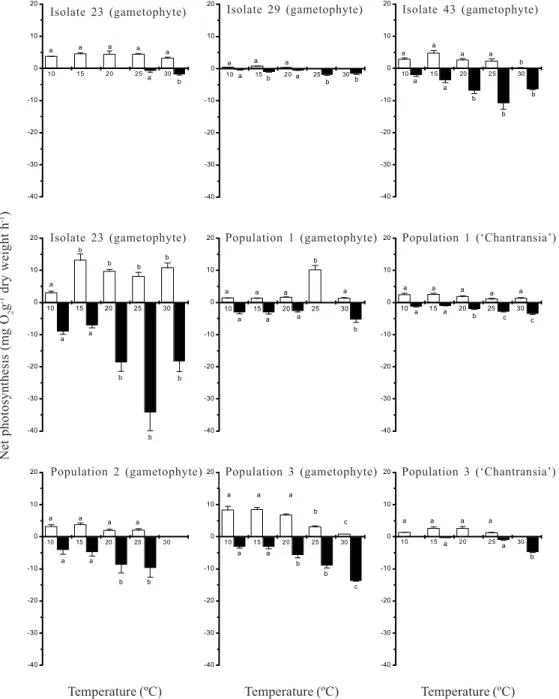
Responses to temperature - Rates of net photosynthesis responded differently to the variations in temperature for the distinct populations (Fig. 3). ANOVA revealed significant differences for net photosynthesis (F = 3.1-37.3, p <0.05) in response to temperature for isolate 43 (both phases) and populations 1 and 3 (gametophyte), with no clear peaks. No significant differences were found for the remaining populations. Rates of dark respiration were significantly different (F = 8.8-45.7, p <0.05) for all populations and had an increasing trend with temperature, with the
Figure 3. Rates of net photosynthesis and dark respiration under five temperatures for the populations of Batrachospermum delicatulum
(Skuja) Necchi & Entwisleanalysed under field and culture conditions based on data of oxygen evolution. Bars indicate ± standard-deviations (n = 5 for net photosynthesis; n = 3 for dark respiration). Different letters indicate significant differences (p <0.05) by Newman-Keuls test. = Net photosynthesis, = Dark respiration
10 15 20 25 30
-40 -30 -20 -10 0 10 20 b a a a a a a
Isolate 23 (gam etophyte)
10 15 20 25 30
-40 -30 -20 -10 0 10 20 b b a a b a a a
Isolate 29 (gam etophyte)
10 15 20 25 30
-40 -30 -20 -10 0 10 20 b a a a a b b b a a
Isolate 43 (gametophyte)
Net photosynthesis Dark respiration
10 15 20 25 30
-40 -30 -20 -10 0 10 20 b b b b b b b a a a
Isolate 43 ('Chantransia')
10 15 20 25 30
-40 -30 -20 -10 0 10 20 b a a a a a a a b
Population 1 (gametophyte)
10 15 20 25 30
-40 -30 -20 -10 0 10 20 c c b a a a a a a a
Population 1 ('Chantransia')
10 15 20 25 30
-40 -30 -20 -10 0 10 20
b b a a
a a a a
Tem perature (ºC) Temperature (ºC) Temperature (ºC)
Population 2 (gametophyte)
10 15 20 25 30
-40 -30 -20 -10 0 10 20 c b b a a c b a a a
Population 3 (gam etophyte)
10 15 20 25 30
-40 -30 -20 -10 0 10 20 a a b a a a a
Population 3 ('Chantransia')
Temperature (ºC) Temperature (ºC) Temperature (ºC)
Net
photosynthesis
(mg
O2
g
-1 dry
weight
h
-1)
Isolate 29 (gametophyte) Isolate 43 (gametophyte) Isolate 23 (gametophyte)
Isolate 23 (gametophyte) Population 1 (gametophyte) Population 1 (‘Chantransia’)
highest values under 25-30oC.
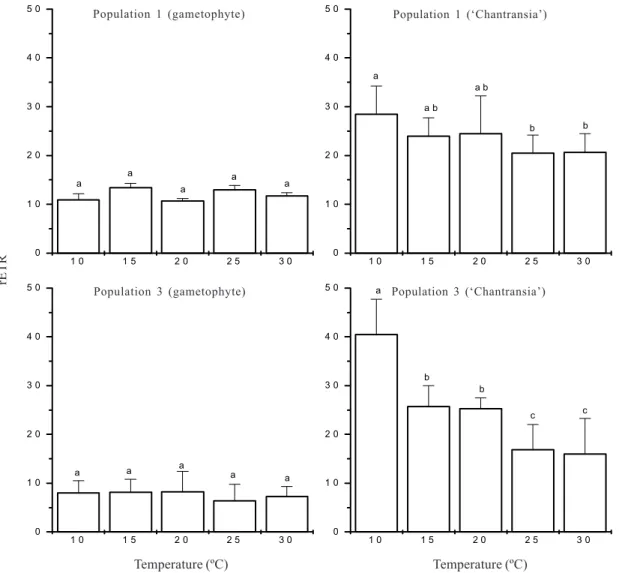
Responses by chlorophyll fluorescence showed significant effect of temperature (F=3.3-20.1, p<0.01) on photosynthetic rates (rETR) only for the ‘Chantransia’ stage in field conditions (Fig. 4). It revealed a clear decreasing trend, with the highest values at 10oC and the lowest at 30oC. On the other
hand, similar values of rETR were observed for the gametophyte in the range of temperature tested (Fig. 4).
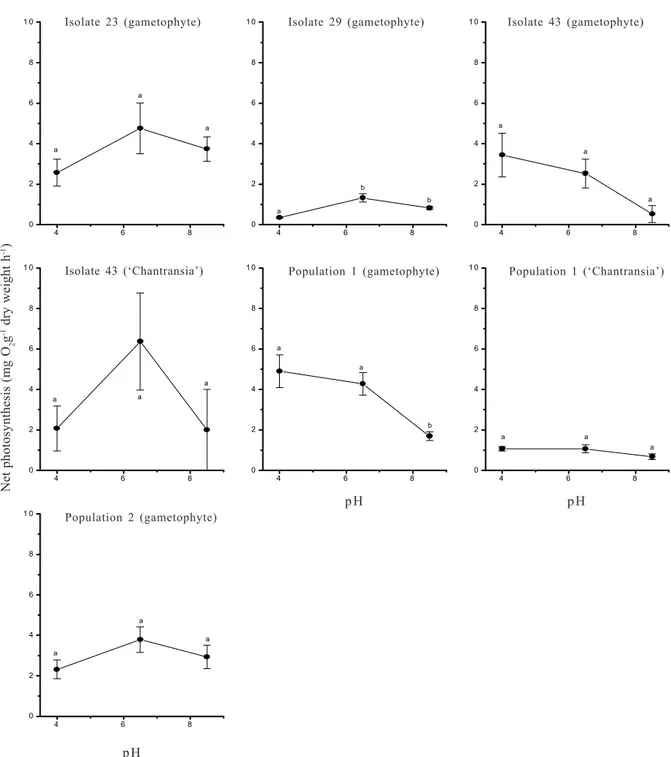
Responses to pH - Rates of photosynthesis in response to pH exhibited two distinct patterns (Fig. 5): 1) rates not significantly different under the three pH values; this pattern was observed in six out of seven populations tested; three populations (gametophyte of isolate 43 and population 1, and population 1 of ‘Chantransia’) had a decreasing trend towards higher
pH values, whereas three populations (gametophyte of isolate 23 and population 2 and ‘Chantransia’ of isolate 43) had higher rates at intermediate pH value (6.5); 2) significantly higher rates at pH 6.5 and 8.5 (F=15.4, p<0.05) were found only in one population (gametophyte of isolate 29). Photosynthetic rates also changed pH values, as observed by comparison before and after the incubations (Tab. 4). Significantly different values between initial and final pH values were observed for all populations, except isolate 29 (gametophyte at pH 4) and isolate 43 (‘Chantransia’ at pH 6.5). Greater differences were generally coincident with the pH level with higher photosynthetic rates, except for isolate 43 ‘Chantransia’ at pH 6.5. Diurnal changes - Rates of net photosynthesis along the natural light period revealed general pattern for the populations tested (Fig. 6), which is characterized
1 0 1 5 2 0 2 5 3 0 0
1 0 2 0 3 0 4 0 5 0
a a
a a
a
P o p u l a t i o n 1 ( g a m e t o p h y t e )
1 0 1 5 2 0 2 5 3 0 0
1 0 2 0 3 0 4 0 5 0
b b
a b
a b a
P o p u l a t i o n 1 ( ' C h a n t r a n s i a ' )
1 0 1 5 2 0 2 5 3 0 0
1 0 2 0 3 0 4 0 5 0
a
P o p u l a t i o n 3 ( g a m e t o p h y t e )
a a
a a
1 0 1 5 2 0 2 5 3 0 0
1 0 2 0 3 0 4 0 5 0
c c
b b
a P o p u l a t i o n 3 ( ' C h a n t r a n
Figure 4. Rates of photosynthesis under five temperatures for two field populations of Batrachospermum delicatulum (Skuja) Necchi &
Entwisle based on data of chlorophyll fluorescence. Bars indicate ± standard-deviations (n = 5). Different letters indicate significant differences (p <0.05) by Newman-Keuls test.
rETR
Temperature (ºC) Temperature (ºC)
Population 1 (gametophyte) Population 1 (‘Chantransia’)
4 6 8 0
2 4 6 8 1 0
a
a
a
Is o la t e 2 3 ( g a m e to p h y t e )
4 6 8
0 2 4 6 8 1 0
b a
b
Is o la t e 2 9 ( g a m e to p h y t e )
4 6 8
0 2 4 6 8 1 0
a a
a
Is o la t e 4 3 ( g a m e to p h y t e )
4 6 8
0 2 4 6 8 1 0
a
a a
Is o la te 4 3 ('C h a n tr a n s ia ')
4 6 8
0 2 4 6 8 1 0
a
b a
P o p u la t io n 1 ( g a m e t o p h y te )
p H
4 6 8
0 2 4 6 8 1 0
a a a
P o p u la tio n 1 ( 'C h a n t ra n s ia ')
p H
4 6 8
0 2 4 6 8 1 0
a a
a
P o p u la t io n 2 (g a m e t o p h y te )
Net
photosynthesis
(mg
O2
g
-1 dry
weight
h
-1)
p H
p H p H
Isolate 23 (gametophyte) Isolate 29 (gametophyte) Isolate 43 (gametophyte)
Isolate 43 (‘Chantransia’) Population 1 (gametophyte) Population 1 (‘Chantransia’)
Population 2 (gametophyte)
Figure 5. Net photosynthetic rates under three pH values for the for the populations of Batrachospermum delicatulum (Skuja) Necchi & Entwisle analysed under field and culture conditions based on data of oxygen evolution. Bars indicate ± standard-deviations (n = 3). Different letters indicate significant differences (p <0.05) by Newman-Keuls test.
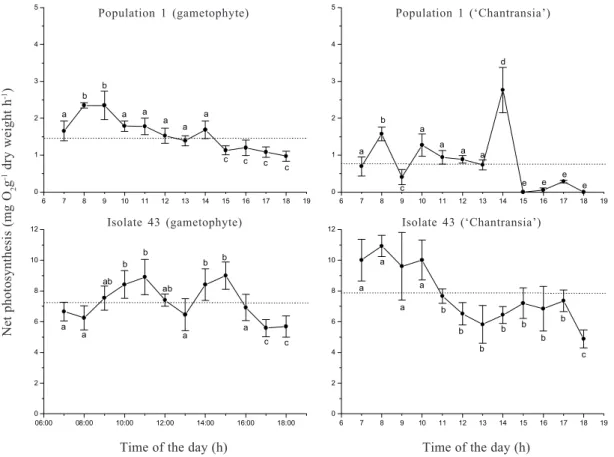
by two relatively clear peaks (with values exceeding diurnal averages): a first (generally higher) during the morning (8:00-11:00) and a second (generally lower) in the afternoon (14:00-17:00). Some variations were observed around this pattern: 1) the diurnal variation in photosynthetic rates was relatively narrower for the
Figure 6. Diurnal variation of photosynthetic rates for two populations of Batrachospermum delicatulum (Skuja) Necchi & Entwisle based on data of oxygen evolution. Bars indicate ± standard-deviations (n = 3). Dotted lines represent diurnal averages. Different letters indicate significant differences (p <0.05) by Newman-Keuls test.
Table 4. Initial and final pH values measured during the incubations of the populations of Batrachospermum delicatulum (Skuja) Necchi & Entwisle by the technique of oxygen evolution. Data are expressed as means standard-deviations (n = 3). Distinct letters indicate significant differences (p <0.05) by Student’s t test.
Populations* Initial pH Final pH
In culture conditions
Isolate 29 (gametophyte) 4.00 ± 0.01 (a) 4.02 ± 0.05 (a) 6.50 ± 0.01 (a) 6.37 ± 0.02 (b) 8.50 ± 0.01 (a) 7.95 ± 0.02 (b) 43 (gametophyte) 4.00 ± 0.01 (a) 4.09 ± 0.01 (b) 6.50 ± 0.01 (a) 6.56 ± 0.01 (b) 8.50 ± 0.01 (a) 8.27 ± 0.01 (b) 43 (‘Chantransia’) 4.00 ± 0.01 (a) 4.10 ± 0.01 (b) 6.50 ± 0.01 (a) 6.49 ± 0.01 (a) 8.50 ± 0.01 (a) 8.28 ± 0.01 (b) In field conditions
Population 1 (gametophyte) 4.00 ± 0.01 (a) 4.27 ± 0.03 (b) 6.50 ± 0.01 (a) 7.00 ± 0.02 (b) 8.50 ± 0.01 (a) 8.05 ± 0.05 (b) Population 1 (‘Chantransia’) 4.00 ± 0.01 (a) 4.14 ± 0.01 (b) 6.50 ± 0.01 (a) 6.98 ± 0.01 (b) 8.50 ± 0.01 (a) 7.82 ± 0.01 (b)
* according to Table 1.
6 7 8 9 10 11 12 13 14 15 16 17 18 19 0
1 2 3 4 5
c c c c a a a a a b b
a
Population 1 (gametophyte)
6 7 8 9 10 11 12 13 14 15 16 17 18 19 0
1 2 3 4 5
e e e e d
a a a a
c b
a
Population 1 ('Chantransia')
06:00 08:00 10:00 12:00 14:00 16:00 18:00 0
2 4 6 8 10 12
c c a b b
a ab b b
ab
a a
Isolate 43 (gametophyte)
6 7 8 9 10 11 12 13 14 15 16 17 18 19 0
2 4 6 8 10 12
c b
b b b
b b b a
a a
a
Isolate 43 ('Chantransia')
Net
photosynthesis
(mg
O2
g
-1 dry
weight
h
-1)
Time of the day (h) Time of the day (h)
Population 1 (gametophyte) Population 1 (‘Chantransia’)
Isolate 43 (gametophyte) Isolate 43 (‘Chantransia’)
Discussion
Adaptation to low irradiance, as indicated by parameters derived from PI curves, has been reported in freshwater red algae (Kremer 1983; Karsten et al.
1993; Leukart & Hanelt 1995; Necchi & Zucchi 2001). These adaptations are basically reflected by low compensation and saturation values, high photosynthetic efficiency and occurrence of photoinhibition, all of which have been confirmed in populations of B. delicatulum from data based on
chlorophyll fluorescence and oxygen evolution techniques. Thus, red algae have been considered as shade-adapted plants. On the other hand,
B. delicatulum, as well as other tropical red algal
species, can be exposed to high in situ irradiances
(970-2,400µmol m-2 s-1, Necchi 1997; Necchi & Zucchi
2001; this study). These algae might have some mechanisms to avoid photodamage of the photosynthetic apparatus due to long-term exposure to high irradiances.
B. helminthosum Bory, whereas Necchi & Zucchi
(2001) have also reported its occurrence in all freshwater red algal species analysed. Photoinhibition, indicated by a negative slope of the PI curve after reaching maximum rates of photosynthesis, has been demonstrated in all populations of B. delicatulum both
by chlorophyll fluorescence and oxygen evolution techniques in this study. These results confirm that the downturn in photosynthesis at high irradiances is not artificially induced by experimental conditions, as indicated by Henley (1993), but is rather a common and typical phenomenon of the freshwater red algae. Dynamic (reversible) photoinhibition, in contrast to chronic (irreversible) photoinhibition, has been proposed as a strategy of photoprotection against high irradiance (Osmond 1994; Hanelt 1996), which is mostly related to the degree and extent of photoinhibition and recovery. It is probably to occur in this, as well as other freshwater red algal species, since photoinhibition has been evidenced in all populations. Future studies dealing with specific mechanisms of photoinhibition in freshwater red algae are necessary to evaluate recovery capacity (measured by chlorophyll fluorescence parameters, particularly quantum yield) after exposure to low and high (photoinhibitory) irradiances with simultaneous measurements of fluorescence parameters.
Acclimation to environmental irradiances were evident only from data derived from chlorophyll fluorescence in field or culture conditions, involving lower values of Ik and quantum yield of PSII associated with lower irradiances and vice-versa. This is the expected pattern for the saturation parameter, but is the reverse for quantum yield, since it is generally inversely related to irradiance (Häder et al. 1998; Beer
et al. 2000; Franklin & Badger 2001). Light acclimation
was not found in Batrachospermum boryanum, which
had similar saturation irradiances in plants from open and shaded sites (Kaczmarczyk & Sheath 1991). Considering the contrasting results and unresolved questions, future studies on light acclimation in freshwater red algae are highly recommended to properly evaluate patterns and mechanisms of these algae to cope with fluctuating light regimes.
Data derived from both techniques revealed significant differences among populations and phases for most photosynthetic parameters from PI curves in natural or culture conditions. Similarly, photosynthesis responded differently to variations in temperature in each population with no clear peaks but instead with similar rates under a wide range of temperatures. Thus,
no consistent pattern was found when the same population or phase was tested in both conditions, indicating high plasticity in population adaptations. This suggests a high capacity to adjust the photosynthetic apparatus to these distinct conditions of irradiance and temperature.
Our results from pH experiments showed a trend a decreasing trend of photosynthetic performance towards higher pH or higher rates at pH 6.5 suggesting, respectively, higher affinity to inorganic carbon as CO2 or indistinct use of bicarbonate and free carbon dioxide. These data are somewhat different from other studies that analyzed sources of inorganic carbon (Raven & Beardall 1981; Raven et al. 1982), which showed use
only of free carbon dioxide in Lemanea and
Batrachospermum. Indistinct use of carbon dioxide
or bicarbonate, as indicated for this species also in a previous study (Necchi & Zucchi 2001), can be viewed as an advantage and can explain its occurrence under wide pH ranges (5.0-7.5) (Necchi 1991; 1993).
Our data essentially agree with the general pattern of diurnal changes in photosynthesis described for seaweeds by Ramus (1981) and for some freshwater red algal species by Necchi & Zucchi (2001), typically consisting of two peaks (although not clearly evident in some cases): a first (generally higher) during the morning and a second (typically lower) in the afternoon. This suggests the existence of an endogenous rhythm determining the variations in photosynthetic rates, since the irradiance and temperature were kept constant. These results were also important to indicate the best period to perform photosynthesis experiments in order to discriminate interference of diurnal rhythms and, consequently, avoiding misinterpretations, as pointed out by Henley (1993).
including photosynthetic characteristics, and our results reinforce this trend. In summary, our results did not support Raven’s (1994) conclusion that the ‘Chantransia’ stage has a negligible role in provisioning the growing gametophyte, and that its role is more related to space occupation with living biomass throughout the year and also to dispersal via production of monospores.
Photosynthetic characteristics of the B. delicatulum
populations exhibited a wide range of responses to irradiance, temperature and pH/inorganic carbon, reflecting its wide tolerance to variations in these environmental variables. This probably contributes to its wide spatial distribution in several scales: streams of a drainage basin (Necchi 1993), regions or biomes (Necchi et al. 1999), being one of the most widespread
freshwater red algal species in Brazil (Necchi 1991). In terms of temporal distribution, populations of this species (including ‘Chantransia’ stage and gametophyte) can occur throughout the year (Pascoaloto & Necchi 1990; Necchi 1993).
Acknowledgements
We are indebted to Maria Helena Carabolante for help in setting up the laboratory experiments; and to FAPESP and CNPq for financial support.
References
Beer, S.; Larsson, C.; Poryan, O. & Axelsson, L. 2000.
Photosynthetic rates of Ulva (Chlorophyta) measured
by pulse amplitude modulated (PAM) fluorometry.
European Journal of Phycology 35: 69-74.
Conde-Álvarez, R.M.; Pérez-Rodríguez, E.; Altamirano, M.; Nieto, J.M.; Abdala, R.; Figueroa, F.L. & Flores-Moya, A. 2002. Photosynthetic performance and pigment
content in the aquatic liverwort Riella helicophylla
under natural solar irradiance and solar irradiance
without ultraviolet light. Aquatic Botany73: 47-61.
Ensminger, I.; Xyländer, M.; Hagen, C. & Braune, W. 2001. Strategies providing success in a variable habitat: III.
Dynamic control of photosynthesis in Cladophora
glomerata. Plant Cell and Environment 24: 769-779.
Franklin, L.A. & Badger, M.R. 2001. A comparison of photosynthetic electron transport rates in macroalgae measured by pulse amplitude modulated chlorophyll
fluorometry and mass spectrometry. Journal of
Phycology 37: 756-767.
Häder, D.P.; Lebert, M.; Figueroa, F.L.; Jiménez, C.; Viñegla, B. & Perez-Rodriguez, E. 1998. Photoinhibition in Mediterranean macroalgae by solar radiation measured
on site by PAM fluorescence. Aquatic Botany 61:
225-236.
Hambrook, J.A. & Sheath, R.G. 1991. Reproductive ecology
of the freshwater red alga Batrachospermum boryanum
Sirodot in a temperate headwater stream. Hydrobiologia
218: 233-46.
Hanelt, D. 1996. Photoinhibition of photosynthesis in marine
macroalgae. Scientia Marina 60(Suppl. 1): 243-248.
Henley, W.J. 1993. Measurement and interpretation of photosynthetic light-response curves in algae in the
context of photoinhibition and diel changes. Journal of
Phycology 29: 729-739.
Kaczmarczyk, D. & Sheath, R.G. 1991. The effect of light regime on the photosynthetic apparatus of the
freshwater red alga Batrachospermum boryanum.
Cryptogamie, Algologie 12: 249-263.
Karsten, U.; West, J.A. & Ganesan, E.K. 1993. Comparative
physiological ecology of Bostrychia moritziana
(Ceramiales, Rhodophyta) from freshwater and marine
habitats. Phycologia 32: 401-409.
Kremer, B.P. 1983. Untersuchungen zur Ökophysiologie
einiger Süsswasserrotalgen. Decheniana 136: 31-42.
Kromkamp, J.; Barranguet, C. & Peene, J. 1998. Determination of microphytobenthos PSII quantum efficiency and photosynthetic activity by means of
variable chlorophyll fluorescence. Marine Ecology
Progress Series 162: 45-55.
Leukart, P. & Hanelt, D. 1995. Light requirements for photosynthesis and growth in several macroalgae from a small soft-water stream in the Spessart Mountains,
Germany. Phycologia 34: 528-532.
Littler, M.M. & Arnold, K.E. 1985. Electrodes and chemicals.
Pp. 349-375. In: M.M. Littler & D.S. Littler (eds.). Handbook
of phycological methods; ecological field methods: macroalgae. Cambridge, Cambridge University Press.
Necchi Jr., O. 1991. The section Sirodotia of
Batrachospermum (Rhodophyta, Batrachospermaceae)
in Brazil. Algological Studies62: 17-30.
Necchi Jr., O. 1993. Distribution and seasonal dynamics of Rhodophyta in the Preto river basin, southeastern Brazil.
Hydrobiologia 250: 81-90.
Necchi Jr., O. 1997. Microhabitat and plant structure of
Batrachospermum (Batrachospermales, Rhodophyta)
populations in four streams of São Paulo State,
southeastern Brazil. Phycological Research 45: 39-45.
Necchi Jr., O.; Branco, C.C.Z. & Branco, L.H.Z. 1999. Distribution of Rhodophyta in streams from São Paulo
State, southeastern Brazil. Archiv für Hydrobiologie 147:
73-89.
Necchi Jr., O. & Zucchi, M.R. 1997. Audouinella
macrospora (Acrochaetiaceae, Rhodophyta) is the
‘Chantransia’ stage of Batrachospermum
(Batrachospermaceae). Phycologia 36: 220-224.
Necchi Jr., O. & Zucchi, M.R. 2001. Photosynthetic performance of freshwater Rhodophyta in response to temperature, irradiance, pH and diurnal rhythm.
Phycological Research 49: 305-318.
Osmond, C.B. 1994. What is photoinhibition? Some insights from comparisons of shade and sun plants. Pp. 1-14. In:
N.R. Baker & J.R. Bowyer (eds.). Photoinhibition of
Pascoaloto, D. & Necchi Jr., O. 1990. Seasonal variation of
Sirodotia delicatula Skuja (Rhodophyta,
Batrachospermaceae) in a small stream from São Paulo
State, southeastern Brazil. Revista Brasileira de Biologia
50: 37-44.
Platt, T.; Gallegos, C.L. & Harrison, W.G. 1980. Photoinhibition of photosynthesis in natural
assemblages of marine phytoplankton. Journal of
Marine Research38: 687-701.
Ramus, J. 1981. The capture and transduction of light energy.
Pp. 458-492 In: C.S. Lobban & M.J. Wynne (Eds.) The
biology of seaweeds. Berkeley, University of California Press.
Raven, J.A. 1994. The roles of the Chantransia phase of
Lemanea (Lemaneaceae, Batrachospermales,
Rhodophyta) and of the ‘mushroom’ phase of
Himanthalia (Himanthaliaceae, Fucales, Phaeophyta).
Botanical Journal of Scotland 46: 477-485.
Raven, J.A. & Beardall, J. 1981. Carbon dioxide as the
exogenous inorganic source for Batrachospermum and
Lemanea. British Phycological Journal16: 165-175.
Raven, J.A.; Beardall, J. & Griffiths, H. 1982. Inorganic
C-sources for Lemanea, Cladophora and Ranunculus in
a fast-flowing stream: measurements of gas exchange and of carbon isotope ratio and their ecological
implications. Oecologia53: 68-78.
Schreiber, U.; Bilger, W. & Neubauer, C. 1994. Chlorophyll fluorescence as a non-intrusive indicator for rapid
assessment of in vivo photosynthesis. Pp. 49-70. In:
E.-D. Schulze & M.M. Caldwell (eds.). Ecophysiology of
photosynthesis, v. 100. Berlim, Springer-Verlag.
Versão eletrônica do artigo em www.scielo.br/abb
Sheath, R.G. 1984. The biology of freshwater red algae. Pp.
89-157. In: F.E. Round & D.J. Chapman (eds.). Progress
in Phycological Research, v. 3. Bristol, Biopress.
Sheath, R.G. & Hambrook, J.A. 1990. Freshwater ecology.
Pp. 423-453. In: K.M. Cole & R.G. Sheath (eds.). Biology
of the red algae. Cambridge, Cambridge University
Press.
Thomas, M.L.H. 1988. Photosynthesis and respiration of aquatic macro-flora using the light and dark bottle oxygen method and dissolved oxygen analyser. Pp. 64-77. In: C.S. Lobban; D.J. Chapman & B.P. Kremer (eds.).
Experimental Phycology: a laboratory manual.
Cambridge, Cambridge University Press.
Van Kooten, O. & Snel, J.F.H. 1990. The use of chlorophyll fluorescence nomenclature in plant stress physiology.
Photosynthesis Research 25: 147-150.
Wetzel, R.G. & Likens, G.E. 1991. Limnological analyses.
New York, Springer-Verlag.
White, A.J. & Critchley, C. 1999. Rapid light curves: a new fluorescence method to assess the state of the
photosynthetic apparatus. Photosynthesis Research
59: 63-72.
Zar, J.H. 1999. Biostatistical analysis. New Jersey, Prentice
Hall.
Zucchi, M.R. & Necchi Jr., O. 2001. Effects of temperature, irradiance and photoperiod on growth and pigment content in some freshwater red algae in culture.