ABSTRACT: Machinery traffic in sugarcane (Saccharum sp.) plantations reduces soil physical quality, and hinders both root development and crop yield. We evaluated the physical quality of an Oxisol and the development of sugarcane roots under controlled traffic. The treatments assessed were: without controlled machinery traffic (WCT), controlled traffic by adjusting the tractor and infield wagons to a 3.0 m track width with the operator guiding the machinery (CT1) and the previous treatment using real time kinematic / global positioning system (RTK / GPS) precision auto steer (CT2). Soil samples were collected from the planting rows, seedbed and inter-row center to determine the least limiting water range (LLWR) and soil porosity from scanned 2-D images. The root dry mass was sampled from monoliths, separated from the soil by washing through a 2-mm sieve and dried in an oven. A higher LLWR was observed in the planting row under CT1 and CT2 than under WCT. The planting row had a predominance of complex pores with a diameter > 500 µm in the 0.15-0.27 m depth layer under CT1 and CT2. In the planting rows under WCT, the root dry mass was only 44 % of that measured under CT2. Benefits regarding soil physical quality and growth roots were observed when the tractor-wagon track width was adjusted based on the sugarcane spacing using either precision auto steering or manual operation of the machinery.
Keywords: least limiting water range, soil compaction, machinery traffic, root system.
Introduction
Brazil is the world’s largest producer of sugarcane (Saccharum sp.) with 714 million tons of sugarcane har-vested on 9.94 million hectares (IBGE, 2012) annually. Sugarcane production systems involve intensive mechani-zation characterized by high axle loads, that lead to com-paction of the soil (Otto et al., 2011; Souza et al., 2012). Intensive mechanization promotes soil compaction due to increased bulk density, reduction of soil porosity and excessive soil resistance to penetration (Chan et al., 2006; Otto et al., 2011; Silva et al., 2011).
The least limiting water range (LLWR) indicates the range of least limiting soil water content for plant growth, associated with water potential, resistance to root growth and aeration, and is used to evaluate the impacts of soil management (Cavalieri et al., 2011; Lapen et al., 2004; Leão et al., 2006). Soil compaction also influences pore size, distribution and continuity (Horn et al., 1995; Pagliai et al., 2004). Analysis of 2-D images of soil cores enables visualization of soil structure and quantification of chang-es caused by management (Costantini et al., 2006; Lima et al., 2005). Changes in the soil structure and compaction hinder root development which may in turn reduce crop yield (Bengough et al., 2011; Otto et al., 2011).
In Brazilian sugarcane fields, changes in soil physical quality occur in both the inter-row and planting rows as a result of wheel traffic from machines with a 2 m wheel track width being used in the 1.4-1.5 m spacing between rows (Souza et al., 2012). The inaccuracy of the machine operator and lack of parallelism between planting rows result in wheel movement over the planting rows, which reduces root development, sugarcane yield and longevity (Braunack and McGarry, 2006; Souza et al., 2012).
The controlled traffic system can minimize traffic-induced soil compaction (Braunack and McGarry, 2006; Tullberg et al., 2007) by adjusting the spacing of the crop based on the machinery track width, and thereby maintain zones permanently without traffic (Chan et al., 2006; McHugh et al., 2009). Additionally, using precision auto steer offers greater accuracy that minimizes wheel traffic on the planting rows (Gan-Mor et al., 2007).
This study was undertaken to evaluate the hypoth-esis that controlled traffic improves soil physical quality in the planting row, with greater sugarcane root develop-ment. The aim was to quantify the physical properties of an Oxisol and sugarcane root development under man-agement with or without controlled traffic.
Materials and Methods
The experiment was conducted on a commercial plantation in Pradópolis, in the state of São Paulo, south-eastern Brazil (21º18’67’’ S, 48º11’38’’ W, 630 m above sea level). The climate in the area is characterized by dry winters and rainy summers, with concentrated rainfall from Nov to Feb and mean annual precipitation of 1,400 mm. The soil was a Typic Kandiudox (Soil Survey Staff, 2010), containing 557, 298 and 145 g kg–1 of clay, silt and
sand, respectively, in the 0-0.30 m layer. The experimen-tal plots were on a 6 % slope.
The rainfed sugarcane crop, variety RB855453, was established along contour lines on Aug 29 2007. In-tensive cultivation of sugarcane crops has persisted in the area for more than 30 consecutive years, and mecha-nized harvesting without burning (raw cane) has been employed for the last 12 years. The soil was tilled on Jul 15 2007 to eliminate the ratoon from the previous 1INCAPER/CRDR-SC/FEBN, Rod. ES-483, km 2.5 –
29323-000 – Cachoeiro de Itapemirim, ES – Brazil.
2University of Campinas/FEAGRI, Av. Candido Rondon, 501 – 13083-875 – Campinas, SP – Brazil.
3University of São Paulo/ESALQ, Dept. of Soil Science, Av. Pádua Dias, 11 – 13418-900 – Piracicaba, SP – Brazil. 4State University of Maringa – Dept. of Agronomy, Av. Colombo, 5790 – 87090-000 – Maringá, PR – Brazil. *Corresponding author <[email protected]>
Edited by: Silvia del Carmen Imhoff
Controlled traffic and soil physical quality of an Oxisol under sugarcane cultivation
Gustavo Soares de Souza1*, Zigomar Menezes de Souza2, Miguel Cooper3, Cássio Antônio Tormena4
crop using a subsoiler with five shanks spaced 0.4 m apart down to 0.6 m, followed by harrowing with a disc harrow (246 mm discs with a diameter of 28 inches and spacing of 270 mm).
Dolomitic limestone was applied (2.5 t ha–1) prior
to turning the soil with the disc harrow and 20 t ha–1 of
filter cake was applied to the planting furrows. In July 2009 and 2010, after the harvest, 280 and 260 kg ha–1,
respectively, of a 32-00-02 N-P-K formulation were ap-plied. Additionally, 100 m3 ha–1 of vinasse was applied
in the field. The soil and root evaluations described be-low were conducted in 2010, which corresponded to the third harvest (second ratoon) after initiation of the treat-ments on Aug 29 2007.
The mechanized operations were performed with a 4 × 4 tractor (198 kW) weighing 11.7 t equipped with 650-85 R38 rear tires and 600-70 R30 front tires, respec-tively, with inflation pressures of 110 and 150 kPa. The crop was harvested on Jun 10 2010 with a single-row crawler harvester (246 kW) weighing 18.5 t. The tractor towed a three-compartment infield wagon with a total mass of 40 t, which was distributed over six axles with 600/50 R22.5 tires with an inflation pressure of 110 kPa.
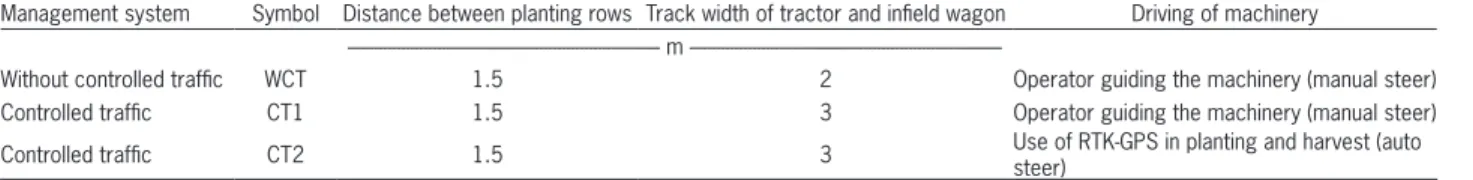
The experiment was arranged in a randomized block design, with three management systems distrib-uted in 12 plots (50 m long by 14 lines), as described in Table 1. With the adoption of controlled traffic man-agement, a 0.4-m strip on each side of the planting row was referred to as the “sugarcane seedbed” because it was not subjected to wheel traffic from the harvester or the tractor-wagon set. Thus, the traffic by wheel was concentrated in the sugarcane inter-row center, except the harvester traffic. A single-row harvester with manual guidance by the operator and a track width of 1.88 m was used in the three treatments. The harvester pro-motes traffic next to the seedbed, but the contact pres-sure was less than the soil load-support capacity, which is 132 kPa for a soil water content of 0.58 m3 m–3 (Souza
et al., 2012).
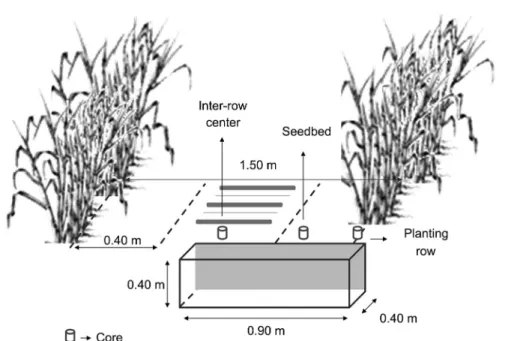
A total of 162 undisturbed soil cores (0.05 × 0.05 m) were collected on June 18 2010 from three sampling areas: planting row (PR), seedbed region (at 0.30 m from the planting row, BED) and inter-row center (at 0.75 m apart from the planting row, IRC) (Figure 1). These sam-ples were collected at depths of 0-0.1, 0.1-0.2 and 0.2-0.3 m and were meant to measure the soil water reten-tion curve, soil resistance to penetrareten-tion (SRP), soil bulk density (BD) and the least limiting water range (LLWR). The samples were saturated by gradually increasing the
water level. The following pressures or equivalent mat-ric potential (ψ) were applied to the samples -2, -6, -8, -10, -33, -100, -500 and -1500 kPa in Richards’ pressure chambers with porous plates according to Klute (1986).
After reaching equilibrium at each pressure the samples were weighed and the soil resistance to pen-etration (SRP) was determined according to Tormena et al. (1999). The SRP was measured with a bench pen-etrometer operated at a constant velocity of 1 cm min–1
and comprised a 200 N load cell and a rod with a 4-mm diameter cone and semi-angle of 30º. Three tests were carried out for each core. The data generated in the cen-ter of the cores (0.04 m) were used in the analyses. The samples were then dried in an oven at 105 °C until they achieved constant mass to determine volumetric water content (θ) and soil bulk density (BD).
The soil water retention curve (Equation 1) was fit-ted according to Leão et al. (2006) and Silva et al. (2011).
θ
= e
(a+b BD)ψ
c(1)
The SRP data were submitted to regression with
BD and θ using the model proposed by Busscher (1990):
SRP = d BDe θf
(2)
a, b, c, d, e and f are model parameters for Equation 1 and 2. The influence of the management systems, sam-pling positions and soil layers on water retention and soil resistance to penetration curves was evaluated as “dum-my” variables according to Neter et al. (1996). We em-ployed the PROC REG routine described in SAS (Statisti-cal Analysis System, version 9.2) to fit the linear models. The value SRP = 3 MPa was considered to be criti-cal for restricting the growth of roots (Lapen et al., 2004) and used to calculate the value of the volumetric water content yielding a critical SRP value (θSRP) using Equa-tion 2. The soil water content (θ) at the critical limits of the matric potential was obtained considering the field capacity (θFC) to be the soil volumetric water content at ψ= -10 kPa (Haise et al., 1955); the permanent wilting point (θPWP) was considered to be the soil volumetric wa-ter content at ψ= -1500 kPa (Savage et al., 1996). The water content at 10 % air-filled porosity (θAFP) was ob-tained based on the soil bulk density and particle density (mean PD=2.80 t m–3, n=6) estimated using Equation 3,
and a minimum air-filled porosity value of 0.10 m3 m–3
was considered for adequate aeration in the soil (Lapen et al., 2004; Leão et al., 2006).
Table 1 – Characteristics of the management system of the sugarcane crop.
Management system Symbol Distance between planting rows Track width of tractor and infield wagon Driving of machinery m
---Without controlled traffic WCT 1.5 2 Operator guiding the machinery (manual steer)
Controlled traffic CT1 1.5 3 Operator guiding the machinery (manual steer)
Controlled traffic CT2 1.5 3 Use of RTK-GPS in planting and harvest (auto
θAFP = [1–(BD/PD) – 0.1] (3)
The LLWR was calculated according to Silva et al. (2011): for each BD value the LLWR is the difference between the upper limit and the lower limit, with the upper limit being the drier θ of either θFCor θAFP, and the lower limit being the wetter θ of either θPWP or θSRP. The soil bulk density critical to root growth (BDC) was estab-lished as the bulk density value in which the LLWR=0. Undisturbed soil monoliths (n=18) were also col-lected from the 0-0.12 and 0.15-0.27 m layers to analyze soil porosity using 2-D scanned images. The monoliths were manually collected and stored in cardboard boxes with dimensions of 0.06 × 0.07 × 0.12 m (Lima et al., 2005), wrapped in cling film. In the laboratory, the sam-ples were slowly dehydrated as described by Murphy (1986). This procedure included an air-drying period of ten days and four days in an oven at 35 ºC. The samples were impregnated via capillarity, with a saturated poly-ester resin diluted with styrene monomers and mixed with a fluorescent dye, which enabled the pores to be observed under ultraviolet light. After the material had hardened, the blocks were cut vertically and polished.
2-D images (n=24) were acquired by microphoto-graph, the polished blocks using a digital camera with a resolution of 1024 × 768 pixels and an area per pixel of 156.25 µm2 (12.5 × 12.5 µm), coupled to a petrographic
microscope with a 10x optical lens. The images were bi-narized (pore = 0, solid = 1), enabling differentiation of solid particles and the pore space (>20 µm) using the Visilog-Noesis software (version 5.4), as described by Cooper et al. (2005). Soil porosity was calculated as the percentage ratio of the sum of the pore area to the to-tal area of the image field. The pores were divided into three shape groups, i.e., rounded, elongated and
com-plex, and characterized using two indexes (Table 2). The first index, I1, which was used to characterize the pore shape (Cooper et al., 2005), was computed using Equa-tion 4:
(4)
where: P is the pore perimeter, and A is the pore area. The second index, I2, complements index 1 to obtain a precise group separation based on format (Cooper et al., 2005), which is defined by Equation 5:
(5)
where: NI is the number of intercepts for an object in direction i (i = 0°, 45º, 90° or 135º); DF is the Feret diameter of an object in direction j (j = 0° or 90°); and
m and n are the numbers of directions i and j, respec-tively. Index 1 is equal to one for a perfectly round shape and increases as the shape deviates from a perfect circle. Pores were also subdivided into three size groups, 20-50, 50-500 and > 500 µm, through the Visilog-Noesis software. Porosity data were analyzed using PROC GLM from SAS®.
Table 2 – Criteria for differentiating pore groups based on shape.
Pores Shape Indices
I1 I2
Round I1 ≤ 5
-Elongated 5 < I1 ≤ 25 I2 ≤ 2.2 Complex 5 < I1 ≤ 25 or I1 > 25 I2 > 2.2 Source: Cooper et al. (2005).
The soil volumetric water content varied exponen-tially with the soil bulk density and with negative power, with the matric potential. The soil water retention curve models used to estimate θFC and θPWP were as follows:
θWCT = e(–1.5752+0.7206*BD) * ψ–0.0850 (n=54, R2=0.85**)
θCT1 = e(–1.2881+0.4965*BD) * ψ–0.0846 (n=54, R2=0.80**)
θCT2 = e(–1.3449+0.5605*BD) * ψ –0.0907 (n=54, R2=0.83**)
The increase in soil bulk density resulted in a de-crease in θAFP and an increase in θSRP under the three treatments (Figure 2). θSRP represented the lower limit of the LLWR in most of the samples for WCT, CT1 and CT2. Thus, for values of BD > 1.06 t m–3, regardless of
the treatment, the LLWR was reduced by the soil re-sistance to root penetration. The LLWR was positively correlated with soil bulk densities of up to 1.08, 1.04 and 1.05 t m–3 for WCT, CT1 and CT2, respectively, and
negatively correlated with higher BD values. The critical soil bulk densities (BD, where LLWR=0) were 1.26, 1.25 and 1.26 t m–3 for treatments WCT, CT1 and CT2,
re-spectively. Management systems CT1 and CT2 displayed LLWRs higher than those found for WCT in the planting row (Figure 3).
The soil porosity varied between treatments from 6 to 20 % (Figure 4). Analysis of soil porosity indicated similar total porosities between the three management systems at the inter-row center and seedbed. Howev-er, a higher percentage of pores was observed in CT1 in the planting row in the 0.15-0.27 m depth layer. A higher percentage of pores with a diameter <500 µm, which were predominantly rounded and elongated, was observed in the inter-row center in the 0-0.12 m depth layer under the controlled traffic management regimes (Figure 5). The planting row presented more pores, pre-dominantly complex with a diameter > 500 µm, in the 0.15-0.27 m depth layer under CT1 and CT2. A decrease in the percentage of complex pores with diameters > 500 µm occurred in the order IRC > BED > PR in the 0.15-0.27 m layer in the WTC treatment (p < 0.05), and the reverse pattern was observed with controlled traffic.
Greater root dry mass occurred under CT1 and CT2 in the planting row in the 0-0.30 m depth layer (Figure 6). Under the WCT treatment, the planting row displayed 44 % less roots than were found under CT2. Monoliths (n = 108) with dimensions of 0.25 ×
0.10 × 0.10 m were used for measuring root dry mass and were sampled immediately after the harvest in four furrows (0.90 × 0.40 × 0.40 m) for each manage-ment system. In each furrow, nine monoliths were col-lected perpendicularly between two sugarcane rows in the 0-0.1, 0.1-0.2 and 0.2-0.3 m depth layers. The roots were separated from the soil by washing in running wa-ter using a 2-mm sieve, followed by drying in an oven at 65 ºC until constant mass was reached (Souza et al., 2012). The mean values for each management system were interpolated, generating isoline maps of the root dry mass between the planting row and the inter-row center.
Results
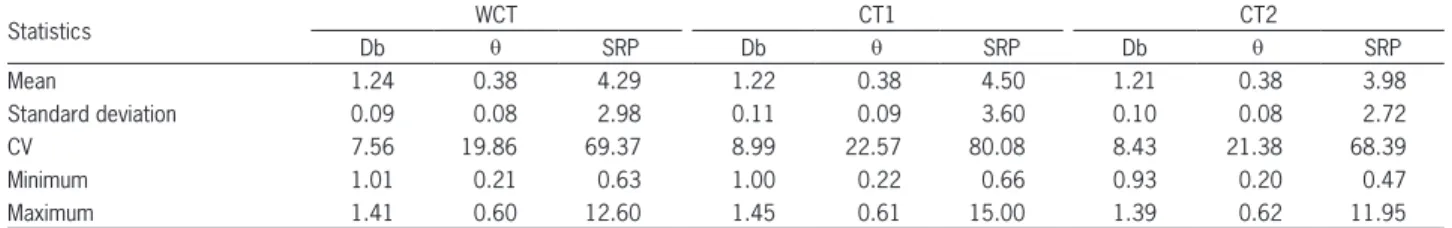
The high coefficient of variation (CV) obtained for the soil resistance to penetration was due to the vari-ability of the volumetric water content in the manage-ment systems (Table 3). The observed range of matric potentials allowed for a wide variation in soil volumetric water content, accounting for a wide range of soil resis-tance to penetration values, which is necessary for mod-elling the soil resistance curve. The soil bulk density had a low CV for the treatments studied.
The sampling positions and soil layers did not af-fect (p > 0.05) the volumetric water retention and soil resistance to penetration curves obtained for the three treatments (data not shown). The effects of the sam-pling positions and soil layers in the volumetric wa-ter retention and soil resistance to penetration curves were explained by soil bulk density, showing differ-ences between the fitted curves only for the manage-ment systems. Regardless of the treatmanage-ments, the soil resistance to penetration varied with positive power with the soil bulk density and with negative power, with the soil volumetric water content. The following equations described SRP as a function of the volumet-ric water content and soil bulk density in the treat-ments applied:
SRPWCT = 0.0659 * θ –2.2941 * BD7.8864 (n=54, R2=0.79**)
SRPCT1 = 0.0693 * θ –2.5231 * BD7.1098 (n=54, R2=0.79**)
SRPCT2 = 0.0778 * θ –2.3591 * BD7.2239 (n=54, R2=0.84**)
Table 3 – Analysis of the soil physical properties in undisturbed cores (n = 54) from treatments: control (WCT) and controlled traffic (CT1 and CT2).
Statistics WCT CT1 CT2
Db θ SRP Db θ SRP Db θ SRP
Mean 1.24 0.38 4.29 1.22 0.38 4.50 1.21 0.38 3.98
Standard deviation 0.09 0.08 2.98 0.11 0.09 3.60 0.10 0.08 2.72
CV 7.56 19.86 69.37 8.99 22.57 80.08 8.43 21.38 68.39
Minimum 1.01 0.21 0.63 1.00 0.22 0.66 0.93 0.20 0.47
Maximum 1.41 0.60 12.60 1.45 0.61 15.00 1.39 0.62 11.95
The inter-row center areas observed in all management systems had only 10 % of root dry mass as compared with the planting row under CT2.
Discussion
CT1 and CT2 resulted in LLWRs higher than those observed under WCT in the planting row (Figure 3), which is attributable to the improved soil physical qual-ity, stemming from the adjustment of the tractor-wagon track width. The use of precision auto steer did not in-crease the LLWR in relation to the tractor guided by the operator. The tractor guided by the operator maintains a precise direction in short lines, with soil without irregu-larities and good visibility for traffic. The movement of agricultural machinery across the slope (6 %), associated with the presence of plant residues (straw) on the soil superficial layer promotes a lower adherence of tires, causing the equipment to move sideways, which can be manually corrected quicker than by auto steer. How-ever, this effect can be significant in plots covering long
distances, during low-visibility conditions and/or when working along contour lines in hilly and rough terrain, as demonstrated by Gan-Mor et al. (2007).
WCT and CT1 showed LLWR near zero in the in-ter-row center, resulting in severe physical limitations on plant development, especially when BD > BDC, which agrees with Reichert et al. (2009) and Cavalieri et al. (2011). This soil experienced intensive agricultural ac-tivity during three sugarcane cycles, mainly in the traffic tracks. Although the sugarcane cycles extended over six years, these results tended to be more evident at the end of the last cycle. The adjustment of the tractor-wagon track width leads to greater LLWR under sugarcane due to lower soil compaction in the planting row, in agree-ment with Chan et al. (2006) in areas with wheat and canola.
The increased width track of the harvester 1.88 to 3.0 m can increase the LLWR in the seedbed and plant-ing row, and thereby reduce the cumulative effect of traffic on the seedbed, which also affects the planting row, which is consistent with the findings of Chan et al. (2006) and Tullberg et al. (2007). Preventing soil com-paction is vital for assuring a greater LLWR in agricul-tural management systems, because an increase in bulk density requires higher volumetric water content in the soil to maintain resistance at non-limiting crop levels. The excessive increase of soil water, however, decreases aeration porosity, which,in turn, may also restrict root growth (Lapen et al., 2004). The increase in volumetric water content also makes the soil more susceptible to suffer with the compaction (Horn et al., 1995), caused by machine traffic, which assists in the adoption of con-trolled traffic. A reduced LLWR is of more concern un-der non-irrigated conditions, because the soil volumetric water content is not controlled, so the crop will more likely suffer water stress or grow with a limiting RP.
Controlled traffic resulted in a higher percentage of pores in the planting row in the 0.15-0.27 m depth layer (Figure 4), similar to the results reported by Tull-berg et al. (2007) and McHugh et al. (2009). The highest soil porosity in the planting row observed in the 0.15-0.27 m layer was again recorded under CT1, which
sup-Figure 2 – Water content at field capacity (θFC; ψ=-10 kPa; ), at permanent wilting point (θPWP;ψ=-1500 kPa; ), at air-filled porosity of 0.10
m3 m–3 (θ
AFP; ) and at soil resistance to penetration of 3 MPa (θSRP; ) and least limiting water range (shaded area) in the treatments control
(WCT) and controlled traffic (CT1 and CT2).
Figure 4 – Total soil porosity for treatments: control (WCT) and controlled traffic (CT1 and CT2) in the inter-row center (IRC), seedbed (BED) and planting row (PR) in the 0-0.12 and 0.15-0.27 m depth layers. Means followed by the same letter do not differ between treatments (Tukey, p
> 0.05).
ports the notion of a more immediate effect of adjustment of the tractor-wagon wheel track width on soil physical quality. Again, the effect of precision auto steer did not differ from that of manually operated machinery, justified previously, which agrees with the behavior of the LLWR. The effect of management with and without controlled traffic was not significant in the 0-0.12 m depth layer in the seedbed and planting row probably due to the track width of the harvester, resulting in cumulative traffic over three sugarcane cycles under the inter-row and seedbed.
Macropores formed during soil preparation were transformed after three sugarcane cycles into rounded and elongated (cracks and fissures) pores with a diameter <500 µm in the inter-row center in the 0-0.12 m depth layer under the treatments with controlled traffic (Figure 5), which is consistent with the findings of Lamandé et al. (2003) and Pagliai et al. (2004). The pressure exerted by the wheels of the tractor-wagon set exceeded the soil internal resistance at the inter-row center, and promoted changes in soil porosity, as shown by Souza et al. (2012). The higher percentage of pores with diameters of 20-50 µm in the 0.15-0.27 m depth layer in the seedbed and planting row under WCT (Figure 5) occurred because the
wheel track width of the machines was not adjusted to the sugarcane spacing, which caused soil compaction in the region of root system development, consistent with the findings of Braunack and McGarry (2006) and McHugh et al. (2009).
The predominance of complex pores with a diam-eter > 500 µm in the 0.15-0.27 m layer in the planting row and seedbed under the management regimes with controlled traffic (Figure 5) occurred due to the absence of frequent soil-wheel contact with the seedbed and plant-ing row. Complex pores exhibit greater connectivity than rounded pores, and increase aeration, infiltration and re-distribution of water in the soil (Costantini et al., 2006; Lamandé et al., 2003; Lima et al., 2005). Additionally, the fasciculate sugarcane root system contributed to the for-mation of complex pores, due to the large number of fine roots that develop in the soil, which create an intercon-nected pore space (Figure 5).
A decrease in the number of complex pores with diameters > 500 µm occurred in the order IRC > BED > PR in the 0.15-0.27 m layer under the WTC management regime (p < 0.05), indicating the effect of traffic on or near the planting row. This observation is consistent with Lima et al. (2005), which results in a lower air-filled soil poros-ity (Figure 3). However, the reverse was observed under controlled traffic (Figure 5), demonstrating the conserva-tion of soil porosity in the planting row in the subsurface layer, which is in agreement with Horn et al. (1995).
The greater root dry mass observed under CT1 and CT2 was due to greater LLWR and soil porosity. Soil com-paction in the planting row reduced the root dry mass by 44 % in WCT in relation to CT2 (Figure 6). Well-developed root systems are vital to non-irrigated crops, which are not typically provided with sufficient water (Bengough et al., 2011). These results suggest the need to preserve the physical quality of the soil, which was achieved under the management systems involving controlled traffic, particu-larly in the planting row, which is consistent with Chan et al. (2006) and Otto et al. (2011).
The higher compaction observed at the inter-row center under the three management systems created lim-iting conditions for root growth, with this area display-ing only 10 % of the dry root mass found in the plantdisplay-ing row under CT2 (Figure 6). Otto et al. (2011) observed a 90 % reduction of sugarcane root development associated with a BD ≥ 1.78 t m–3 in a soil with clay content higher
than 285 g kg–1. Soil compaction problems are frequent
in mechanized sugarcane plantations, which thereby cre-ate conditions that hinder crop root development (Otto et al., 2011). Moreover, management regimes involving controlled traffic are an effective management strategy for preserving soil physical quality.
Conclusions
Management of Brazilian sugarcane crops with controlled traffic promoted greater LLWR and porosity of the examined tropical soil when compared to WCT in the
planting row and in the seedbed region after three crop cycles. The benefits regarding soil physical quality were observed when the tractor-wagon wheel track width was adjusted based on crop spacing using either preci-sion auto steering or manual operation of the machin-ery only. Preservation of the physical quality of tropi-cal soils via management regimes involving controlled traffic led to increased sugarcane root dry mass of up to 44 %, which was concentrated in the planting row and seedbed region.
Acknowledgments
The authors thank the São Martinho sugarcane mill for providing the study area and operational support, the Brazilian Council of Technological and Scientific Devel-opment (CNPq) for the scholarship awarded to the first author and the São Paulo Research Foundation (FAPESP) for financing the project.
References
Bengough, A.G.; McKenzie1, B.M.; Hallett, P.D.; Valentine, T.A. 2011. Root elongation, water stress, and mechanical impedance: a review of limiting stresses and beneficial root tip traits. Journal of Experimental Botany 62: 59-68.
Braunack, M.V.; McGarry, D. 2006. Traffic control and tillage strategies for harvesting and planting of sugarcane (Saccharum officinarum) in Australia. Soil and Tillage Research 89: 86-102. Busscher, W.J. 1990. Adjustment of flat-tipped penetrometer
resistance data to common water content. Transactions of the ASAE 3: 519-524.
Cavalieri, K.M.V.; Carvalho, L.A.; Silva, A.P.; Libardi, P.L.; Tormena, C.A. 2011. Soil physical quality of three soils under mechanical sugarcane harvesting. Revista Brasileira de Ciência do Solo 35: 1541-1549 (in Portuguese, with abstract in English). Chan, K.Y.; Oates, A.; Swan, A.D.; Hayes, R.C.; Dear, B.S.;
Peoples, M.B. 2006. Agronomic consequences of tractor wheel compaction on a clay soil. Soil and Tillage Research 89: 13-21. Cooper, M.; Vidal-Torrado, P.; Chaplot, V. 2005. Origin of
microaggregates in soils with ferralic horizons. Scientia Agricola 62: 256-263.
Costantini, E.A.C.; Pellegrini, S.; Vignozzi, N.; Barbetti, R. 2006. Micromorphological characterization and monitoring of internal drainage in soils of vineyards and olive groves in central Italy. Geoderma 131: 388-403.
Gan-Mor, S.; Clark, R.L.; Upchurch, B.L. 2007. Implement lateral position accuracy under RTK-GPS tractor guidance. Computers and Electronics in Agriculture 59: 31-38.
Haise, H.R.; Haas, H.J.; Jensen, L.R. 1955. Soil moisture studies of some great plains soils. II. Field capacity as related to 1/3- atmosphere percentage, and “minimum point” as related to 15- and 26- atmosphere percentage. Soil Science Society of America Journal 34: 20-25.
Horn, R.; Domzzal, H.; Slowinska-Jurkiewicz, A.; Ouwerkerk, C. van. 1995. Soil compaction processes and their effects on the structure of arable soils and environment. Soil and Tillage Research 35: 23-36.
Instituto Brasileiro de Geografia e Estatística [IBGE]. 2012. Monthly survey of forecasting and monitoring of agricultural crops in the calendar year = Pesquisa mensal de previsão e acompanhamento das safras agrícolas no ano civil. Levantamento Sistemático da Produção Agrícola 24: 1-82 (in Portuguese).
Klute, A. 1986. Water retention: laboratory methods. p. 635-660. In: Klute, A., ed. Methods of soil analysis. Part 1. Physical and mineralogical methods. American Society of Agronomy, Madison, WI, USA.
Lamandé, M.; Hallaire, V.; Curmia, P.; Pérès, G.; Cluzeau, D. 2003. Changes of pore morphology, infiltration and earthworm community in a loamy soil under different agricultural managements. Catena 54: 637-649.
Lapen, D.R.; Topp, G.C.; Gregorich, E.G.; Curno, W.E. 2004. Least limiting water range indicators of soil quality and corn production, eastern Ontario, Canada. Soil and Tillage Research 78: 151-170. Leão, T.P.; Silva, A.P.; Macedo, M.C.M.; Imhoff, S.; Euclides, V.P.B.
2006. Least limiting water range: a potential indicator of changes in near-surface soil physical quality after the conversion of Brazilian Savanna into pasture. Soil and Tillage Research 88: 279-285. Lima, H.V.; Lima, C.L.R.; Leão, T.P.; Cooper, M.; Silva, A.P.; Romero,
R.S. 2005. Agricultural machinery traffic and alterations in biopores under an orange orchard. Revista Brasileira de Ciência do Solo 29: 677-684 (in Portuguese, with abstract in English). McHugh, A.D.; Tullberg, J.N.; Freebairn, D.M. 2009. Controlled
traffic farming restores soil structure. Soil and Tillage Research 104: 164-172.
Murphy, C.P. 1986. Thin Section Preparation of Soils and Sediments. AB Academic Publishers, Bicester, Oxon, UK.
Neter, J.; Kutner, M.H.; Nachtsheim, C.J.; Wasserman, W. 1996. Applied Linear Statistical Models. IRWIN, Chicago, IL, USA. Otto, R.; Silva, A.P.; Franco, H.C.J.; Oliveira, E.C.A.; Trivelin, P.C.O.
2011. High soil penetration resistance reduces sugarcane root system development. Soil and Tillage Research 117: 201-210. Pagliai, M.; Vignozzi, N.; Pellegrini, S. 2004. Soil structure and the effect
of management practices. Soil and Tillage Research 79: 131-143. Reichert, J.M.; Suzuki, L.E.A.S.; Reinert, D.J.; Horn, R.;
Håkansson, I. 2009. Reference bulk density and critical degree-of-compactness for no-till crop production in subtropical highly weathered soils. Soil and Tillage Research 102: 242-254. Savage, M.J.; Ritchie, J.T.; Bland, W.L.; Dugas, W.A. 1996. Lower
limit of soil water availability. Agronomy Journal 88: 844-651. Silva, G.L.; Lima, H.V.; Campanha, M.M.; Gilkes, R.J.; Oliveira,
T.S. 2011. Soil physical quality of Luvisols under agroforestry, natural vegetation and conventional crop management systems in the Brazilian semi-arid region. Geoderma 167: 61-70. Soil Survey Staff. 2010. Keys to Soil Taxonomy. USDA-Natural
Resources Conservation Service, Washington, DC, USA. Souza, G.S.; Souza, Z.M.; Silva, R.B.; Araújo, F.S.; Barbosa, R.S.
2012. Soil compressibility and root systems of sugarcane with and without controlled-traffic farming. Pesquisa Agropecuária Brasileira 47: 603-612 (in Portuguese, with abstract in English). Tormena, C.A.; Silva, A.P.; Libardi, P.L. 1999. Soil physical quality of a
Brazilian Red oxisol under two tillage systems using the least limiting water range approach. Soil and Tillage Research 52: 223-232. Tullberg, J.N.; Yule, D.F.; McGarry, D. 2007. Controlled traffic