The epigenetic modifiers 5-aza-2
9
-deoxycytidine
and trichostatin A influence adipocyte
differentiation in human mesenchymal
stem cells
J. Zych
1, M.A. Stimamiglio
1, A.C. Senegaglia
2, P.R.S. Brofman
2, B. Dallagiovanna
1,
S. Goldenberg
1and A. Correa
11Laborato´rio de Biologia Ba´sica de Ce´lulas-Tronco, Instituto Carlos Chagas, FIOCRUZ, Curitiba, PR, Brasil 2Nu´cleo de Tecnologia Celular, Pontifı´cia Universidade Cato´lica do Parana´, Curitiba, PR, Brasil
Abstract
Epigenetic mechanisms such as DNA methylation and histone modification are important in stem cell differentiation. Methylation is principally associated with transcriptional repression, and histone acetylation is correlated with an active chromatin state. We determined the effects of these epigenetic mechanisms on adipocyte differentiation in mesenchymal stem cells (MSCs) derived from bone marrow (BM-MSCs) and adipose tissue (ADSCs) using the chromatin-modifying agents trichostatin A (TSA), a histone deacetylase inhibitor, and 5-aza-29-deoxycytidine (5azadC), a demethylating agent. Subconfluent MSC cultures were treated with 5, 50, or 500 nM TSA or with 1, 10, or 100mM 5azadC for 2 days before the
initiation of adipogenesis. The differentiation was quantified and expression of the adipocyte genes PPARG and FABP4 and of the anti-adipocyte gene GATA2 was evaluated. TSA decreased adipogenesis, except in BM-MSCs treated with 5 nM TSA. Only treatment with 500 nM TSA decreased cell proliferation. 5azadC treatment decreased proliferation and adipocyte differentiation in all conditions evaluated, resulting in the downregulation of PPARG and FABP4 and the upregulation of GATA2. The response to treatment was stronger in ADSCs than in BM-MSCs, suggesting that epigenetic memories may differ between cells of different origins. As epigenetic signatures affect differentiation, it should be possible to direct the use of MSCs in cell therapies to improve process efficiency by considering the various sources available.
Key words: Mesenchymal stem cells; Trichostatin A; 5-Aza-29-deoxycytidine; Adipocyte differentiation; Epigenetics
Introduction
Mesenchymal stem cells (MSCs) can give rise to multiple cell lines, including chondrocytes, osteoblasts and adipocytes (1). The differentiation process involves changes in morphology and cell function that are determined by different patterns of gene expression (2). The implementation of these gene expression programs is regulated by epigenetic mechanisms, such as histone modification and DNA methylation. Both types of mecha-nisms can modify chromatin structure, thereby influencing gene expression by affecting the accessibility of target sites to regulatory proteins and modifying the affinity of transcriptional regulators for their targets (3).
Histone modifications have been associated with the activity status of chromatin and with specific cellular processes. Histone acetylation is associated with the
activation of transcription (4) and is regulated by the balance between the opposing activities of histone acetyltransferases and histone deacetylases (HDACs) (5). Trichostatin A (TSA) is one of the most potent known inhibitors of HDACs. This hydroxamic acid is active at nanomolar concentrationsin vitro(6) and inhibits HDACs with zinc-containing catalytic sites (7), leading to the accumulation of acetylated histones in the nucleus and the subsequent activation of target genes (8).
DNA methylation is generally associated with tran-scriptional silencing and chromatin condensation (9). It involves the addition of a methyl group to cytosine bases and is catalyzed by DNA methyltransferases (DNMTs). The maintenance DNMT, DNMT1, specifically recognizes hemi-methylated DNA after replication and methylates the
Correspondence: J. Zych, Laborato´rio de Biologia Ba´sica de Ce´lulas-Tronco, Instituto Carlos Chagas, FIOCRUZ, Rua Prof. Algacyr Munhoz Mader, 3775, 81350-010 Curitiba, PR, Brasil. Fax: ++55-41-3316-3267. E-mail: [email protected]
daughter strand, ensuring faithful conservation of the methylation profile after replication. 5-Aza-29-deoxycytidine (5azadC) is a cytidine analog whose presence in DNA prevents DNMT1 from faithfully replicating the DNA methylation code during cell division. Instead, DNMT1 is inactivated by covalent binding to azacytosine residues in the CpG sites of DNA (10), leading to a passive loss of methylation.
Given the role of these epigenetic mechanisms in the regulation of gene expression, we investigated the effects of TSA and 5azadC on the differentiation of MSCs obtained from two distinct sources into adipocytes. As epigenetic signatures affect differentiation (11), it should be possible to direct the use of MSCs in cell therapies to improve process efficiency by considering the various sources available.
Material and Methods
Cell culture
MSCs were obtained and isolated from bone marrow and adipose tissue as described previously (12). All samples were collected after the subjects gave written informed consent, in accordance with guidelines for research involving human subjects, and with the approval of the Ethics Committee of Fundac¸a˜o Oswaldo Cruz, Brazil (protocol No. 419/07). Bone marrow (BM-MSC donors were 40 to 60 years old and had cardiomyopathy; adipose tissue stem cells (ADSCs) were obtained from 30- to 50-year-old donors undergoing selective bariatric surgery and dermolipectomy procedures. Seven BM-MSC samples and 9 ADSC samples were used in the present study. Cell isolation protocols yielded populations rich in adult MSCs. The cultures were evaluated by flow cytometry and differentiated into adipocytes, chondro-cytes and osteoblasts according to criteria defined by Dominici et al. (1). MSCs were cultured in DMEM supplemented with 10% fetal calf serum (Gibco Invitrogen, USA) plus 100 U/mL penicillin and 100mg/mL streptomycin (Sigma-Aldrich, USA). All cultures were maintained at 376C in a humidified atmosphere containing 5% CO2, and the culture medium was changed twice weekly. All samples were used at passages 4 to 6.
Adipocyte differentiation and treatment with TSA or 5azadC
TSA and 5azadC exert their effects mostly during replication. We therefore cultured BM-MSCs and ADSCs to 80% confluence and treated them with 5, 50, or 500 nM TSA or with 1, 10, or 100mM 5azadC (both from Sigma-Aldrich) for 2 days.
The cytotoxicity of the drugs was evaluated by MTT assay (Supplementary Material: Supplementary Material and Methods and Figure S1). For adipocyte induction, ADSCs or BM-MSCs were treated with culture medium supplemented with 1mM dexamethasone, 500mM IBMX,
1mg/mL insulin and 200mM indomethacin (all from Sigma-Aldrich). In control cultures, the same quantity of solvents used to dissolve TSA, 5azadC or adipogenic inductors was added to the culture medium, one control culture for each drug treatment, and the medium exchanges were carried out in parallel with treated cultures. The medium was changed twice weekly for 14 days (Supplementary Material: Figure S2).
Quantification of adipocyte differentiation by Oil Red O staining
Cells were washed with PBS, fixed by incubation with 4% paraformaldehyde for 30 min and washed again with PBS. They were then stained with a filtered solution of 0.5% Oil Red O (Sigma-Aldrich) for 1 h. The cells were thoroughly washed in water and allowed to dry in the air. The Oil Red O retained in the cells was extracted with isopropanol and quantified by measuring absorbance at 550 nm.
RT-PCR and real-time RT-PCR analyses
Total RNA was extracted with RNAeasy (Qiagen, USA) and the samples were treated with DNase I (Qiagen), according to manufacturer instructions. Complementary DNA (cDNA) was synthesized from 1mg total RNA, with oligo-dT primers and the IMPROM II reverse transcriptase kit (Promega, USA) according to manufacturer instructions.
PCR was carried out with 20 ng cDNA as the template, 10 pmol primers, 5 mM MgCl2, 0.25 mM dNTPs and 0.6 U Taq polymerase. PCR conditions included initial heating at 956C for 2 min, followed by 30 or 35 cycles of 946C for 15 s, annealing at the appropriate temperature for 30 s, and 726C for 40 s. We subjected 10mL PCR products to 2% agarose gel electrophoresis. The bands obtained were visualized by ethidium bromide staining and photographed under ultraviolet transillumination.
Quantitative real-time PCR was performed as described previously (12). For the analyses we used SYBR Green master mix (Applied Biosystems, UK) according to manufacturer instructions and the ABI PRISM 7000 sequence detection system (Applied Biosystems, USA). PCR conditions included initial heating at 956C for 10 min, followed by 45 cycles of 956C for 15 s, annealing at the appropriate temperature for 30 s, and at 726C for 30 s. The melting curves were acquired after PCR to confirm the specificity of the amplified products. A standard curve based on cycle threshold values was used to evaluate gene expression levels. Briefly, we used 1:5 dilutions of known concentrations of cDNA in triplicate to generate curves. We generated standard curves for each gene, including the housekeeping gene (GAPDH). Relative gene expression for each sample was normal-ized by dividing the value obtained for the gene evaluated by that obtained for the housekeeping gene. The primer sets, amplicon size and annealing temperature are listed in Table S1.
Western blotting
Cell extracts were prepared by adding lysis buffer (40 mM Tris-HCl, pH 6.8, 1% SDS, 2.5%b-mercaptoethanol, 6% glycerol, 0.005% bromophenol blue) supplemented with a protease inhibitor cocktail (Sigma-Aldrich) to the cultures. Cells were detached with a cell scraper and heated in the lysis buffer for 10 min at 946C. Protein content was quantified with the 2-D Quant kit (GE Healthcare, USA) and 10mg protein was used in each experiment. Western blot analyses were performed with rabbit polyclonal anti-acH3 antibody (1:2000; Millipore, USA) and rabbit polyclonal anti-actin antibody (1:100; Santa Cruz Biotechnology, USA). The ImageJ software was used for the quantitative analyses.
Immunofluorescence
MSCs growing on glass coverslips were fixed by incubation with 4% formaldehyde for 10 min and washed with PBS. The cells were permeabilized by incubation with 0.5% Triton X-100 in PBS for 30 min. They were then blocked with 5% BSA in PBS for 1 h and incubated with the primary antibody, rabbit polyclonal anti-acH3 antibody (1:400; Millipore), diluted in PBS plus 1% BSA, for 1 h at 376C. The cells were rinsed with PBS and incubated for 1 h at 376C with the AlexaFluor 546-conjugated goat anti-rabbit secondary antibody (Invitrogen, USA), at a dilution of 1:400. Cell nuclei were stained with DAPI. Images were obtained with an SP5 laser-scanning confocal microscope (Leica, Germany).
DNA content
We plated the same number of MSCs onto 75-cm2 culture flasks and treated them with 5azadC for 2 days. Genomic DNA was extracted with the Qiamp DNA mini kit (Qiagen) and its concentration was measured in triplicate with a NanoDrop ND-100 Spectrophotometer (Thermo Scientific, USA).
Cell proliferation assay
Cell cultures (at 80% confluence) were treated with 5azadC or TSA for 2 days and then incubated with 100mM BrdU (Invitrogen) for 24 h. The cells were detached with trypsin and fixed by incubation with 100% ethanol for 30 min on ice. The cells were collected by centrifugation and resuspended in 100mL distilled water. They were then heated for 5 min at 956C to denature the DNA and rapidly chilled in an ice-water bath. Cells were incubated with an Alexa Fluor 488-conjugated anti-BrdU antibody (Invitrogen) for 30 min at room temperature. Quantitative analyses of BrdU-labeled cells were per-formed with a FACSCanto II flow cytometer (BD Bioscience, USA) and the FlowJo software (Tree Star, USA).
Statistical analysis
At least three samples from three donors were
evaluated for each experiment. The Student t-test was used for statistical analysis and differences were con-sidered to be significant if P,0.05.
Results
Changes in histone acetylation during adipocyte differentiation
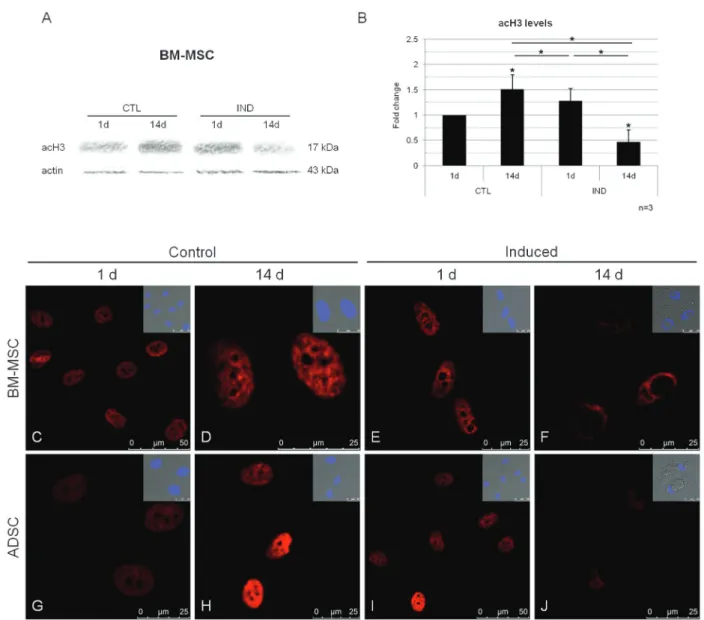
We investigated histone acetylation status during the differentiation of MSCs into adipocytes by evaluating acH3 levels 1 or 14 days after induction (Figure 1A-J). Control cells cultured for 14 days contained significantly larger amounts of acH3 than control cells cultured for 1 day and than induced cells after 14 days in culture (Figure 1B). Histone acetylation was modulated during adipogenesis; although not significant, an increase in acH3 was observed 24 h after the induction of differentiation, suggesting that chromatin remodeling was induced by this stimulus. Conversely, acH3 levels were significantly lower in differentiated cells (Figure 1B). We also investigated acH3 levels in cells by immunofluorescence techniques. A clear pattern was observed, with chromatin remodeling beginning 1 day after induction and differentiated cells displaying a staining pattern very different from that of non-induced cells on day 14 (Figure 1C-J).
Effect of TSA treatment on adipogenesis and MSC proliferation
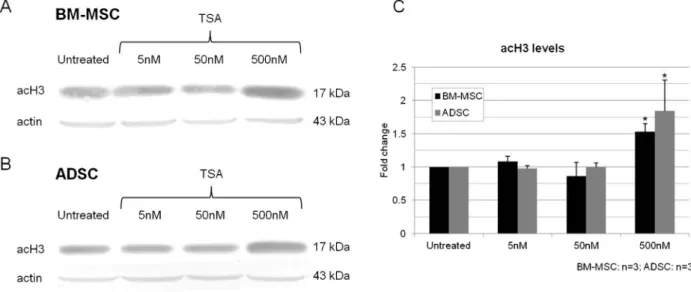
In order to evaluate the global effect of TSA on histone acetylation, we treated MSC cultures with 5, 50 or 500 nM TSA for 2 days and evaluated acH3 levels (Figure 2A and B). A significant increase in acH3 was detected only in BM-MSCs and ADSCs treated with 500 nM (Figure 2C).
We analyzed the expression of four genes after TSA treatments, two of them related and two unrelated to adipogenesis: PPARG, a master regulator of adipogen-esis (13), GATA2, an anti-adipogenic gene (13), BMP4, involved in osteoblast differentiation (14), and desmin, a muscle-specific marker (15). BM-MSCs and ADSCs had distinct profiles of gene expression. TSA treatment increased BMP4 and PPARG expression in BM-MSCs and ADSCs, although GATA2 did not change; desmin transcript level was increased in BM-MSCs and decreased in ADSCs (Figure 3A and B). Thus, TSA had distinct effects on BM-MSC and ADSC gene expression. We investigated the effects of TSA on adipocyte differentiation by treating MSCs with 5, 50, or 500 nM TSA for 2 days before the initiation of differentiation.
and D). The treatment of BM-MSCs with 5 nM TSA did not significantly modify differentiation or adipogenic gene expression, but PPARG expression levels were found to have increased in 4 of the 5 samples. BM-MSCs seemed to be more resistant to the effects of treatment since the 50 nM treatment significantly decreased gene expression only in ADSCs. Nevertheless, the 500 nM TSA treatment had a negative effect on both BM-MSCs and ADSCs. The expression of GATA2 was also analyzed in non-induced and induced cultures after 14 days (Figure 5A and B). We
found no clear correlation between GATA2 expression and adipocyte differentiation, or between the levels of expres-sion of GATA2, PPARG and FABP4.
We investigated whether the treatments interfered with proliferation. Analyses carried out 24 h after inhibitor removal showed that 500 nM treatment decreased the cell proliferation rate by a factor of 10, whereas treatment with 5 or 50 nM had no significant effect (Figure 5C). The effect of TSA on differentiation was dose-dependent, whereas that on cell proliferation was not.
Figure 1.Analysis of histone acetylation during the differentiation of MSCs into adipocytes.A, Western blot showing changes in acH3 levels after 1 and 14 days of control culture conditions (CTL) or adipocyte differentiation induction (IND); an actin probe was used as a loading control.B, Quantitative analyses of relative acH3 levels. Data are reported as means ± SD. MSCs = mesenchymal stem cells; BM-MSCs = bone marrow MSCs; ADSCs = adipose tissue stem cells; d = day. Asterisks just above SD bars show the statistical significance of the difference with respect to control cultures after 1 day. *P,0.05 (Studentt-test).C-J, Immunofluorescence images of BM-MSCs (C-F) and ADSCs (G-J), showing acH3 staining (red) after 1 and 14 days of induction or non-induction. Minor boxes show merged images of differential interference contrast and nuclei counterstained with DAPI.
Effect of 5azadC treatment on adipogenesis and MSC proliferation
We investigated the effects of 5azadC on adipogen-esis by evaluating cultures treated with 1, 10, or 100mM 5azadC for 2 days before induction. In order to assure the
effect of 5azadC on the cells, we evaluated the overall levels of methylcytosine and the transcript levels of TP73, a gene that is not expressed in BM-MSCs and whose expression is reactivated by 5azadC (17). Methylcytosine was reduced in a global manner with the drug treatments
Figure 2.Analysis of histone acetylation in MSCs after 2 days of treatment with TSA (5, 50 and 500 nM).A,B, Western blot analysis of acH3 levels in cultured BM-MSCs (A) and ADSCs (B); an actin probe was used as a loading control.C, Quantitative analysis of relative levels of acH3 in cultured BM-MSCs and ADSCs. MSCs = mesenchymal stem cells; TSA = trichostatin A; BM-MSCs = bone marrow MSCs; ADSCs = adipose tissue stem cells. Data are reported as means ± SD. Asterisks just above SD bars indicate a statistically significant difference with respect to untreated cultures of BM-MSCs or ADSCs. *P,0.05 (Studentt-test).
and TP73 was expressed in treated cultures in a dose-dependent manner (Supplementary Material: Figure S4A and B, Supplementary Material and Methods).
After 2 days of treatment with 5azadC, PPARG expression was increased while GATA2 did not change in either BM-MSCs or ADSCs. Desmin expression was increased only in BM-MSCs while BMP4 was increased only in ADSCs (Figure 6A and B). After analyzing the expression of genes related or not to adipogenesis in response to 5azadC treatment, we investigated the effects of the drug on adipocyte differentiation. Adipogenesis was significantly decreased in both BM-MSCs and ADSCs (Figure 7A and B; Supplementary Material: Figure S5). Furthermore, PPARG expression was significantly decreased by all the concentrations tested in the induced cultures. FABP4 expression was also decreased by
treatment, significantly for concentrations of 10 and 100mM 5azadC (Figure 7C and D). GATA2 expression was found to have increased in non-induced cultures treated with 5azadC (Figure 8A) and in induced cultures (Figure 8B) after 14 days. Not all the differences were statistically significant, but a fold-change increase with treatment was noted for all the samples evaluated (Tables in Figure 8A and B). An inverse correlation between the expression levels of the adipogenic genes and those of GATA2 was confirmed. Overall, ADSCs were more strongly affected by treatment than BM-MSCs: the decrease in adipogenesis, the downregulation of PPARG and FABP4 and the upregulation of GATA2 were more intense in ADSC cultures than in BM-MSCs.
We determined the DNA content of cultures treated with 5azadC for 2 days, but no significant difference was
Figure 4.Effect of treatment with TSA (5, 50 and 500 nM) on differentiation of MSCs.A, Effect of TSA on the adipogenic differentiation of BM-MSCs and ADSCs observed in cell cultures after staining with Oil Red O.B, Relative quantification of adipocyte differentiation. C, PPARG andD, FABP4 expression in the cultures after 14 days of adipocyte differentiation. TSA = trichostatin A; MSCs = mesenchymal stem cells; BM-MSCs = bone marrow MSCs; ADSC = adipose tissue stem cells. Data are reported as means ± SD. Asterisks just above SD bars indicate statistically significant differences with respect to untreated cultures of BM-MSCs or ADSCs. *P,0.05 (Studentt-test).
found (Figure 8C). Analyses 24 h after inhibitor removal showed that cell proliferation rates fell by about 40 to 50% in MSCs treated for 2 days with any concentration of 5azadC (Figure 8D). The effect of 5azadC on cell proliferation, like that on differentiation, was dose-dependent.
Discussion
Cell differentiation involves epigenetic modifications of the cellular genome (18,19). We therefore investigated the effect of various concentrations of the epigenetic modifiers TSA and 5azadC on the differentiation of MSCs isolated from two distinct sources into adipocytes.
We observed changes in acH3 during adipogenesis,
with a global increase just after the start of induction, and a significant global reduction in differentiated cells. Embryonic stem cells display high levels of acH3 and acH4 (20). Interestingly, a slight increase in acH4 level in embryonic stem cells was reported in a previous study 24 h after the onset of differentiation (21). According to the authors, concurrent increases in acH4 and 3meH3K9 levels very early during differentiation suggest that heterochromatin is formed, with a transient increase in the transcriptional potential of euchromatin, allowing simultaneous activation and repression to occur in different parts of the genome, according to the needs of the cell for differentiation.
An overall decrease in acetylation has been observed
in differentiated cells, but histone acetylation of the promoters of adipogenic genes increases during adipocyte differentiation, and this increase is correlated with an increase in the expression of these genes (22). The effect of HDAC inhibitors on gene expression involves changes in the transcription of only a specific subset of genes (1-10%) (5-7). Thus, although the acetylation of a subset of genes associated with adipogenesis occurs in MSCs undergoing adipogenesis, most of the other genes probably remain deacetylated.
MSCs express small amounts of adipogenic factors in addition to osteogenic factors. Factors of one lineage repress factors of the other lineages, thereby maintaining the undifferentiated state. Under appropriate conditions the balance is tipped, leading to a cascade that promotes one cell fate while repressing other possible fates (13).
We found that PPARG and BMP4 were upregulated after TSA treatment. As adipocyte differentiation was decreased, we supposed that osteogenesis was favored. Accordingly, the treatment of 3T3-L1 cells with TSA during differentiation led to a decrease in adipogenesis (8,23). MSCs from adipose tissue or umbilical cord blood treated with the HDAC inhibitors, valproic acid and sodium butyrate, reduced the efficiency of adipogenic, chondrogenic, and neurogenic differentiation, while osteogenic differentiation was augmented (24). Conversely, the treatment of BM-MSC cultures with TSA before the induction favored chondrogenesis, but not osteogenesis (25).
We observed that desmin was increased in BM-MSCs
and decreased in ADSCs after TSA treatment. As TSA enhances myogenesis in C2C12 cells (26), we suppose that myogenesis could be favored in BM-MSCs instead of adipogenesis.
We found that adipogenesis in both ADSCs and BM-MSCs, with the exception of the 5 nM treatment, was decreased by the treatments. BM-MSCs differentiate more efficiently in bone and cartilage, whereas ADSCs differentiate better into adipocytes (2). Therefore, the epigenome differs among MSCs, and could explain the distinct gene expression and the more pronounced effect on adipocyte differentiation in ADSCs than in BM-MSCs resulting from TSA treatment. Based on our findings and on those of previous studies investigating the effect of HDAC inhibitors on differentiation, we may conclude that the action of TSA and other HDAC inhibitors is dependent on the concentration used, cell type and the cell differentiation model evaluated.
Only treatment with 500 nM TSA significantly increased the amount of acH3 detectable by Western blotting, but this concentration had a negative effect on cell proliferation. Treatments with 5 or 50 nM TSA had no major effect on acH3 levels or cell proliferation. Nevertheless, prior treatment with TSA under all condi-tions tested resulted in a decrease in adipogenesis, regardless of the effect on proliferation. The decrease in adipogenesis was not accompanied by a significant downregulation of adipogenic gene expression in all treatments, but there may have been an upregulation of
Figure 6.Effect of 5-aza-29-deoxycytidine (5azadC) treatment (1, 10 and 100mm) on gene expression in MSCs. PPARG, GATA2, BMP4, and DES (desmin) were analyzed by RT-PCR after 2 days of treatment. GAPDH was used as control. MSCs = mesenchymal stem cells; BM-MSCs = bone marrow MSCs; ADSC = adipose tissue stem cells.
anti-adipogenic genes, such as GATA2. However, we found no evidence of a response involving the regulation of GATA2 by TSA, although other anti-adipogenic genes have yet to be investigated.
It should be stressed that HDACs also deacetylate several non-histone proteins, including some with regula-tory roles in cell proliferation, cell migration and cell death (7). These factors may be the primary targets of HDACs, because HDACs evolved before histones (27). The GATA2 protein has multiple acetylation sites, which increase its DNA-binding activity, providing control points for regulation (28). GATA2 is present as an acetylated protein in precursor cells (29,30). As GATA2 is a nuclear
target for HDAC3-mediated repression (31), the treatment of cells with TSA should increase the protein activity, inhibiting adipogenesis because GATA2 inhibits the transcription of PPARG and CEBPA (13). Although we observed that GATA2 transcript level did not change after the TSA treatments, the protein level and/or activity could have been increased. Thus, the treatment of cells with agents such as TSA that inhibit HDAC and affect regulatory elements other than histones results in both epigenetic and non-epigenetic effects.
The demethylation of promoter region DNA by 5azadC can lead to gene activation and expression. Like TSA, 5azadC causes the general, nonspecific demethylation of
DNA, and this process may affect multiple regulatory pathways (32). However, for unknown reasons, not all genes are affected by 5azadC. Only about 1% of transcripts were found to be differentially expressed in a cell line treated with 5azadC (33).
We found that 5azadC treatment increased PPARG immediately following the treatments. Although higher levels of GATA2 were observed in cord blood cell cultures
treated concomitantly with 5azadC and TSA (34), we did not observe an evident change in GATA2 expression following the treatments.
Adipogenic differentiation was decreased in a dose-dependent manner concomitantly with the downregulation of PPARG and FABP4 expression, and the upregulation of GATA2 in induced cultures treated with 5azadC. An inverse relationship was observed between the strength
Figure 8.Effect of treatment with 5azadC (1, 10 and 100mm) on GATA2 expression and proliferation in MSCs. GATA2 expression in non-induced (control, CTL,A) or induced (IND,B) cultures treated with 5azadC.C, DNA content was not modified by 2 days of 5azadC treatment.D, Cell proliferation analysis after treatment with 5azadC. 5azadC = 5-aza-29-deoxycytidine; MSCs = mesenchymal stem cells; BM-MSCs = bone marrow MSCs; ADSCs = adipose tissue stem cells. Data are reported as means ± SD. Asterisks just above SD bars indicate statistically significant differences with respect to untreated cultures of BM-MSCs or ADSCs. *P,0.05 (Studentt-test).
of expression of adipogenic genes and that of GATA2. The treatment of cultures with 5azadC only increased the expression of GATA2 after 14 days of culture.
The treatment of 3T3-L1 cells with inhibitors of DNA methylation decreases adipocyte differentiation, but the magnitude of the effect depends on exposure time and drug concentration. Treatment in early stages of differ-entiation has a stronger effect than treatment at later stages or continuous treatments (35,36). In addition, the treatment of BM-MSC cultures with 5azadC before induction stimulated osteogenesis (25). The balanced differentiation of MSCs in the bone marrow into adipo-cytes or osteoblasts is controlled in a competitive manner, with mechanisms promoting one cell fate actively sup-pressing mechanisms inducing the other lineage (37). Thus, osteogenesis is favored over adipogenesis in BM-MSCs treated with 5azadC. In agreement, 5azadC treatment upregulated BMP4 in ADSCs, although no evident increase was observed in BM-MSCs. The demethylating agent 5-azacytydine promotes myogenic differentiation of C2C12 cells (15,38). As desmin was increased in treated BM-MSCs, we suggest that myogen-esis is favored by the treatment.
DNA content did not change significantly during the 2 days of treatment with 5azadC, but cell proliferation rates were lower when differentiation was induced. Significant inhibition of DNA synthesis due to a lack of repair of Dnmt1 linked to the incorporation of 5azadC into DNA does not occur for at least two cell cycles (39). It is therefore reasonable to assume that no early difference in DNA content has been identified. The decrease in the proliferation of treated cultures may be an important factor in the observed decrease in adipogenesis, as it was found
to be proportional: higher concentrations of 5azadC resulted in greater inhibition of adipogenesis and stronger negative effects on cell proliferation.
We showed in the present study that TSA and 5azadC treatments influence the adipogenic differentiation of MSCs. We cannot rule out an indirect mechanism. The effects on differentiation should be considered with caution, because the whole epigenome is being affected. Our observations could be a cascade of indirect effects.
ADSCs were more sensitive to the treatments than BM-MSCs, probably due to epigenetic memory, that is dependent on their origin. The epigenetic landscape of any cell is likely to be a sensitive indicator of its past and current developmental state and may predict its future potential (40). It is therefore important to investigate differences and similarities between same cell types from distinct sources.
Supplementary Material
Click here to view [pdf]
Acknowledgments
We would like to thank Criscielle Kuligovski, Lidiane Maria Boldrini, Maurilio Jose´ Soares, Stenio Perdiga˜o Fragoso, Patrı´cia Shigunov, Ana Carolina Origa, Axel Cofre´, Ana Paula Abud, Alessandra Aguiar, and Andressa Schittini for technical assistance and scientific advice. Research supported by CNPq (CT-Sau´de/MS/SCTIE/ DECIT/MCT/CNPq #17/2008). J. Zych, S. Goldenberg and B. Dallagiovanna hold fellowships from CNPq and A. Correa from Fundac¸a˜o Arauca´ria.
References
1. Dominici M, Le Blanc K, Mueller I, Slaper-Cortenbach I, Marini F, Krause D, et al. Minimal criteria for defining multipotent mesenchymal stromal cells. The International Society for Cellular Therapy position statement.Cytotherapy 2006; 8: 315-317, doi: 10.1080/14653240600855905. 2. Liu TM, Martina M, Hutmacher DW, Hui JH, Lee EH, Lim B.
Identification of common pathways mediating differentiation of bone marrow- and adipose tissue-derived human mesench-ymal stem cells into three mesenchmesench-ymal lineages.Stem Cells 2007; 25: 750-760, doi: 10.1634/stemcells.2006-0394. 3. Meshorer E, Misteli T. Chromatin in pluripotent embryonic
stem cells and differentiation.Nat Rev Mol Cell Biol2006; 7: 540-546, doi: 10.1038/nrm1938.
4. Kouzarides T. Chromatin modifications and their function. Cell2007; 128: 693-705, doi: 10.1016/j.cell.2007.02.005. 5. de Ruijter AJ, van Gennip AH, Caron HN, Kemp S, van
Kuilenburg AB. Histone deacetylases (HDACs): character-ization of the classical HDAC family.Biochem J2003; 370: 737-749, doi: 10.1042/BJ20021321.
6. Taddei A, Roche D, Bickmore WA, Almouzni G. The effects of histone deacetylase inhibitors on heterochromatin:
implications for anticancer therapy?EMBO Rep 2005; 6: 520-524, doi: 10.1038/sj.embor.7400441.
7. Dokmanovic M, Clarke C, Marks PA. Histone deacetylase inhibitors: overview and perspectives. Mol Cancer Res 2007; 5: 981-989, doi: 10.1158/1541-7786.MCR-07-0324. 8. Kim SN, Choi HY, Kim YK. Regulation of adipocyte
differentiation by histone deacetylase inhibitors.Arch Pharm Res2009; 32: 535-541, doi: 10.1007/s12272-009-1409-5. 9. Jones PA, Takai D. The role of DNA methylation in
mammalian epigenetics. Science 2001; 293: 1068-1070, doi: 10.1126/science.1063852.
10. Christman JK. 5-Azacytidine and 5-aza-29-deoxycytidine as inhibitors of DNA methylation: mechanistic studies and their implications for cancer therapy.Oncogene2002; 21: 5483-5495, doi: 10.1038/sj.onc.1205699.
mesenchymal stem cells from bone marrow, umbilical cord blood, and adipose tissue.Exp Biol Med 2008; 233: 901-913, doi: 10.3181/0712-RM-356.
13. Rosen ED, MacDougald OA. Adipocyte differentiation from the inside out.Nat Rev Mol Cell Biol2006; 7: 885-896, doi: 10.1038/nrm2066.
14. Chen G, Deng C, Li YP. TGF-beta and BMP signaling in osteoblast differentiation and bone formation.Int J Biol Sci 2012; 8: 272-288, doi: 10.7150/ijbs.2929.
15. Feng SW, Chen F, Cao J, Yu MJ, Liang YY, Song XM, et al. Restoration of muscle fibers and satellite cells after isogenic MSC transplantation with microdystrophin gene delivery. Biochem Biophys Res Commun 2012; 419: 1-6, doi: 10.1016/j.bbrc.2012.01.029.
16. Cristancho AG, Lazar MA. Forming functional fat: a growing understanding of adipocyte differentiation.Nat Rev Mol Cell Biol2011; 12: 722-734, doi: 10.1038/nrm3198.
17. Liang W, Xia H, Li J, Chunhua ZR. 5-Aza-29-deoxycytidine increases the sensitivity of human bone marrow mesench-ymal stem cells to chemotherapeutic agents by demethyla-tion of p73.J Pediatr Hematol Oncol2012; 34: 108-115. 18. Arney KL, Fisher AG. Epigenetic aspects of differentiation.J
Cell Sci2004; 117: 4355-4363, doi: 10.1242/jcs.01390. 19. Wu H, Sun YE. Epigenetic regulation of stem cell
differentiation. Pediatr Res 2006; 59: 21R-25R, doi: 10.1203/01.pdr.0000203565.76028.2a.
20. Mattout A, Meshorer E. Chromatin plasticity and genome organization in pluripotent embryonic stem cells.Curr Opin Cell Biol2010; 22: 334-341, doi: 10.1016/j.ceb.2010.02.001. 21. Meshorer E, Yellajoshula D, George E, Scambler PJ, Brown DT, Misteli T. Hyperdynamic plasticity of chromatin proteins in pluripotent embryonic stem cells.Dev Cell2006; 10: 105-116, doi: 10.1016/j.devcel.2005.10.017.
22. Yoo EJ, Chung JJ, Choe SS, Kim KH, Kim JB. Down-regulation of histone deacetylases stimulates adipocyte differentiation. J Biol Chem 2006; 281: 6608-6615, doi: 10.1074/jbc.M508982200.
23. Lagace DC, Nachtigal MW. Inhibition of histone deacetylase activity by valproic acid blocks adipogenesis.J Biol Chem 2004; 279: 18851-18860, doi: 10.1074/jbc.M312795200. 24. Lee S, Park JR, Seo MS, Roh KH, Park SB, Hwang JW,
et al. Histone deacetylase inhibitors decrease proliferation potential and multilineage differentiation capability of human mesenchymal stem cells.Cell Prolif2009; 42: 711-720, doi: 10.1111/j.1365-2184.2009.00633.x.
25. El-Serafi AT, Oreffo RO, Roach HI. Epigenetic modifiers influence lineage commitment of human bone marrow stromal cells: Differential effects of 5-aza-deoxycytidine and trichostatin A. Differentiation 2011; 81: 35-41, doi: 10.1016/j.diff.2010.09.183.
26. Hagiwara H, Saito F, Masaki T, Ikeda M, Nakamura-Ohkuma A, Shimizu T, et al. Histone deacetylase inhibitor trichostatin A enhances myogenesis by coordinating muscle regulatory factors and myogenic repressors. Biochem Biophys Res Commun2011; 414: 826-831, doi: 10.1016/ j.bbrc.2011.10.036.
27. Gregoretti IV, Lee YM, Goodson HV. Molecular evolution of
the histone deacetylase family: functional implications of phylogenetic analysis. J Mol Biol 2004; 338: 17-31, doi: 10.1016/j.jmb.2004.02.006.
28. Hayakawa F, Towatari M, Ozawa Y, Tomita A, Privalsky ML, Saito H. Functional regulation of GATA-2 by acetylation.J Leukoc Biol2004; 75: 529-540, doi: 10.1189/jlb.0603289. 29. Orlic D, Anderson S, Biesecker LG, Sorrentino BP, Bodine
DM. Pluripotent hematopoietic stem cells contain high levels of mRNA for c-kit, GATA-2, p45 NF-E2, and c-myb and low levels or no mRNA for c-fms and the receptors for granulocyte colony-stimulating factor and interleukins 5 and 7. Proc Natl Acad Sci U S A 1995; 92: 4601-4605, doi: 10.1073/pnas.92.10.4601.
30. Tong Q, Dalgin G, Xu H, Ting CN, Leiden JM, Hotamisligil GS. Function of GATA transcription factors in preadipocyte-adipocyte transition. Science 2000; 290: 134-138, doi: 10.1126/science.290.5489.134.
31. Ozawa Y, Towatari M, Tsuzuki S, Hayakawa F, Maeda T, Miyata Y, et al. Histone deacetylase 3 associates with and represses the transcription factor GATA-2.Blood2001; 98: 2116-2123, doi: 10.1182/blood.V98.7.2116.
32. Komashko VM, Farnham PJ. 5-azacytidine treatment reorganizes genomic histone modification patterns. Epigenetics2010; 5: 229-240, doi: 10.4161/epi.5.3.11409. 33. Menendez L, Walker D, Matyunina LV, Dickerson EB,
Bowen NJ, Polavarapu N, et al. Identification of candidate methylation-responsive genes in ovarian cancer. Mol Cancer2007; 6: 10, doi: 10.1186/1476-4598-6-10. 34. Araki H, Yoshinaga K, Boccuni P, Zhao Y, Hoffman R,
Mahmud N. Chromatin-modifying agents permit human hematopoietic stem cells to undergo multiple cell divisions while retaining their repopulating potential.Blood2007; 109: 3570-3578, doi: 10.1182/blood-2006-07-035287.
35. Sakamoto H, Kogo Y, Ohgane J, Hattori N, Yagi S, Tanaka S, et al. Sequential changes in genome-wide DNA methylation status during adipocyte differentiation.Biochem Biophys Res Commun2008; 366: 360-366, doi: 10.1016/ j.bbrc.2007.11.137.
36. Guo W, Zhang KM, Tu K, Li YX, Zhu L, Xiao HS, et al. Adipogenesis licensing and execution are disparately linked to cell proliferation. Cell Res 2009; 19: 216-223, doi: 10.1038/cr.2008.319.
37. Muruganandan S, Roman AA, Sinal CJ. Adipocyte differ-entiation of bone marrow-derived mesenchymal stem cells: cross talk with the osteoblastogenic program.Cell Mol Life Sci2009; 66: 236-253, doi: 10.1007/s00018-008-8429-z. 38. Hupkes M, Jonsson MK, Scheenen WJ, van Rotterdam W,
Sotoca AM, van Someren EP, et al. Epigenetics: DNA demethylation promotes skeletal myotube maturation. FASEB J2011; 25: 3861-3872, doi: 10.1096/fj.11-186122. 39. Davidson S, Crowther P, Radley J, Woodcock D.
Cytotoxicity of 5-aza-29-deoxycytidine in a mammalian cell system. Eur J Cancer 1992; 28: 362-368, doi: 10.1016/ S0959-8049(05)80054-1.
40. Meissner A. Epigenetic modifications in pluripotent and differentiated cells. Nat Biotechnol 2010; 28: 1079-1088, doi: 10.1038/nbt.1684.