ABSTRACT: The area under mechanized sugarcane (Saccharum spp.) harvesting is expanding in Brazil, increasing the return of trash to the soil. The main questions regarding this manage-ment are: (i) after adopting unburned mechanical harvesting, how long will it take to observe decreases in fertilizer requirements, (ii) what will be the magnitude of this decrease and, (iii) the impact in the short run of removing trash for energy purposes in the nutrient cycling? This study aimed to build an N prediction model for long term assessment of the contribution of sugarcane crop residues to sugarcane nutrition and to evaluate the cycling of other nutrients derived from crop residues. Keeping crop residues over the soil will increase soil N stock and N recovery by sugarcane, reaching equilibrium after 40 years with recovery of approximately 40 kg ha–1 year–1 of N. Removing trash for energy production will decrease the potential reduction in N fertilizer re-quirement. Of the total nutrients in the trash, 75 % of the K2O (81 kg ha–1 year–1) and 50 % of the N (31 kg ha–1 year–1) are in the tops, indicating the importance of maintaining tops in the soil to sustain soil fertility. Because the input data employed in the simulations are representative of the conditions in Southeast Brazil, these results might not be definitive for situations not represented in the experiments used in the study, but the model produced is useful to forecast changes that occur in the soil under different trash management.
Introduction
Sugarcane (Saccharum spp.) trash consists of dry leaves, tops and variable amounts of cane stalks, vary-ing from 10 to 20 t ha–1 of dry matter, presents high C to
N ratio (80 to 110:1) and contains 30 to 80 kg ha–1 of N
(Basanta et al., 2003; Fortes et al., 2012; Gava et al., 2003; Robertson and Thorburn, 2007a; Thorburn et al., 2005; Trivelin et al., 1995; Vitti et al., 2011). The high C/N ratio of trash results in significant N immobilization due to in-creased microbiological activity caused by energy input into the soil, leading to slow rates of N release in the short term (Meier et al., 2006). N recovery by sugarcane from crop residues was assessed using 15N tracer
tech-niques and was found to vary from 3 to 15 % (Basanta et al., 2003; Fortes et al., 2013; Gava et al., 2003; Ng Kee Kwong et al., 1987; Vitti et al., 2010; Vitti et al., 2011).
On a long-term approach, variations in trash-15N
re-covery by sugarcane have been found. Fortes et al. (2013) obtained trash-15N recovery accumulated in a 3-yr period
varying from 17 % to 31 %, whereas Basanta et al. (2003) found 6 % after two seasons. Since most of the trash-de-rived N stays in the soil N pool (Meier et al., 2006; Fortes et al., 2013), the differences observed can be explained, at least in part, by variations on weather conditions fa-voring plant growth and uptake of trash-N mineralized.
In Australia, Robertson and Thorburn (2007a) found retention of 13 % of the C and 79 % of the N derived from the trash in the soil after six years. The authors also reported that mineralization of trash-N be-came gradually available to the crop, reaching equilib-rium after 40 years with the supply of approximately 40 kg ha–1 year–1 of N. Trash can also supply other
nutri-ents to the soil-plant ecosystem. Previous studies have indicated an intensive cycling of K from sugarcane crop residues (Fortes et al., 2012; Oliveira et al., 1999). The unknown is how much time is required for trash preser-vation to decrease fertilizer requirements and the mag-nitude of this decrease.
This study aimed to build a model with the avail-able data related to N recovery by sugarcane from crop residues under Brazilian field conditions and provide a long-term assessment of the contribution of trash to nu-trient availability for sugarcane over consecutive crops.
Materials and Methods
This study was divided in two main parts; the first based on published data on recovery of N from crop residues to build up a simple model to predict the role of trash on N nutrition in the long term, and the sec-ond using original data (obtained in two field trials) to
Received September 17, 2012
Accepted July 05, 2013
1USP/CENA, Av. Pádua Dias, 303 – 13400-970 – Piracicaba, SP – Brasil.
2CNPEM/CTBE – Laboratório Nacional de Ciência e Tecnologia do Bioetanol, Polo II de Alta Tecnologia, R. Giuseppe Máximo Scolfaro, 10.000 − 13083-970 − Campinas, SP − Brasil.
3Agência Paulista de Tecnologia dos Agronegócios, Pólo Regional Centro Sul, Rod. SP 127, km 30 –13400-970 – Piracicaba, SP – Brasil.
4BP Biocombustíveis S/A, Av. das Nações Unidas, 12399 – 04578-000 – São Paulo, SP – Brasil.
5Agrolatino Fertilizantes Especiais, R. Elias Raimundo de Brito, 596 – 15991-151 – Matão, SP – Brasil.
6Universidade Federal Rural do Pernambuco, R. Dom Manoel de Medeiros, s/n, Dois Irmãos – 52171-900 – Recife, PE – Brasil. 7IAC, Centro de Pesquisa e Desenvolvimento de Solos e Recursos Ambientais, Av. Barão de Itapura, 1481 – 13012-970 – Campinas, SP – Brasil.
*Corresponding author <[email protected]>
Edited by: João Luís Nunes Carvalho
Impact of sugarcane trash on fertilizer requirements for São Paulo, Brazil
Paulo Cesar Ocheuze Trivelin1*, Henrique Coutinho Junqueira Franco2, Rafael Otto1, Danilo A. Ferreira2, André Cesar Vitti3, Caio
evaluate the cycling of nutrients from sugarcane trash components (dry leaves and tops) in consecutive crop cycles.
Part 1: Recovery of N from crop residues
Calculations were performed using previously published data on recovery of N from crop residues by sugarcane. The data used was from green cane fields (unburned and harvested mechanically). The crop cycles consisted of the plant crop and four ratoons. Therefore the total length of each crop cycle was six years. The trial field was established in Mar 2005 and the plant crop was harvested in Sept 2006 at the age of 18 months. Af-terwards, the ratoons were harvested every 12 months, from 2007 to 2010. The second cycle started in 2011 and followed the sequence presented for the first cycle. In or-der to simulate the amount of trash-N produced in each crop cycle and the trash-N recovery by sugarcane, the following procedures were adopted:
Trash-N produced
N from previous crop residues (N-PCR): the amount of N incorporated into the soil after soil prepa-ration prior to sugarcane planting every six years was assumed as 80 kg ha–1 of N (Franco et al., 2007). Such
residues are derived from shoot and root system from the previous sugarcane cycle, as well as trash produced during the last sugarcane harvest and old trash from pre-vious years of that same cycle (Franco et al., 2007).
N from post harvest trash (N-PHT): we consid-ered a trash biomass production ratio of 10 t of dry mat-ter (DM) of crop residue for each 100 t of stalks (fresh weight), based on Roberston and Thorburn (2007b). The simulated sugarcane yield was 150, 120, 98, 90 and 80 t ha–1 of stalks during plant crop to fourth
ra-toon, respectively. These values were arbitrarily chosen based on average yields of commercial sugarcane fields in the Central-South region of Brazil, under high input management system. The N concentration in the trash was considered 4 g kg–1 in a DM basis (Trivelin et al.,
1995).
Table 1 shows the calculation procedures adopted for obtaining N-PCR and N-PHT over the crop cycles, as well as assuming 100, 70, 50, 30, and 10 % of trash maintenance over the soil.
Recovery of trash-N
Recovery of N from post harvest trash (RN-PHT) by sugarcane: in order to estimate the N recovery in the long term, we considered the published data using 15N
labeled trash (Table 2). Most researchers evaluated the recovery of trash-N in the 1st year and a limited number
of trials evaluated such recovery in the following years. Due to this limitation, we considered the average value of trash-N recovery (Table 2). The values were obtained considering the recovery of trash-N by the aboveground components of sugarcane. In order to consider the re-covery by the whole sugarcane plant (aboveground and
belowground parts), we considered that around 80 % the total N accumulated in sugarcane is found in aboveg-round components and 20 % in the root system (Trivelin et al., 2002), yielding a factor of 1.2.
The data presented on Table 2 were obtained from several authors who did not apply N fertilizer over the trash. Fortes et al. (2013) found recovery of trash-N ac-cumulated over a three year period, of 16.9 % and 30.7 % in plots without N fertilizer and plots with 150 kg ha–1 N over the trash, respectively. Based on this result,
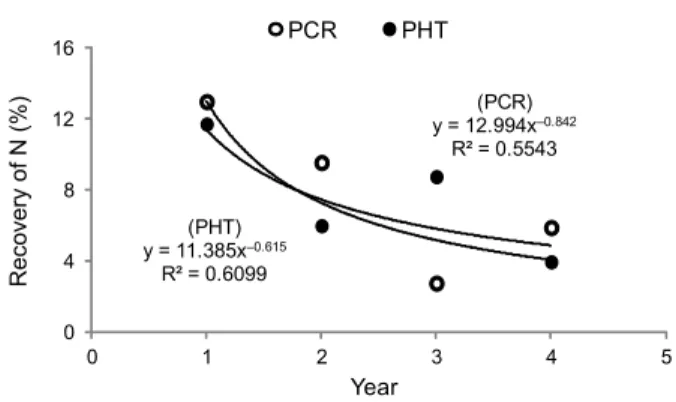
we adopted a factor of 1.82 (30.7/16.9) to consider the effect of N fertilization in increasing the recovery of trash-N. Finally, estimation was performed to reduce the dependence of results obtained with a limited num-ber of studies making use of periods of evaluation over two years. From the equations shown in Figure 1, the estimated values of recovery of trash-N (RN-PHT) after 1, 2, 3, and 4 years were respectively 11.4, 7.4, 5.8, and 4.9 %.
Recovery of N from previous crop residues (RN-PCR): Fortes et al. (2013) studied the recovery of N from aboveground and belowground sugarcane residues by the subsequent sugarcane crop up to four years after res-idues were applied. Using the data of Fortes et al. (2013) and considering aboveground components account for 70 % of the total sugarcane residues and belowground
Table 1 – Amount of N left on the field from previous crop residues (N-PCR) or post harvest trash (N-PHT) over the years, assuming rates of trash preservation of 100, 70, 50, 30 or 10 %.
Componenta Stalk yield N according to rate of trash preservation 100 % 70 % 50 % 30 % 10 %
t ha–1 _____________ kg N ha–1 _____________
N-PCR - 80.0 69.2 62.0 54.8 47.6
N-PHT (t1) 150 60.0 42.0 30.0 18.0 6.0
N-PHT (t2) 120 48.0 33.6 24.0 14.4 4.8
N-PHT (t3) 98 39.2 27.4 19.6 11.8 3.9
N-PHT (t4) 90 36.0 25.2 18.0 10.8 3.6
N-PHT(t5) 80 32.0 22.4 16.0 9.6 3.2
aN-PCR, 80 kg ha–1 N based on Franco et al. (2007). t1 to t5 refer to first through fifth crop cycle. N-PHT (kg ha–1)=yield•trashbiomassproduction
ratio•Ncontentintrash•%oftrashmaintenance,inwhichyieldrefertostalk
production (in a fresh matter basis). trash biomass production ratio of 10 t trash per 100 t stalk (Robertson and Thorburn, 2007b). N content in trash of 4 g N kg trash (Trivelin et al., 1995).
Table 2 – Collation of results from previous studies on recovery of N from post harvest trash (RN-PHT) in sequential years.
Year References
a
Average
1 2 3 4 5
Recovery of trash-15N (RN-PHT, %)
1 3.1 8.0 5.2 3.0 7.5 5.4
2 - - 2.4 3.7 2.1 2.7
3 - - - 0.6 7.4 4.0
4 - - - 1.8 - 1.8
(roots and rhizomes) the remaining 30 % (Franco et al., 2007), the balanced RN-PCR yielded 10.8, 7.9, 2.3, and 4.9 % respectively by the first, second, third and fourth sugarcane crop. Applying the 1.2 factor to consider the recovery by the whole sugarcane plant, as well as the same estimation approach previously presented (Figure 1), RN-PCR by the first, second, third, fourth and fifth sugarcane crop were respectively 13.0, 7.2, 5.2, 4.0, and 3.4 %.
Recovery of N from long term trash decomposition (RN-LTTD): the amount of residue-N produced in a six year cycle is far greater than the recovered by sugarcane in such period. This difference is the N that will feed the pool of soil organic N that, through slow mineralization, will form the long term trash decomposition (N-LTTD) fraction, which will be gradually available to the follow-ing crop cycle. In order to account for losses of the min-eralized N from the system (i.e., leaching or denitrifica-tion), we assumed 2 % losses of N-LTTD for every 6 year period (based in results obtained by Gava et al., 2003 and by Faroni et al., 2003).
To the amount of N-LTTD, we applied the same rate of recovery adopted for RN-PCR (13.0, 7.2, 5.2, 4.0, and 3.4 % after 1, 2, 3, 4, and 5 years) to obtain the RN-LTTD.
For all subsequent crop cycles, the same rates of recovery of residue-N were used (RN-PCR, RN-PHT, and RN-LTTD) as those during the first crop cycle. We mod-eled 15 consecutive crop cycles to simulate the processes occurring in a soil-sugarcane system over 90 years if 100 % of the crop residues produced were retained on the field.
We calculated RN-PCR, RN-PHT, and RN-LTTD for each year, harvest and crop cycle. Finally, calcula-tions were also performed for cases in which 100 %, 70 %, 50 %, 30 % or 10 % of the trash produced were re-tained on the field, considering the interest to remove trash from field for energy purposes.
Part 2: Cycling of nutrients from trash components
Two field trials were set up in Jaboticabal, São Paulo, Brazil, to account for the release of nutrients such as phosphorus, potassium, calcium, magnesium, sulfur and micronutrients from trash and its role in sugarcane nutrition:
•Site1:21o19'98'' S, 48o19'03'' W, 600 m altitude; Typic
Kandiudox soil (Soil Survey Staff, 2010) planted on Apr 2005 and successively harvested from July 2006 to July 2009.
• Site 2: 21º17'20'' S, 48°12'30'' W, 580 m altitude; Rhodic Eutrudox soil planted on Mar 2005 and succes-sively harvested from Aug 2006 to July 2009.
The sugarcane variety SP81-3250 was cultivated in both experimental fields. Further details regarding the ex-perimental areas can be found in Franco et al. (2010) and Fortes et al. (2013). The experiments were designed us-ing randomized blocks with four replicates. The original study involved the application of N doses at planting and at the ratoon cycles, and results are reported in Franco et al. (2010) and Fortes et al. (2013). This article emphasizes the release of nutrients from trash considering the inter-action between the sites and harvest years. We evaluated the phytomass of the tops and leaves in all harvests in both trials. The nutrient concentrations in these parts of the plants were also analyzed, which allowed us to infer the stocks of nutrients in the shoot component.
The measurements were performed in 2-m sec-tions of sugarcane rows in the middle of each plot. All of the cane present in these 2-m sections was collected, and the plants were separated into stalks (data not shown), dry leaves and tops. The number of plants in the sam-pled area was also recorded. After measuring the fresh phytomass (with a precision of ± 0.02 kg), the samples were crushed in a forage crusher, and a subsample of each component was packed in a plastic bag. The mois-ture content of the material was determined after drying at65ºCfor72h.
Tillering (tillers ha–1) was measured by counting
the number of tillers in three rows with a total combined length of 15 m in each plot. The dry phytomass of each part of the plant (kg ha–1) was obtained by multiplying
the number of tillers (tillers ha–1) by the mass of each
component (kg tiller–1).
The subsamples were grounded in a Wiley mill, and the N, P, K, Ca, Mg, S, Cu, Fe, Mn, Zn and B contents were determined as described by Malavolta et al. (1997). The nutrient stocks of the dry leaves and tops were de-termined with data of phytomass of each component (kg ha–1) and the concentration of nutrients (g kg–1).
Statistical analysis
An analysis of variance (ANOVA) was performed to determine the interactions between the sites, crop cycle and parts of the plant. When the F test showed significance (p < 0.05), the means were compared using the Tukey test (p < 0.05).
Figure 1 – Recovery of N from previous crop residues (PCR) and post harvest trash (PHT) by sugarcane over the years. The equations were used to calculate the recovery values adopted in the simulation. Original data of PHT from Table 1, using a correction factor of 1.82 and 1.2. PCR data from Fortes et al. (2013) using a correction factor of 1.2. See text for details.
(PCR) y = 12.994x–0.842
R² = 0.5543
(PHT) y = 11.385x–0.615
R² = 0.6099
0 4 8 12 16
0 1 2 3 4 5
Recovery of N (%)
Year
Results and Discussion
Recovery of N from crop residues
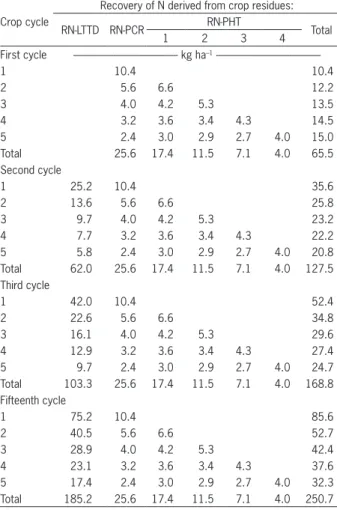
From the initial amount of N contained in previ-ous crop residues (N-PCR, 80 kg ha–1 N), which were
incorporated to the soil before the new cycle began, 25.6 kg ha–1 was recovered by sugarcane in a six year
period (Table 3). The accumulated N from trash left after harvest within the current cycle (RN-PHT per cycle) ac-counted for 40 kg ha–1 N, yielding 65.5 kg ha–1 N
recov-ered from sugarcane residues in the first cycle. In the second cycle, the RN-PCR and RN-PHT was assumed to be the same of those of the previous cycle, whereas RN-LTTD accounted for 62 kg ha–1 N, yielding a total of
127.5 kg ha–1 N. In the third and fifteenth cycle, the total
N recovered from residues was respectively 168.8 and 250.7 kg ha–1 N (Table 3).
N-LTTD is the main long-term pool of N available to microorganisms, which will serve as source of N to
the subsequent crop cycle (Table 3). Due to unavailable data in literature, we adopted the same recovery rate of PCR and LTTD. More studies are needed to evaluate the decomposition process of trash in the long term, as well as a sensitivity analysis indicating the impact of varying the values of important components of the model (yield, rate of trash production, N content on trash, etc) on the recovery of trash-N by sugarcane in the long term.
RN-PCR and RN-PHT did not vary between cycles (Table 3) because the model considers that sugarcane and thrash yields will be similar in each harvest of all cycles. This assumption may not always be true but was considered reasonable because the main factor affecting sugarcane yield in soils with standard management is probably the weather conditions. However, RN-LTTD increases with time (Table 3) because sugarcane plants only take up part of the N present in the residues pre-served and, therefore, some residue N accumulates in the soil.
The N-LTTD can also be referred to as trash-N re-sidual in soil, since it represents an N pool slowly avail-able to sugarcane. N-LTTD increases from the beginning up to 40 years after implementing the green harvesting system, reaching an equilibrium around 580 kg ha–1
cycle–1 (Figure 2). This pool of N recycling in the soil
system is also important for C sequestration in the soil organic matter. The total residue-N recovered by sugar-cane includes RN-PCR, RN-PHT and RN-LTTD. Total N recovered also increases from time zero up to 40 years, reaching equilibrium at around 250 kg ha–1 cycle–1. After
17 years, 170 kg ha–1 N cycle–1 will be available for the
sugarcane plants to take up (70 % of maximum N recov-ered), and after 35 years the corresponding figure will reach 225 kg ha–1 N cycle–1 (Figure 2).
Vallis et al. (1996) used the Century model to simu-late the effect of trash retention on the net mineraliza-tion of N for Australian sugarcane field for 90 years. For sugarcane field fertilized with 100 kg ha–1 of N and
man-aged with burning, the net mineralization remained
con-Table 3 – Estimated recovery by sugarcane plants over several crop cycles of N derived from long term trash decomposition (RN-LTTD), previous crop residues (RN-PCR), and post harvest trash (RN-PHT) continuously preserved on the soil surface. A 100 % of trash maintenance on the soil was assumed. Only the first three cycles and the 15th cycle are presented for succinctness; the 15th cycle
was chosen because it closes the 90-year period simulated.
Crop cycle
Recovery of N derived from crop residues:
RN-LTTD RN-PCR RN-PHT Total
1 2 3 4
First cycle --- kg ha–1
---1 10.4 10.4
2 5.6 6.6 12.2
3 4.0 4.2 5.3 13.5
4 3.2 3.6 3.4 4.3 14.5
5 2.4 3.0 2.9 2.7 4.0 15.0
Total 25.6 17.4 11.5 7.1 4.0 65.5
Second cycle
1 25.2 10.4 35.6
2 13.6 5.6 6.6 25.8
3 9.7 4.0 4.2 5.3 23.2
4 7.7 3.2 3.6 3.4 4.3 22.2
5 5.8 2.4 3.0 2.9 2.7 4.0 20.8
Total 62.0 25.6 17.4 11.5 7.1 4.0 127.5
Third cycle
1 42.0 10.4 52.4
2 22.6 5.6 6.6 34.8
3 16.1 4.0 4.2 5.3 29.6
4 12.9 3.2 3.6 3.4 4.3 27.4
5 9.7 2.4 3.0 2.9 2.7 4.0 24.7
Total 103.3 25.6 17.4 11.5 7.1 4.0 168.8
Fifteenth cycle
1 75.2 10.4 85.6
2 40.5 5.6 6.6 52.7
3 28.9 4.0 4.2 5.3 42.4
4 23.1 3.2 3.6 3.4 4.3 37.6
5 17.4 2.4 3.0 2.9 2.7 4.0 32.3
Total 185.2 25.6 17.4 11.5 7.1 4.0 250.7
Figure 2 – Residual trash-N in soil and trash-N recovered by sugarcane over a 90 years-period. Figures of residual soil N for individual cycles include trash N freshly added and N from trash of previous years.
0 200 400 600 800
0 10 20 30 40 50 60 70 80 90
Trash
-N (kg ha
–
1 cycle
–
1)
Year
Residual in soil Recovered by sugarcane
17 yr (70 %) = 170 kg ha–1 cycle–1
stant on the order of 70 kg ha–1 year–1 of N. In contrast,
for field managed without burning and trash retention, the net mineralization reached 200 kg ha–1 year–1 – a net
difference of 130 kg ha–1 year–1 favorable to trash
reten-tion. Despite the use of different methods, our study also indicates a release of N from crop residues after imple-menting the green harvesting system.
The long term impact of removing trash from sug-arcane fields is shown in Figure 3. The Figure was pre-pared considering the total residue-N recovered in the whole crop cycle (Table 3) divided by the period of each crop cycle (6 years), yielding results in a kg ha–1 year–1
basis. Results provided by Figure 3 shows the potential reduction in N fertilizer requirements over the year.
Thirty years after implementing the green harvest-ing system, there is a potential reduction in N fertiliza-tion of 36, 28, 23, 19, and 14 kg ha–1 year–1, respectively,
for 100, 70, 50, 30, and 10 % of trash retention (Figure 3). After 45 years, the potential reduction increases to 40, 32, 26, 21, and 15 kg ha–1 year–1 to the same retention
levels. The impact of removing trash from sugarcane fields has, therefore, a financial cost, since increasing trash removal from fields indicates the need to increase inputs of N fertilizer in order to maintain yield and sus-tainability.
Robertson and Thorburn (2007a), under Australian conditions, determined that N mineralization of soils with trash retention gradually increases until equilib-rium at 40 kg ha–1 year–1 of N; furthermore, 90 %
equi-librium would be reached after 30 years. These results are similar to our findings. In our study, independently of the rate of trash removal from fields, equilibrium in terms of residue-N recovery will be reached beyond 40 years.
There is no expectation of a sizeable reduction of fertilizer-N inputs in the short term in areas in which
the crop management shifted recently from the burned to the green harvesting system (Figure 3). In fact, imobi-lization of N from fertilizer is expected in the first years after adopting the green cane system due to the high amount of trash left on the soil, presenting a high C/N ratio (Meier et al., 2006). The time in wich rates of N fertilizer can start to be reduced will depend of several factor, including soil type, management history and cli-matic conditions, which impacts microbial transforma-tions; therefore broader recommendations are not pos-sible at this point.
The immobilization will continue until soil organic matter reaches a new equilibrium. Before that soil N be-ing supplied to crops will gradually increase from neg-ligible amounts soon after adoption of green cane man-agement up to approximately 40 kg ha–1 N per year when
the system equilibrates. Another complication is that the impact of trash retention on soil organic matter is specif-ic for soil and climate (Thorburn et al., 2012). So, the size and extent of the immobilization phase at one site may be different from another. The main impact will occur in the long term. Accordingly to Dourado-Neto et al. (2010), although residue-N was not an important source of N to the crop in the first growing season, its contribution to soil organic matter maintenance was about twice that of fertilizer N. Therefore, the long-term effect of crop resi-dues on providing mineral N to the crop may be greater than that of N-fertilizer (Dourado-Neto et al., 2010), in-dicating the importance of maintaining sugarcane trash over the soil under green harvesting systems.
The result of the present study may not be gener-alized to all sugarcane fields because the modeling was done with limited boundary conditions. We took fixed values for N content in plant parts, trash:cane ratio, N recovery from trash, yields and losses of mineralized N. Although the figures used are representative of large sugarcane areas in Southeast Brazil, variations are likely to be found under different soils and climates. For ex-ample, overestimation of recoverable N may occur in wetter climates, in which higher rates of losses of min-eralized trash-N are expected (decreasing the recovery of trash-N); in colder areas the recovery rate of trash-N may be lower than the used in this study. Despite these limitations, this model allows the forecast of changes that occur in the soil with an important nutrient as dif-ferent options of trash management are considered.
The cycling of nutrients from crop residues
During all crop cycles, dry leaves accounted for most dry phytomass production in the soil-plant system (Table 4). Over four years, on average, the phytomass input was 8.7 t ha–1 year–1 for dry leaves and 4.0 t ha–1
year–1 for tops, totaling 12.7 t ha–1 year–1. The high input
of post-harvest residues generated by green harvesting systems in sugarcane indicates the potential to increase soil organic carbon (SOC) stocks over the years, as indi-cated by Galdos et al. (2009) under Brazilian field condi-tions. Removing trash from sugarcane fields for the
pur-Figure 3 – Recovery of N from residues (LTTD + PCR + RN-PHT) over the years considering retention of 100, 70, 50, 30, and 10 % of trash. The numbers above the curves represent the amounts of N fertilizer that can be reduced after 30 and 50 years of trash preservation.
36 40
28 32
23 26
19 21
14 15
0 10 20 30 40 50
0 20 40 60 80 100
Recovery of N from residues
(kg ha
–
1 year
–
1)
Years Trash retention
pose of energy generation may, however, compromise the potential of sugarcane to increase SOC stocks. In this sense, Lou et al. (2011) reported a reduction in C seques-tration in soil when corn residues were removed.
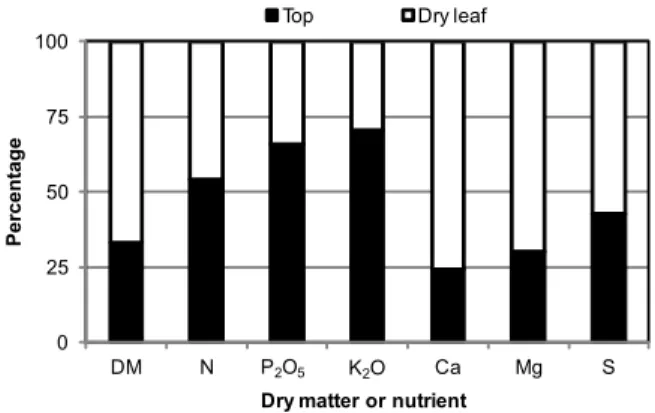
The removal of a portion of the residues for the purpose of energy generation is economically attractive in short-term. However, residue removal can compro-mise long-term nutrient cycling provided by crop resi-dues to the soil-sugarcane system. To circumvent this problem, one option would be to remove the residue that has the lowest accumulation of nutrients. In this respect, the tops are the component that accumulates the greatest amounts of N, P2O5 and K2O (Table 4). These nutrients are applied annually after the harvest in sug-arcane fields (with the exception of P2O5, which is often applied only at planting) (van Raij et al., 1997), justifying the maintenance of tops in the field.
Over four years, the average amount of N and K2O accumulated in crop residues is approximately 57 kg ha–1
and 120 kg ha–1, respectively. Of this, approximately 31
kg ha–1 of N and 85 kg ha–1 of K
2O are accumulated in the
tops, which represents a relatively sizeable proportion of the annual rates typically applied in ratoon areas – from 60 to 120 kg N ha–1 and from 90 to 150 kg K
2O ha –1 (van
Raij et al., 1997). However, as pointed out previously, only between 3 to 15 % of N contained in sugarcane trash is recovered by the sugarcane crop during the next cycle (Gava et al., 2003; Robertson and Thorburn, 2007a; Fortes et al., 2013). In contrast, K – because it is not a structural component of the plant cell wall and does not form organic compounds in the plant (Epstein and Bloom, 2006) – is readily released from plant tissue and
can return to the soil and contribute to sugarcane nutri-tion in a very short-term. Oliveira et al. (1999) showed that the K content in sugarcane trash decreased by ap-proximately 85 % in one agricultural year (from 85 to 10 kg ha–1 of K). The authors also observed high rates of
release of Ca (56 %) and Mg (62 %) but not of N, P2O5 and S, which are nutrients that are mostly components of organic compounds of plants.
In a long-term study of sugarcane crops, Fortes et al. (2012) observed the release of 92 % of K, 70 % of Mg, 65 % of S, 54 % of Ca, 31 % of N and 23 % of P contained in post-harvest residues (trash) after three years on the field. Considering that dry leaves have the greatest phy-tomass and contribute little to the nutrient supply of the soil (due to the low concentration of nutrients in this material – Table 4), this material may be a most suitable feedstock for energy purposes. Hassuani et al. (2005) re-ported that the heating value of dry leaves is slightly higher than that of tops and has less moisture. In addi-tion, the high N, K, and Cl concentration in the tops may be a disadvantage for burning in boilers because of the release of polluting gases during combustion and greater ash residues (Hassuani et al., 2005).
Separating tops from dry leaves and keeping the tops on the field may also improve combustion and pre-serve the furnaces in case plant material is used to pro-duce heat and electricity. Tops have a lower quality, as compared to the dry leaves, as feedstock for combustion in furnaces. The tops of sugarcane plants are high in K, chlorine, and other inorganic nutrients. High alkali con-tent in the fuel causes the formation of partially fused deposits (slagging) on the furnaces and on convection
Table 4 – Amount of nutrients accumulated in sugarcane plant components that can be returned to the soil following mechanized harvesting over four consecutive years (cane planting and three successive ratoons). Data averaged from two field trials with the sugarcane variety SP81-3250.
Plant Dry Matter Mass
Nutrients1
components N P2O5 K2O Ca Mg S B Cu Fe Mn Zn
t ha–1 --- kg ha–1 --- --- mg ha–1
---Cane plant
Dry leaves 9.9 a 25.9 a 4.5 b 60.8 b 36.6 a 12.0 a 7.3 a 39.6 a 13.2 a 5257.4a 1302.0 a 73.0 a
Tops 3.9 b 27.5 a 7.9 a 77.1 a 8.5 b 4.0 b 3.3 b 6.6 b 11.3 a 1958.1b 324.2 b 81.8 a
Total 13.8 53.5 12.4 137.9 45.1 16.0 10.7 46.2 24.5 7215.5 1626.2 154.8
first ratoon
Dry leaves 8.1 a 27.1 b 4.9 b 35.5 b 29.7 a 9.9 a 6.2 a 61.6 a 15.2 a 3230.5a 991.9 a 85.6 b
Tops 4.7 b 37.6 a 11.1 a 98.8 a 10.5 b 5.3 b 5.5 b 21.9 b 16.1 a 1091.4b 360.8 b 126.4 a
Total 12.8 64.7 16.0 134.3 40.1 15.2 11.7 83.6 31.2 4321.9 1352.7 212.0
second ratoon
Dry leaves 7.3 a 20.7 a 5.4 b 35.9 b 28.1 a 9.3 a 5.3 a 37.6 a 13.4 a 4102.0a 926.3 a 81.3 a
Tops 3.2 b 20.6 a 7.9 a 80.0 a 7.8 b 3.6 b 3.4 b 17.3 b 9.0 b 957.1b 239.6 b 66.2 a
Total 10.6 41.4 13.3 116.0 35.9 12.9 8.7 54.9 22.4 5059.1 1165.9 147.6
third ratoon
Dry leaves 8.5 a 31.0 b 2.1 b 23.4 b 38.2 a 11.3 a 5.5 a 42.2 a 15.4 a 6136.8a 1150.1 a 70.0 a
Tops 4.3 b 36.3 a 4.9 a 80.8 a 14.1 b 4.8 b 4.7 b 16.5 b 11.8 b 1244.6b 226.0 b 81.4 a
Total 14.2 67.3 7.0 104.2 52.3 16.0 10.2 58.8 27.1 7381.4 1376.2 151.4
heat surfaces (fouling) during dry combustion, which is detrimental to the whole process (Jenkins et al., 1998; Hassuani et al., 2005; Suramaythangkoor and Li, 2012). High chlorine content in the burning material can also cause fouling and corrosion (Jenkins et al., 1998; Sura-maythangkoor and Li, 2012).
The advantage of removing the dry leaves and leav-ing the tops on the field become more evident when the data of Figure 4 is examined. Dry leaves represent the greater quantity of phytomass of these two parts of the plant (approximately 70 %) and can be easily removed from fields by means of turning off the extractor fan sys-tem of the harvester. This finding of our study indicates the advantages of removing specific parts of the trash from the field rather than the whole trash. Choosing the appropriate part of the plant for removal may have a more positive impact on maintaining soil fertility and adding C to the soil-plant system than simply removing a fixed amount of trash from sugarcane fields.
The tops have a greater percentage of nutrients (approximately 50 % of the N, 60 % of the P2O5 and 75 % of the K2O) and can be maintained on the field by using the shredder topper of the harvester. These three nutrients are the most expensive to be applied in sug-arcane fields. Ca and S, as well as most micronutrients, are not particularly mobile within the plant (Epstein and Bloom, 2006) and tend to concentrate in old tissues (e.g., dry leaves) with little translocation to new tissues (tops). Although Mg is generally thought to be mobile in the phloem (Epstein and Bloom, 2006), we observed a greater accumulation of this nutrient in the dry leaf. Although removing dry leaves from the field may de-plete soil reserves of Ca, Mg and S, these nutrients can be easily replenished in the soil through inexpensive practices such as liming and gypsum application. There-fore, when sugarcane growers collect trash from an area without separating the dry leaves and tops, consider-able amounts of N, P2O5 and K2O will be removed from the field. To keep the long-term sustainability, there is a need to replace these nutrients in the soil, and thus, this replacement cost should be considered when analyzing
Figure 4 – Distribution of dry matter phytomass and nutrients in sugarcane components (top or dry leaves).
the economic feasibility of trash removal for the purpose of energy production.
Conclusions
Maintaining crop residues over the soil will in-crease the long term recovery of residue derived N by sugarcane, reaching equilibrium after 40 years with a supply of 40 kg ha–1 year–1 of N. Removing trash for
en-ergy production will decrease the potential reduction in N fertilizer requirement promoted by crop residues.
Dry leaves present the higher biomass and the lower nutrient content compared to sugarcane tops, and should be the choice part if trash is to be collected from fields for energy purposes. Around 75 % of the K2O and 50 % of the N is accumulated in the tops, indicating the importance of maintaining tops in the soil to sustain soil fertility in the long term and decrease expenses with synthetic fertilizers.
Acknowledgements
Authors thank “Fundação de Amparo à Pesquisa do Estado de São Paulo” for financial support (Processo FAPESP 2002/10534-8) and scholarship to the third au-thor (Processo FAPESP 2011/22660-7), and “Conselho Nacional de Desenvolvimento Científico e Tecnológico” – CNPq for financial support; “Centro de Tecnologia Ca-navieira” - CTC, São Martinho and Santa Adélia sugar-cane mills for the sites and field work support.
References
Basanta, M.V.; Dourado Neto, D.; Reichardt, K.; Bacchi, O.O.S.; Oliviera, J.C.M.; Trivelin, P.C.O.; Timm, L.C.; Tominaga, T.T.; Correchel, T.; Cássaro, F.A.M; Pires, L.F.; Macedo, J.R. 2003. Management effects on nitrogen recovery in a sugarcane crop grown in Brazil. Geoderma 116: 235-248.
Dourado-Neto, D.; Powlson, D.; Bakar, R.Abu; Bacchi, O.O.S.; Basanta, M.V.; Cong, P.Thi; Keerthisinghe, S.; Ismaili, M.; Rahman, S.M.; Reichardt, K.; Safwat, M.S.A.; Sangakkara, R.; Timm, L.C.; Wang, J.Y.; Zagal, E.; van Kessel, C. 2010. Multiseason recoveries of organic and inorganic nitrogen-15 in tropical cropping systems. Soil Science Society of America Journal 74: 139-152.
Epstein, E.; Bloom, A.J. 2006. Mineral Nutrition of Plants: Principles and Perspectives = Nutrição Mineral de Plantas: Princípios e Perspectivas. 2ed. Ed. Planta, Londrina, PR, Brazil (in Portuguese).
Faroni, C.E.; Vitti, A.C.; Gava, G.J.C.; Manzoni, C.S.; Penatti,
C.P.; Trivelin, P.C.O. 2003. Sugarcane trash degradation (15N)
in two consecutive years = Degradação da palha (15N) de
cana-de-açúcar em dois anos consecutivos. Soil Science Brazilian Conference = Congresso Brasileiro de Ciência do Solo. Proceedings. Ribeirão Preto, SP, Brazil.
Fortes, C.; Trivelin, P.C.O.; Vitti, A.C. 2012. Long-term decomposition of sugarcane harvest residues in Sao Paulo State, Brazil. Biomass & Bioenergy 42: 189-198.
0 25 50 75 100
DM N P2O5 K2O Ca Mg S
Percentage
Dry matter or nutrient
Top Dry leaf
Fortes, C.; Vitti, A.C.; Otto, R.; Ferreira, D.A.; Franco, H.C.J.; Trivelin, P.C.O. 2013. Contribution of nitrogen from sugarcane harvest residues and urea for crop nutrition. Scientia Agricola 70: 305-312.
Franco, H.C.J.; Trivelin, P.C.O.; Faroni, C.E.; Vitti, A.C.; Otto, R. 2010. Stalk yield and technological attributes of planted cane as related to nitrogen fertilization. Scientia Agricola 67: 579-590. Franco, H.C.J.; Vitti, A.C.; Faroni, C.E.; Cantarella, H.; Trivelin,
P.C.O. 2007. Stock of nutrients in crop residues incorporated to
the soil during renovation of sugarcane areas.STAB - Açúcar,
Álcool e Subprodutos 25: 32-36 (in Portuguese, with abstract in English).
Galdos, M.V.; Cerri. C.C.; Cerri, C.E.P. 2009. Soil carbon stocks under burned and unburned sugarcane in Brazil. Geoderma 153: 347-352.
Gava, G.J.C.; Trivelin, P.C.O.; Vitti, A.C.; Oliveira, M.W. 2003.
Recovery of nitrogen (15N) from urea and cane trash by sugar
cane ratoon (Saccharum spp.). Revista Brasileira de Ciência do
Solo27: 621-630 (in Portuguese, with abstract in English).
Hassuani, S.J.; Leal, M.R.L.V.; Macedo, I.C. 2005. Biomass power generation: sugar cane bagasse and trash. CTC/PNUD, Piracicaba, SP, Brazil. 270p.
Jenkins, B.M.; Baxter, L.L.; Miles Junior, T.R.; Miles, T.R. 1998. Combustion properties of biomass. Fuel Processing Technology 54:17-46.
Lou, Y.; Xu, M.; Wang, W.; Sun, X.; Zhao, K. 2011. Return rate of straw residue affects soil organic C sequestration by chemical fertilization. Soil Tillage Research 113: 70-73.
Malavolta, E.; Vitti, G.C.; Oliveira, S.A. 1997. Evaluation of Nutritional Status of Plants: Principles and Perspectives = Avaliação do Estado Nutricional das Plantas: Princípios e Aplicações. 2ed. Potafos, Piracicaba, SP, Brazil. 319 p. (in Portuguese).
Meier, E.A.; Thorburn, P.J.; Wegener, M.K.; Basford, K.E. 2006. The availability of nitrogen from sugarcane trash on contrasting soils in the wet tropics of North Queensland. Nutrient Cycling in Agroecosystems 75: 101-114.
Ng Kee Kwong, K.E.; Deville, J.; Cavalot, P.C.; Riviere, V. 1987. Value of cane trash in nitrogen nutrition of sugarcane. Plant and Soil 102: 79-83
Oliveira, M.W.; Trivelin, P.C.O.; Penatti, C.P.; Piccolo, M.C. 1999. Field decomposition and release of sugar cane trash nutrients. Pesquisa Agropecuária Brasileira 34: 2359-2362 (in Portuguese, with abstract in English).
Robertson, F.A.; Thorburn, P.J. 2007a. Management of sugarcane harvest residues: consequences for soil carbon and nitrogen. Australian Journal of Soil Research 45: 13-23.
Robertson, F.A.; Thorburn, P.J. 2007b. Decomposition of sugarcane harvest residue in different climatic zones. Australian Journal of Soil Research 45: 1-11.
Suramaythangkoor, T.; Li, Z. 2012. Energy policy tools for agricultural residues utilization for heat and power generation: a case study of sugarcane trash in Thailand. Renewable and Sustainable Energy Reviews 16:4343-4351.
Soil Survey Staff. 2010. Keys to Soil Taxonomy. 11ed. USDA-Natural Resources Conservation Service, Washington, DC, USA.
Thorburn, P.J.; Meier, E.A.; Collins, K.; Robertson, F.A. 2012. Changes in soil carbon sequestration, fractionation and soil fertility in response to sugarcane residue retention are site-specific. Soil & Tillage Research 120: 99-111.
Thorburn, P.J.; Meier, E.A.; Probert, M.E. 2005. Modeling nitrogen dynamics sugarcane system: recent advances and applications. Field Crops Research 92: 337-351.
Trivelin, P.C.O.; Victoria, R.L.; Rodrigues, J.C.S. 1995. Utilization
by late harvest sugar cane ratoon of nitrogen from 15
N-Aquammonia and 15N-Urea applied to the soil as vinasse
N-Complement. Pesquisa Agropecuária Brasileira 30: 1375-1385 (in Portuguese, with abstract in English).
Trivelin, P.C.O.; Vitti, A.C.; Oliveira, M.W.; Gava, G.J.C.; Sarriés, A. 2002. Nitrogen utilization and sugarcane (plant cane) yield on a sandy soil with incorporated crop residues. Revista Brasileira de Ciência do Solo 26: 636-646 (in Portuguese, with abstract in English).
Vallis, I.; Parton, W.J.; Keating, B.A.; Wood, A.W. 1996. Simulation of the effects of trash and N fertilizer management on soil organic matter levels and yields of sugarcane. Soil & Tillage Research 38: 115-132.
Van Raij, B.; Cantarella, H.; Quaggio, J.A.; Furlani, A.M.C. 1997. Fertilization and Liming Recommendation for the State of São Paulo = Recomendações de Adubação e Calagem para o Estado de São Paulo. 2ed. Instituto Agronômico, Campinas, SP, Brazil (in Portuguese).
Vitti, A.C.; Ferreira, D.A.; Franco, H.C.J.; Fortes, C.; Otto, R.; Faroni, C.E.; Trivelin, P.C.O. 2010. Utilisation of nitrogen from trash by sugarcane ratoons. Sugar Cane International 28: 249-253.
Vitti, A.C.; Franco, H.C.J.; Trivelin, P.C.O.; Ferreira, D.A.; Otto, R.; Fortes, C.; Faroni, C.E. 2011. Nitrogen derived from
fertilization and straw for plant cane nutrition. Pesquisa