Length-weight relationships of the ichthyofauna associated with the Brazilian sardine,
Sardinella brasiliensis
, on the Southeastern Brazilian Bight (22°S-29°S)
between 2008 and 2010
André Martins Vaz-dos-Santos1,3,4 & Carmen Lúcia Del Bianco Rossi-Wongtschowski2
1Laboratório de Esclerocronologia, Universidade Federal do Paraná – UFPR,
Rua Pioneiro, 2153, CEP 85950-000, Palotina, PR, Brasil
2Instituto Oceanográfico – IO, Universidade de São Paulo – USP, Praça do Oceanográfico, 191,
sala 103A, CEP 05508-120, São Paulo, SP, Brasil
3Programa de Pós-graduação do Instituto de Pesca – PPGIP, São Paulo, SP, Brasil 4Corresponding author: André Martins Vaz-dos-Santos, e-mail: [email protected]
VAZ-DOS-SANTOS, A.M. & ROSSI-WONGTSCHOWSKI, C.L.D.B. Length-weight relationships of the ichthyofauna associated with the Brazilian sardine, Sardinella brasiliensis, on the Southeastern Brazilian Bight (22°S-29°S) between 2008 and 2010. Biota Neotrop. 13(2): http://www.biotaneotropica.org.br/v13n2/en/ abstract?short-communication+bn01613022013
Abstract: In this study, estimates of length-weight relationships are presented for twenty-four species caught in association with the Brazilian sardine, Sardinella brasiliensis, during four acoustics surveys carried out under the Program ECOSAR (Prospecting and evaluation of biomass of the stock of Brazilian sardine on the southeast coast by acoustic methods), which was to evaluate the biomass of species that were caught. The model parameters
were estimated with the nonlinear iterative method of least squares. The value of the coefficient of determination
(r2) and residual analysis were employed to verify the appropriateness of fit. The coefficient b values were tested with respect to isometry (b=3) using a ta1,0.05 test. The values of coefficient b ranged from 2.377 to 3.538. There is a tendency for positive allometry (b) in the sampled ichythyocenose.
Keywords: relative growth, allometric model, pelagic and demersal fishes.
VAZ-DOS-SANTOS, A.M. & ROSSI-WONGTSCHOWSKI, C.L.D.B. Relações comprimento-peso da ictiofauna associada à sardinha-verdadeira, Sardinella brasiliensis, na Bacia do Sudeste do Brasil (22ºS-29ºS) entre 2008 e 2010. Biota Neotrop. 13(2): http://www.biotaneotropica.org.br/v13n2/pt/abstract?short-communication+bn01613022013
Resumo: No presente estudo são apresentadas as estimativas das relações comprimento-peso para vinte e quatro espécies capturadas em associação com a sardinha-verdadeira (Sardinella brasiliensis) durante quatro cruzeiros de prospecção hidroacústica realizados no âmbito do Programa ECOSAR (Prospecção e avaliação de biomassa do estoque de sardinha-verdadeira, na costa sudeste, por métodos hidroacústicos), cujo objetivo foi permitir a avaliação das biomassas das espécies capturadas. Para estimação dos parâmetros dos modelos foi empregado
o método iterativo não linear de mínimos quadrados; o valor do coeficiente de determinação (r2) e a análise de
resíduos foram empregados para verificar a adequação dos ajustes. Os valores dos coeficientes b foram testados
em relação à isometria (b=3) através de teste ta1, 0,05. O valor do coeficiente b variou entre 2,377 e 3,538, tendo
http://www.biotaneotropica.org.br/v13n2/en/abstract?short-communication+bn01613022013 http://www.biotaneotropica.org.br
Results and Discussion
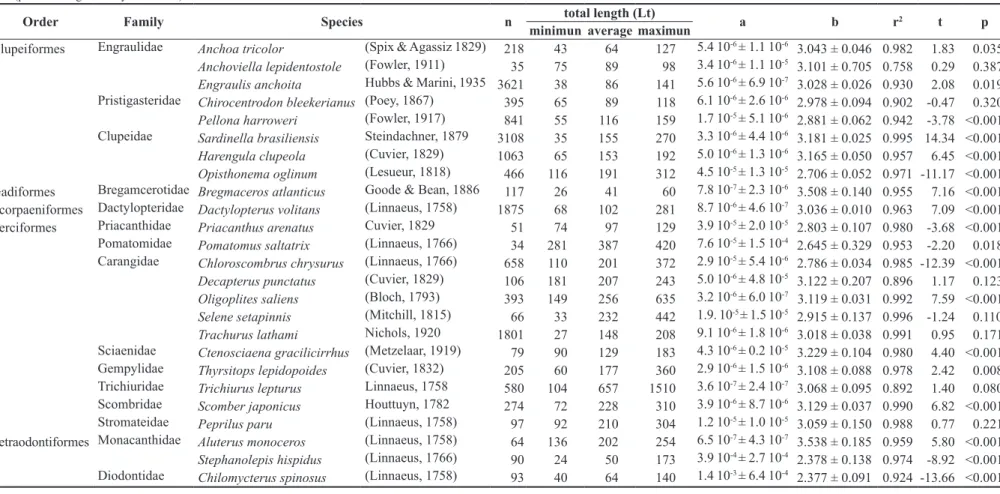
The data from 13,222 fish comprising five orders, fifteen families and twenty-five species were analyzed. Table 1 shows the species analyzed, the ranges and means of their length, the number of fishes, the parameters of the length-weight relationships, the coefficients of determination and the results of the allometric t tests. The fitted
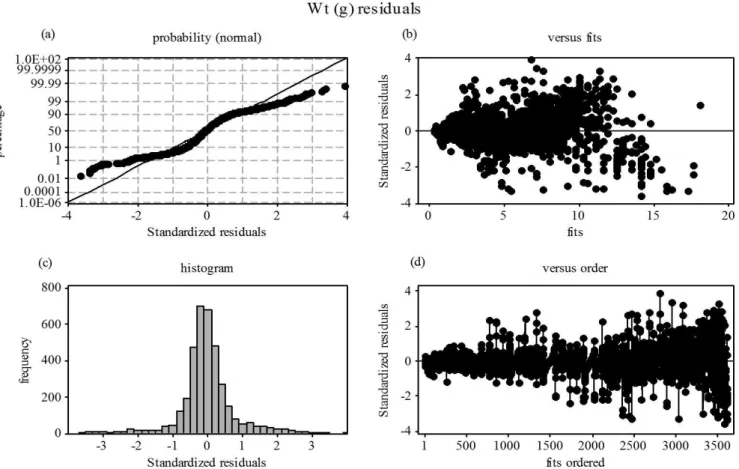
models were biologically and statistically adequate to describe the length-weight relationship for all species. A model of residual analysis is presented in Figure 2 and all assumptions (normality, randomness, homoscedasticity and independence) showed no tendency for all species. Random residuals have showed that models were adequate (Bervian et al. 2006).
The minimum and maximum values of b for the length-weight
relationships were, respectively, 2.377 and 3.538, and its frequency
distribution is presented in Figure 3.
It is noteworthy that b provided the best estimates for those typical
small pelagic fish which were caught by the mid-water trawl and seine,
such as the Clupeiformes, Trachurus lathami and Chloroscombrus chrysurus. Most of the values for the young demersal fish fell near the modeled relationships, such as Dactylopterus volitans, while for other species, such as Decapterus punctatus, Anchoviella lepidentostole and Pomatomus saltatrix, only a small representative range of lengths were captured.
For some species, such as A. lepidentostole, Pellona harroweri, S. brasiliensis, Harengula clupeola, Priacanthus arenatus, C. chrysurus, Selene setapinnis, Scomber japonicus, and Chilomycterus spinosus, the values for the coefficient b were the same as those obtained in other studies, although for other species such as Engraulis anchoita, Chirocentrodon bleekerianus, Opisthonema oglinum, Bregmaceros atlanticus, D. volitans, P. saltatrix, T. lathami, Ctenosciaena gracilicirrhus, Thyrsitops lepidopoides, Trichiurus lepturus, Peprilus paru, Aluterus monoceros, and Stephanolepis hispidus, remarkable differences from the published values were observed. Probably these differences should be caused since different
surveys were performed with diverse fishing gears at different
times (Magro et al. 2000, Bernardes & Rossi-Wongtschowski 2000,
Muto et al. 2000, Vianna et al. 2004, Cergole et al. 2005, Madureira & Rossi-Wongtschowski 2005).
Introduction
The diversity of marine fish in the Southeastern and Southern
Brazilian regions has traditionally been investigated through research
surveys (Vazzoler & Iwai 1971, Vazzoler 1973, Yesaki et al. 1976,
Rossi-Wongtschowski & Paes 1993, Rossi-Wongtschowski et al.
1995, 2008, Brasil 2006). From these records, several studies were developed concerning various aspects of the fish species. Among
the studied variables, the length-weight relationship is a
density-dependent parameter that provides an index of health of fish stocks
(Schneider et al. 2000).
Because the prior studies related to relative growth, summarized in Huxley (1993), and focused on the growth pattern model (whether
isometric or allometric) until its application in fish stock assessment (Beverton & Holt 1993, Sparre & Venema 1998, Quinn II & Deriso
1999), the length-weight relationship has been used in many studies. It
is possible to mentioning fish shape and swimming patterns, biomass quantifications based on length frequency distributions, as a measure
of changes in the expected individual weight for length and indicating its condition (i.e., fat accumulation and gonad development), differentiation of stocks, growth conditions, reproduction and feeding, ecological modeling, biomass calculation in acoustic surveys, and monitoring the “health” of the stocks over time.
In Brazil, several studies have estimated the parameters of the
relationship between length and weight among marine fishes as
Bernardes & Rossi-Wongtschowski (2000), Haimovici & Velasco (2000), Muto et al. (2000), Lessa et al. (2004), Frota et al. (2004),
Vianna et al. (2004), Madureira & Rossi-Wongtschowski (2005), Giarizzo et al. (2006), Macieira & Joyeux (2008), Freire et al. (2009),
Joyeux et al. (2009) and Oliveira Freitas et al. (2011).
In this study, estimates of the length-weight relationship are presented for twenty-four species that were captured in association with the Brazilian sardine, Sardinella brasiliensis (Steindachner,
1879), during four acoustic surveys conducted under the Program
ECOSAR (Prospection and evaluation of the Brazilian sardine biomass on the southeast coast through acoustic methods).
Material and Methods
The data for the present study were collected on four research cruises conducted with RV Atlântico Sul (FURG) during
January-February 2008 (ECOSAR IV), November 2008 (ECOSAR V),
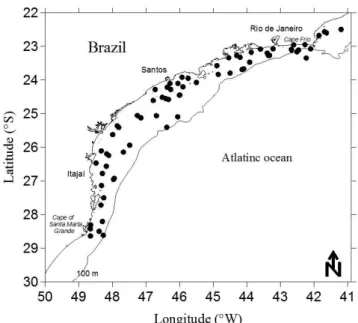
September-October 2009 (ECOSAR VI) and February-March 2010 (ECOSAR VII) (Figure 1). The objective of the ECOSAR program was to assess the biomass of the species that were caught. Fish were caught using purse seine and mid-water-trawls in the Southeastern Brazilian Bight (22 °S-29 °S) at depths between 10 and 100 m. The
species of the fish were identified and their nomenclature confirmed
(Eschmeyer 2012). Their total length (Lt) was measured in mm (from
the tip of the snout to the end of the caudal fin) as was their weight
(Wt) in grams.
The data were only analyzed for those species for which more than thirty individuals were captured on the four cruises, to allow for statistical inferences. The variation in the total length of each species
was subjected to descriptive analysis (Triola 2005). The length and
weight data were reviewed in scatter diagrams to identify outliers
and possible measurement errors. The relationships were fitted to the
equation Wt = a Ltb (Le Cren 1951), which was calculated with the help of Minitab®. The estimates of the parameters were obtained with
the nonlinear iterative method of least squares, and the coefficient of
determination (r2) and the residual analysis were employed to verify
the adequacy of fit, according to Vieira (2006). To determine whether
the growth was isometric (b = 3) or allometric for each species, the b
coefficients were tested by a ta1,0.05 test, considering Ha: b < 3 or b > 3
according to the value estimated (Triola 2005).
Figure 1. Fishing hauls during the surveys of the ECOSAR Program
V
az-dos-Santos,
A.M. & Rossi-W
ongtschowski, C.L.D.B.
g.br http://www
.biotaneotropica.or
g.br/v13n2/en/abstract?short-communication+bn01613022013
Biota Neotr
op.,
Table 1. Values of the minimum, average and maximum total length (Lt, mm); a, b (± confidence interval) and determination (r2) coefficients of the length-weight relationship; and the “t” and “p” values of isometric
t-test (p < 0.05 - significantly allometric).
Order Family Species n total length (Lt) a b r2 t p
minimun average maximun
Clupeiformes Engraulidae Anchoa tricolor (Spix & Agassiz 1829) 218 43 64 127 5.4 10-6 ± 1.1 10-6
3.043 ± 0.046 0.982 1.83 0.035
Anchoviella lepidentostole (Fowler, 1911) 35 75 89 98 3.4 10-6 ± 1.1 10-5 3.101 ± 0.705 0.758
0.29 0.387
Engraulis anchoita Hubbs & Marini, 1935 3621 38 86 141 5.6 10-6 ± 6.9 10-7 3.028 ± 0.026 0.930 2.08 0.019
Pristigasteridae Chirocentrodon bleekerianus (Poey, 1867) 395 65 89 118 6.1 10-6 ± 2.6 10-6
2.978 ± 0.094 0.902 -0.47 0.320
Pellona harroweri (Fowler, 1917) 841 55 116 159 1.7 10-5 ± 5.1 10-6 2.881 ± 0.062 0.942 -3.78 <0.001
Clupeidae Sardinella brasiliensis Steindachner, 1879 3108 35 155 270 3.3 10-6 ± 4.4 10-6 3.181 ± 0.025 0.995
14.34 <0.001
Harengula clupeola (Cuvier, 1829) 1063 65 153 192 5.0 10-6 ± 1.3 10-6 3.165 ± 0.050 0.957 6.45 <0.001
Opisthonema oglinum (Lesueur, 1818) 466 116 191 312 4.5 10-5 ± 1.3 10-5 2.706 ± 0.052 0.971 -11.17 <0.001
Gadiformes Bregamcerotidae Bregmaceros atlanticus Goode & Bean, 1886 117 26 41 60 7.8 10-7 ± 2.3 10-6 3.508 ± 0.140 0.955 7.16
<0.001
Scorpaeniformes Dactylopteridae Dactylopterus volitans (Linnaeus, 1758) 1875 68 102 281 8.7 10-6 ± 4.6 10-7 3.036 ± 0.010 0.963 7.09 <0.001
Perciformes Priacanthidae Priacanthus arenatus Cuvier, 1829 51 74 97 129 3.9 10-5 ± 2.0 10-5 2.803 ± 0.107 0.980 -3.68 <0.001
Pomatomidae Pomatomus saltatrix (Linnaeus, 1766) 34 281 387 420 7.6 10-5 ± 1.5 10-4 2.645 ± 0.329 0.953 -2.20 0.018
Carangidae Chloroscombrus chrysurus (Linnaeus, 1766) 658 110 201 372 2.9 10-5 ± 5.4 10-6
2.786 ± 0.034 0.985 -12.39 <0.001
Decapterus punctatus (Cuvier, 1829) 106 181 207 243 5.0 10-6 ± 4.8 10-5 3.122 ± 0.207 0.896 1.17 0.123
Oligoplites saliens (Bloch, 1793) 393 149 256 635 3.2 10-6 ± 6.0 10-7 3.119 ± 0.031 0.992 7.59 <0.001
Selene setapinnis (Mitchill, 1815) 66 33 232 442 1.9. 10-5 ± 1.5 10-5 2.915 ± 0.137 0.996 -1.24 0.110
Trachurus lathami Nichols, 1920 1801 27 148 208 9.1 10-6 ± 1.8 10-6 3.018 ± 0.038
0.991 0.95 0.171
Sciaenidae Ctenosciaena gracilicirrhus (Metzelaar, 1919) 79 90 129 183 4.3 10-6 ± 0.2 10-5
3.229 ± 0.104 0.980 4.40 <0.001
Gempylidae Thyrsitops lepidopoides (Cuvier, 1832) 205 60 177 360 2.9 10-6 ± 1.5 10-6
3.108 ± 0.088 0.978 2.42 0.008
Trichiuridae Trichiurus lepturus Linnaeus, 1758 580 104 657 1510 3.6 10-7 ± 2.4 10-7 3.068 ± 0.095 0.892 1.40 0.080
Scombridae Scomber japonicus Houttuyn, 1782 274 72 228 310 3.9 10-6 ± 8.7 10-6
3.129 ± 0.037 0.990 6.82 <0.001
Stromateidae Peprilus paru (Linnaeus, 1758) 97 92 210 304 1.2 10-5 ± 1.0 10-5 3.059 ± 0.150 0.988 0.77 0.221
Tetraodontiformes Monacanthidae Aluterus monoceros (Linnaeus, 1758) 64 136 202 254 6.5 10-7 ± 4.3 10-7 3.538 ± 0.185 0.959 5.80 <0.001
Stephanolepis hispidus (Linnaeus, 1766) 90 24 50 173 3.9 10-4 ± 2.7 10-4 2.378 ± 0.138 0.974 -8.92 <0.001
Diodontidae Chilomycterus spinosus (Linnaeus, 1758) 93 40 64 140 1.4 10-3 ± 6.4 10-4 2.377 ± 0.091
http://www.biotaneotropica.org.br/v13n2/en/abstract?short-communication+bn01613022013 http://www.biotaneotropica.org.br Figure 2. Model based on Engraulis anchoita data of the residual analysis applied to fit the length-weight relationships. The graphics allow checks of the
assumptions of (a) normality, (b) randomness, (c) homoscedasticity and (d) independence of the data.
Figure 3. Frequency distribution values of the coefficient b obtained for the
length-weight relationships of 25 species.
The magnitude of b represents the fish growth pattern, whether the growth is proportionally greater for length or weight (Quinn II &
Deriso 1999), and is therefore related to their body shape (Pough et al.
2008). Thus, fish in pelagic ecosystem usually have small and slender
shapes, which show a proportionately greater increase in length than in weight over time, rather than rounded shapes. Besides, allometric
coefficient depicts better relative growth of fishes (Braga 1986).
In this study, the b values varied within the expected range (Froese 2006): the most common values were between 3.0 and 3.1, the range
that included 50% of the species. The distribution of b values was
asymmetrical, with more species having values above 3.0 than below
this value; eleven species showed positive allometry (b > 3, p < 0.05), seven showed negative allometry (b < 3, p < 0.05), and seven showed isometric growth (b = 3, p > 0.05) (Table 1).
Unless some length-weight parameters represent only some life stages, the results are the most current estimates for the species recorded in the Southeastern Brazilian Bight and may be used as a tool in future studies aimed at monitoring the populations.
References
BERNARDES, R.A. & ROSSI-WONGTSCHOWSKI, C.L.D.B. 2000. Length-weight relationship of small pelagic fish species of the Southeast and South Brazilian Exclusive Economic Zone. Naga: The Iclarm Quartely 23(4):30-32.
BERVIAN, G., FONTOURA, N.F. & HAIMOVICI, M. 2006. Statistical model of variable allometric growth: otolith growth in Micropogonias furnieri (Actinopterygii, Sciaenidae). J. Fish Biol. 68:196-208. http:// dx.doi.org/10.1111/j.0022-1112.2006.00890.x
BEVERTON, R.J.H. & HOLT, S.J. 1993. On the dynamics of exploited fish populations. The Blackburn Press, Caldwell. http://dx.doi. org/10.1007/978-94-011-2106-4
BRAGA, F.M.S. 1986. Estudo entre fator de condição e relação peso/ comprimento para alguns peixes marinhos. Braz. J. Biol. 46(2):339-346. BRASIL. Ministério do Meio Ambiente - MMA. 2006. Programa REVIZEE:
avaliação do potencial sustentável de recursos vivos da Zona Econômica Exclusiva do Brasil - relatório executivo. MMA, Brasília.
ESCHMEYER, W.N. (ed.). 2012. Catalog of Fishes. http://research. calacademy.org/research/ichthyology/catalog/fishcatmain.asp. (último acesso em 24/06/2012).
FREIRE, K.M.F., ROCHA, G.R.A. & SOUZA, I.L. 2009. Length-weight relationships for fishes caught by shrimp trawl in southern Bahia, Brazil.
J. Appl. Ichthyol. 25(3):356-357.
http://dx.doi.org/10.1111/j.1439-0426.2009.01220.x
FROESE, R. 2006. Cube law, condition factor and weight length relationships: history, meta-analysis and recommendations. J. Appl. Ichthyol. 22:241-253. http://dx.doi.org/10.1111/j.1439-0426.2006.00805.x
FROTA, L.O., COSTA, P.A.S. & BRAGA, A.C. 2004. Length-weight relationships of marine fishes from the central Brazilian coast. Naga: The Iclarm Quartely 27(1-2):20-26.
GIARIZZO, T., SILVA DE JESUS, A.J., LAMEIRA, E.C., ARAÚJO DE ALMEIDA, J.B., ISAAC, V. & SAINT-PAUL, U. 2006. Weight-length relationships for intertidal fish fauna in a mangrove estuary in northern Brazil. J. Appl. Ichthyol. 22:325-327. http://dx.doi.org/10.1111/j.1439-0426.2006.00671.x
HAIMOVICI, M.& VELASCO, G. 2000. Length-weight relationship of marine fishes from Southern Brazil. Fishbyte 23(1):19-23.
HUXLEY, J.S. 1993. Problems of relative growth, with a new introduction by Frederick B. Churchill and an essay by Richard E. Strauss. The John Hopkins University Press, Baltimore.
JOYEUX, J.C., GIARRIZZO, T., MACIEIRA, R.M., SPACH, H.L. & VASKE JUNIOR, T. 2009. Length-weight relationships for Brazilian estuarine fishes along a latitudinal gradient. J. Appl. Ichthyol. 25(3):350-355. http:// dx.doi.org/10.1111/j.1439-0426.2008.01062.x
LE CREN, E.D. 1951. The length-weight relationship and seasonal cycle in gonad weight and condition in the perch (Perca fluviatilis). J. Anim. Ecol. 20(2):201-219. http://dx.doi.org/10.2307/1540
LESSA, R.P., NÓBREGA, M.F. & BEZERRA JÚNIOR, J.L. 2004. Dinâmica de populações e avaliação de estoques dos recursos pesqueiros da região nordeste. vol.II. DIMAR Departamento de Pesca, Universidade Federal Rural de Pernambuco, Recife.
MACIEIRA, R.M. & JOYEUX, J.C. 2008. Length-weight relationships for rockpool fishes in Brazil. J. Appl. Ichthyol. 25(3):358-359. http://dx.doi. org/10.1111/j.1439-0426.2008.01118.x
MADUREIRA, L.S.P. & ROSSI-WONGTSCHOWSKI, C.L.D.B. (ed.). 2005. Prospecção de recursos pesqueiros pelágicos na Zona Econômica Exclusiva da região Sudeste-Sul do Brasil: hidroacústica e biomassas. Instituto Oceanográfico, USP, São Paulo.
MAGRO, M., CERGOLE, M.C. & ROSSI-WONGTSCHOWSKI, C.L.D.B. 2000. Síntese de conhecimentos dos principais recursos pesqueiros costeiros potencialmente explotáveis na Costa Sudeste-Sul do Brasil: Peixes. MMA/CIRM, São Paulo.
MUTO, E.Y., SOARES, L.S.H. & ROSSI-WONGTSCHOWSKI, C.L.D.B. 2000. Length-weight relationship of marine fish species off São Sebastião System, São Paulo, Southeastern Brazil. Naga: The Iclarm Quartely 23(4):27-29.
OLIVEIRA FREITAS, M., MACHADO VASCONCELOS, S., HOSTIM-SILVA, M. & SPACH, H.L. 2011. Length-weight relationships for fishes caught by shrimp trawl in Santa Catarina coast, South Atlantic, Brazil. J. Appl. Ichthyol. 27(6):1427-1428. http://dx.doi.org/10.1111/j.1439-0426.2011.01749.x
POUGH, F.H., JANIS, C.M. & HEISER, J. 2008. A vida dos vertebrados. 4. ed. Atheneu, São Paulo.
QUINN II, T.J. & DERISO, R.B. 1999. Quantitative fish dynamics. Oxford University Press, New York.
ROSSI-WONGTSCHOWSKI, C.L.D.B. & PAES, E.T. 1993. Padrões espaciais e temporais da comunidade de peixes demersais do litoral norte do Estado de São Paulo - Ubatuba, Brasil. Publ. espc. Inst. Oceanogr. (10):69-188.
ROSSI-WONGTSCHOWSKI, C.L.D.B., SACCARDO, S.A. & CERGOLE, M.C. 1995. Situação do estoque da sardinha (Sardinella brasiliensis) no litoral sudeste e sul do Brasil. IBAMA, Brasília.
ROSSI-WONGTSCHOWSKI, C.L.D.B., MUTO, E.Y. & SOARES, L.S.H. 2008. Ictiofauna. In Oceanografia de um ecossistema subtropical: Plataforma de São Sebastião, SP (A.M.S. Pires Vanin, org.). EdUSP, São Paulo, p. 381-404.
SCHNEIDER, J.C., LAARMAN, P.W. & GOWING, H. 2000. Length-weight relationships. In Manual of fisheries survey methods II with periodic updates (J.C. Schneider, ed.). Michigan Department of Natural Resources, Michigan, p. 1-18.
SPARRE, P. & VENEMA, S.C. 1998. Introduction to tropical fish stock assessment. FAO Fish. Tech. Pap., 306(1):1-407.
TRIOLA, M.F. 2005. Introdução à estatística. 9. ed. LTC, Rio de Janeiro. VAZZOLER, G. & IWAI, M. 1971. Relatório sobre prospecção e pesca
exploratória na plataforma continental do Rio Grande do Sul. Instituto Oceanográfico, USP, São Paulo.
VAZZOLER, G. 1973. Relatório sobre a segunda pesquisa oceanográfica e pesqueira do Atlântico Sul entre Torres e Maldonado. Instituto Oceanográfico, USP, São Paulo.
VIANNA, M., COSTA, F.E.S. & FERREIRA, C.N. 2004. Length-weight relationship of fish caught as by-catch by shrimp fishery in the southeastern coast of Brazil. Bol. Inst. Pesca 30(1):81-85.
VIEIRA, S. 2006. Análise de variância. Atlas, São Paulo.
YESAKI, M., RAHN, E. & SILVA, G. 1976. Sumário das explorações de peixes de arrasto de fundo ao largo da costa Sul do Brasil. Ser. Doc. Tec. / Inst. Pesqui. Desenvolv. Pesq. 19:1-37.