Braz. J. Biol., 67(4, Suppl.): 939-943, 2007 939
Genetic diversity within and between broodstocks of the white shrimp
Litopenaeus vannamei
(Boone, 1931) (Decapoda, Penaeidae) and its
implication for the gene pool conservation
Freitas, PD.*, Calgaro, MR. and Galetti Jr., PM.
Departamento de Genética e Evolução, Universidade Federal de São Carlos – UFSCar, Rodovia Washington Luiz, Km 235, CP 676, CEP 13565-905, São Carlos, SP, Brazil
*e-mail: [email protected]
Received March 21, 2006 – Accepted April 12, 2007 – Distributed December 1, 2007 (With 2 figures)
Abstract
Genetic variation within and between fifteen closed broodstock lines of the Pacific white shrimp Litopenaeus vannamei,
reared at different hatcheries in the Brazilian coast, was assessed by RAPD analysis. Fifty two polymorphic loci were iden-tified when a set of five decamer primers was used in PCR. The genetic diversity analysis within lines evidenced genetic variation loss probably related to bottleneck effects and inbreeding. In addition, the genetic divergence values between the different samples appear to reflect the initial founder composition of such stocks, in some cases, sharing a common origin, suggesting a putative importance of interbreeding for the establishment of genetic improvement programs for these brood-stocks. The genetic variation monitoring appears to be helpful to the gene pool conservation of this aquaculture species, mainly if considered its exotic status in Brazil and the current impossibility of new introduction of wild individuals.
Keywords: aquaculture, gene pool conservation, genetic variation.
Diversidade genética dentro e entre estoques reprodutores do camarão branco
Litopenaeus vannamei
(Boone, 1931) (Decapoda, Penaeidae) e sua
implicação para a conservação do conjunto gênico
Resumo
A variação genética existente dentro e entre quinze linhagens fechadas de reprodutores do camarão branco Litopenaeus vannamei, mantidas em diferentes laboratórios de larvicultura na costa brasileira, foi estudada utilizando análises
RAPD. Através de um conjunto de cinco iniciadores decâmeros em PCR, foram identificados 52 locos polimórficos. A análise da diversidade genética dentro de cada linhagem evidenciou perda da variação genética provavelmente devida a efeitos de bottleneck e endocruzamento. Em adição, os valores de divergência genética entre as diferentes linhagens parecem refletir a composição inicial de fundação desses estoques, em alguns casos, compartilhando uma origem co-mum, sugerindo uma importância potencial do exo-cruzamento para estabelecer programas de melhoramento genético baseado nessas linhagens reprodutoras. O monitoramento da variação genética será muito útil para a conservação do conjunto gênico desta espécie de aquacultura, especialmente se for considerado seu status exótico no Brasil e que atualmente é impossível a realização de novas introduções de indivíduos selvagens.
Palavras-chave: aquacultura, conservação do conjunto gênico, variação genética.
1. Introduction
A long-term shrimp farming in the Brazilian coast can depend of how well we manage our national brood-stocks of Litopenaeus vannamei (Penaeidae), an exotic
species from the American Pacific coast. In the past years, Brazilian farmers have quickly increased their shrimp production exclusively based on this shrimp prof-its and the country is currently placed among the major producers of captive shrimp in the Western hemisphere (Rocha et al., 2004). However, the lack of knowledge on the genetic structure of this shrimp could impair
farm-ing activity since inbreedfarm-ing and genetic drift effects can rapidly lead to problems such as disease susceptibility and reduced quality of breeders and post-larvae (Freitas et al., 2001; Freitas and Galetti, 2002).
In the earlier years of the L. vannamei farming in
seven Brazilian hatcheries was assessed by using RAPD analysis, in order to provide an original genetic data base useful for further breeding programs and for the gene pool conservation of this exotic shrimp in Brazil.
2. Material and Methods
2.1Broodstocks, sample collection, and DNA extraction
Specimens of fifteen L. vannamei closed broodstock lines owned by seven Brazilian hatchery industries locat-ed at the States of Bahia (Lusomar and Maricultura), Rio Grande do Norte (Aquatec and Emparn), Paraíba (Compar and Aquamaris), and Santa Catarina (Ufsc), were analyzed (Table 1). Pleopod samples from 252 individuals were fixed in 1 mL of 95% ethanol and stored at –20 °C. DNA extraction was performed using a phenol: chloroform: iso-amylic alcohol mix (Sambrook et al., 1989).
2.2 RAPD-PCR and electrophoresis analysis
The Ready-To-GoTM RAPD Analysis Beads Kit (GE Healthcare Life Sciences) was used following the not allowed since 1998, and new broodstock lines have
been founded in the different Brazilian hatcheries by us-ing their own captive-born animals. The gene pool con-servation of this exotic species seems to be a great chal-lenge. Presently, there are several closed lines at these different hatcheries spread throughout the Brazilian coast. Each hatchery presents broodstocks with peculiar characteristics, related to their different origin and cap-tive conditions.
It is well known that a population can present a unique gene combination and the genetic structure of a set of reproductively isolated populations can mutually diverge (Barker, 1994). Moreover, the genetic variation has been claimed to be the original source to the suc-cessful development of captive stocks and it is believed that genetic variability loss restrains the possibilities of improvement of these animals (Allendorf and Ryman, 1987; Barker, 1994). Thus, an extensive genetic char-acterization of the Brazilian shrimp closed lines can be helpful to the development of breeding programs.
In the present work, the genetic diversity within and between fifteen L. vannamei broodstocks owned by
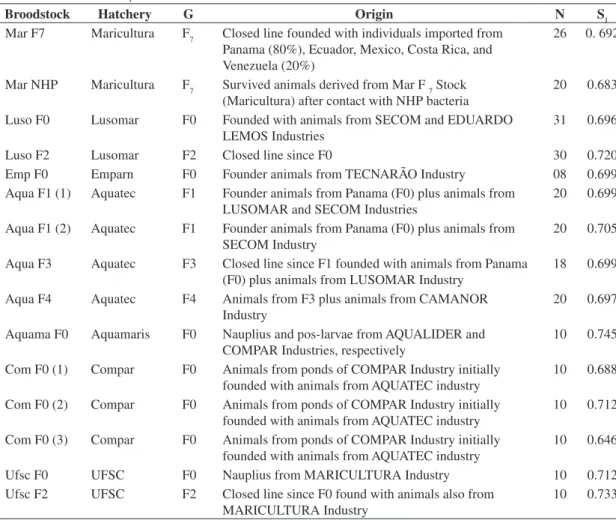
Table 1. Data on the different studied broodstocks. Generation time (G), number of analyzed animals (N), and within Jac-card’s genetic similarity (SJ).
Broodstock Hatchery G Origin N SJ
Mar F7 Maricultura F7 Closed line founded with individuals imported from Panama (80%), Ecuador, Mexico, Costa Rica, and Venezuela (20%)
26 0. 692
Mar NHP Maricultura F7 Survived animals derived from Mar F 7 Stock (Maricultura) after contact with NHP bacteria
20 0.683
Luso F0 Lusomar F0 Founded with animals from SECOM and EDUARDO LEMOS Industries
31 0.696
Luso F2 Lusomar F2 Closed line since F0 30 0.720
Emp F0 Emparn F0 Founder animals from TECNARÃO Industry 08 0.699 Aqua F1 (1) Aquatec F1 Founder animals from Panama (F0) plus animals from
LUSOMAR and SECOM Industries
20 0.699
Aqua F1 (2) Aquatec F1 Founder animals from Panama (F0) plus animals from SECOM Industry
20 0.705
Aqua F3 Aquatec F3 Closed line since F1 founded with animals from Panama (F0) plus animals from LUSOMAR Industry
18 0.699
Aqua F4 Aquatec F4 Animals from F3 plus animals from CAMANOR Industry
20 0.697
Aquama F0 Aquamaris F0 Nauplius and pos-larvae from AQUALIDER and COMPAR Industries, respectively
10 0.745
Com F0 (1) Compar F0 Animals from ponds of COMPAR Industry initially founded with animals from AQUATEC industry
10 0.688
Com F0 (2) Compar F0 Animals from ponds of COMPAR Industry initially founded with animals from AQUATEC industry
10 0.712
Com F0 (3) Compar F0 Animals from ponds of COMPAR Industry initially founded with animals from AQUATEC industry
10 0.646
Ufsc F0 UFSC F0 Nauplius from MARICULTURA Industry 10 0.712 Ufsc F2 UFSC F2 Closed line since F0 found with animals also from
MARICULTURA Industry
10 0.733
Genetic diversity in shrimp
Braz. J. Biol., 67(4, Suppl.): 939-943, 2007 941
manufacturer’s instructions. Five decamer primers were used after selection from a panel of 38 tested primers (Table 2). The reactions were carried out in a PT-100TM thermal cycler (MJ Research) programmed as follows: 4 minutes of hot start at 94 °C, followed by 35 cycles of 1 minute of denaturation at 92 °C, 1.5 minute of hybridi-zation at 37 °C, and 2 minutes of extension at 72 °C, with a final 3 minutes extension at 72 °C. Fifty nanograms of template DNA and 25 pmoles of primer were used in a fi-nal solution volume of 25 µL, containing 0.4 mM of each dNTP, 2.5 µg BSA, 3 mM MgCl2, 30 mM KCl, 10 mM Tris (pH 8.3), milliQ water, AmpliTaqTM DNA polymer-ase, and Stoffel fragment (concentrations not provided by the manufacturer). The amplification products were ana-lyzed in 1.5% agarose gel with 0.5 µg.mL-1 of ethidium bromide (3 hours at 100 V in TBE buffer 1x), under ul-traviolet light. The Edas 290 (Kodak Digital Science TM) system was used for photodocumentation.
2.3 Statistical analysis
Fragments of high reproducibility were selected for the statistical analyses, and binary matrixes based on the presence (1) or absence (0) of each fragment were con-structed. All statistical tools were based on the analysis of diploid data for dominant molecular data (Yeh et al., 1999). Jaccard’s genetic similarity coefficient (Jaccard, 1901) was obtained using the software NTSYS-pc ver-sion 1.80 (Rohlf, 1993). Within allele frequencies (Nei, 1987) and genetic distance (Nei, 1972) between the broodstocks were calculated using the software Popgene version 1.31 (Yeh et al., 1999). Allele frequency diver-gence was tested based on Chi-square analysis (P < 0.05) and homogeneity test between samples. A genetic dis-tance dendrogram based on the UPGMA grouping meth-od was generated (Sneath and Sokal, 1973).
3. Results
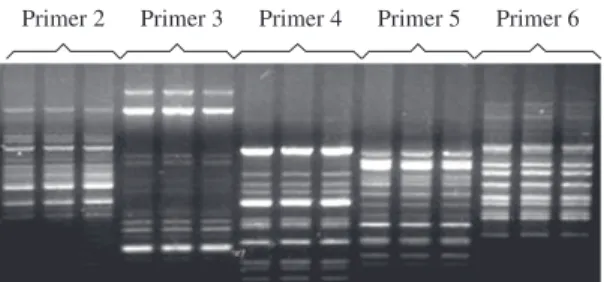
The five selected primers gave highly reproducible patterns (Figure 1), and a total of 52 polymorphic frag-ments were scored. The Jaccard’s genetic similarity (Sj) ranged from 64.6 to 74.5% (Table 1).
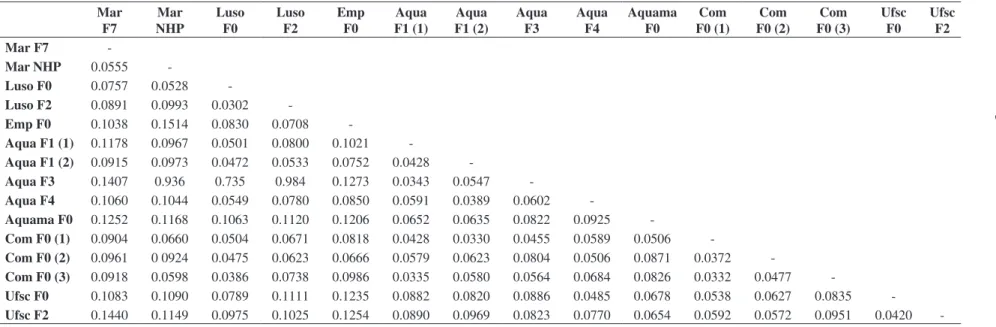
Allele frequencies were quite variable between sam-ples, presenting significant differences (P < 0.05) for most of the analyzed loci (data not shown). The small-est genetic distance was observed between Luso F0 and Luso F2 (0.0302), while the largest one was identified between Mar NHP and Emp F0 (0.1514) (Table 3). Mar F7 and Mar NHP were both the most divergent lines when comparing to the remaining ones. Six major
Figure 2. Dendrogram based on the genetic distance for the fifteen studied stocks. Branches are indicated by Arabic nu-merals (1-6).
Primer 2 Primer 3 Primer 4 Primer 5 Primer 6
Figure 1. RAPD reproducibility assay in agarose gel. The standardized RAPD reaction made in three distinct times with a single DNA sample using primers 2, 3, 4, 5, and 6.
1 2 3 4 5 6 Aqua F1 (1)
Aqua F1 (2)
Aqua F3 Aqua F4
Aquama F0 Com F0 (3)
Com F0 (1)
Com F0 (2) Luso F2 Luso F0 Ufsc F0 Ufsc F2 Emp F0 Mar F7 Mar NHP Table 2. Decamer primers used in the RAPD reactions.
Oligonucleotides Sequence (5’ - 3’) 2 (GE Healthcare Life Sciences) GGTGCGGGAA
3 (GE Healthcare Life Sciences) GTTTCGCTCC
4 (GE Healthcare Life Sciences) GTAGACCCGT
5 (GE Healthcare Life Sciences) AAGAGCCCGT
6 (GE Healthcare Life Sciences) AACGCGCAAC
branches were revealed in the genetic distance dendro-gram (Figure 2). A larger branch (1) joins all brood-stocks owned by Aquatec (Aqua F1 (1), Aqua F1 (2), Aqua F3, Aqua F4), and Compar (Com F0 (1), Com F0 (2), Com F0 (3)). A second branch (2) joins Luso F2 and Luso F0. Aquama F0 is alone in branch 3. Ufsc F0 and Ufsc F2 are joined in branch 4, Emp F0 is alone in branch 5, and finally Mar F7 and Mar NHP are joined in branch 6.
4. Discussion
Two main phenomena that are greatly responsible for genetic variation loss in small and isolated breeder popu-lations in captive conditions are the founder effect and in-breeding (Barker, 1994). Breeder selection, the use of cap-tive-reared animals to establish subsequent broodstocks, and the reduced number of breeders (usually 100 dams and 100 sires) commonly used in the hatcheries can fa-vor the decreasing of the genetic diversity levels within a closed broodstock line (e.g. Sbordoni et al., 1986).
simi-Freitas, PD., Calg
aro, MR. and Galetti Jr
., PM.
Br
az. J
. Biol., 67(4, Suppl.): 939-943, 2007
Table 3. Genetic distance between the broodstocks.
Mar F7
Mar NHP
Luso F0
Luso F2
Emp F0
Aqua F1 (1)
Aqua F1 (2)
Aqua F3
Aqua F4
Aquama F0
Com F0 (1)
Com F0 (2)
Com F0 (3)
Ufsc F0
Ufsc F2
Mar F7
-Mar NHP 0.0555
-Luso F0 0.0757 0.0528
-Luso F2 0.0891 0.0993 0.0302
-Emp F0 0.1038 0.1514 0.0830 0.0708
-Aqua F1 (1) 0.1178 0.0967 0.0501 0.0800 0.1021
-Aqua F1 (2) 0.0915 0.0973 0.0472 0.0533 0.0752 0.0428
-Aqua F3 0.1407 0.936 0.735 0.984 0.1273 0.0343 0.0547
-Aqua F4 0.1060 0.1044 0.0549 0.0780 0.0850 0.0591 0.0389 0.0602
-Aquama F0 0.1252 0.1168 0.1063 0.1120 0.1206 0.0652 0.0635 0.0822 0.0925
-Com F0 (1) 0.0904 0.0660 0.0504 0.0671 0.0818 0.0428 0.0330 0.0455 0.0589 0.0506
-Com F0 (2) 0.0961 0 0924 0.0475 0.0623 0.0666 0.0579 0.0623 0.0804 0.0506 0.0871 0.0372
-Com F0 (3) 0.0918 0.0598 0.0386 0.0738 0.0986 0.0335 0.0580 0.0564 0.0684 0.0826 0.0332 0.0477
-Genetic diversity in shrimp
Braz. J. Biol., 67(4, Suppl.): 939-943, 2007 943
Acknowledgments — This research was supported by Conselho Nacional de Desenvolvimento Científico e Tecnológico (CNPq), and Associação Brasileira de Criadores de Camarão (ABCC). The authors thank the shrimp hatchery industry for the animal samples and useful information about the studied stocks.
References
ABCC, 2002. O Agronegócio do camarão marinho cultivado. Recife, Associação Brasileira de Criadores de Camarão, 20p. ALLENDORF, FW. and RYMAN, N., 1987. Genetic management of hatchery stocks. In RYMAN, N. and UTTER, F. (eds.), Population Genetics and Fishery Management. Seattle, University of Washington Press, p. 141-159.
BARKER, JSF., 1994. Animal breeding and conservation genetics. In Loeschcke, V., TOMIUK, J. and JAIN, SK. (eds.). Conservation Genetics. Switzerland, Birkhäuser Verlag Basel, p. 382-395.
FREITAS, PD., CALGARO, MR., DE FRANCISCO, AK. and GALETTI JR., PM., 2001. Um pouco da genética dos nossos plantéis de reprodutores de Litopenaeus vannamei. Rev. ABCC, vol. 3, no. 1, p. 20-24.
FREITAS, PD. and GALETTI JR., PM., 2002. PCR-based VNTR core sequence analysis for inferring genetic diversity in the shrimp Litopenaeus vannamei. Genet. Mol. Biol., vol. 25, no. 4, p. 431-344.
JACCARD, P., 1901. Estude comparative de la distribution florale dans une portion des Alpes et des Jura. Bull. Soc. Vaudoise Sci. Nat., vol. 37, p. 547-579.
NEI, M., 1972. Genetic distance between population. Am. Nat., vol. 106, no. 50, p. 283-292.
-, 1987. Molecular Evolutionary Genetics. New York, Columbia University Press, 512p.
ROCHA, IP., RODRIGUES, J. and AMORIM, L., 2004. A carcinicultura brasileira em 2003. Recife, ABCC.
ROHLF, FJ., 1993. NTSYS-pc: numerical taxonomy and multivariate analysis system, version 1.80. Exeter software. Setauket, New York.
SAMBROOK, J., FRITSCH, EF. and MANIATIS, T., 1989. Molecular cloning: A Laboratory Manual. 2nd ed. New York,
Cold Spring Harbor.
SBORDONI, V., DE MATTHAEIS, M., COBOLLI-SBORDONI, M., LA ROSA, G. and MATTOCCIA, M., 1986. Bottleneck effects and the depression of genetic variability in hatchery stocks of Penaeus japonicus (Crustacea, Decapoda). Aquaculture, vol. 57, no. 1- 4, p. 239-251.
SNEATH, PA. and SOKAL, RR., 1973. Numerical Taxonomy. San Francisco, Freeman, 573p.
THORPE, JP., SOLÉ-CAVA, AM. and WATTS, PC., 2000. Exploited marine invertebrates: genetics and fisheries. Hydrobiologia, vol. 420, no. 1, p. 165-184.
YEH, F., YANG, R. and BOYLE, T., 1999. Popgene, version 1.31. Microsoft window-based freeware for population genetic analysis. University of Alberta, Edmonton.
lar RAPD analysis, our results suggest that a significant genetic variation loss occurred in the studied broodstock lines and could be detect in subsequent generations of some closed lines. For instance, Sj values are slightly in-creased on Luso F0 to Luso F2 and Ufsc F0 to Ufsc F2. However, a strict correlation between generation time and genetic variation in overall was not found. Some brood-stocks (e.g. Aquama F0) at initial generation showed a reduced genetic diversity compared to other older lines (e.g. Mar F7). At least two explanations appear to ac-count for this finding. The lines were founded by gene pools of different origin (Table 1) and the hatcheries have distinct broodstock management, such as different number of breeders in each spawning, usually ranging from 50 to 100 couples. In addition to the genetic drift due to using few breeders, the inbreeding that occurred along the subsequent generations and the selection pro-moted to distinct captive condition (in special weather and diseases) can also contribute for the significant allele divergence observed among the studied broodstocks.
There is a trend for the clustering among lines owned by a single hatchery, resulting on distinct branches in the genetic distance dendrogram. The exception was observed in the branch #1 joining broodstocks owned by Aquatec and Compar. It is registered, however, that breeders from Aquatec lines were used to establish both Compar broodstocks studied here, explaining their more strict genetic relationship. The remaining studied brood-stocks were separated in different branches following their hatchery origin, reflecting the usual practice to begin a new line in each hatchery with genetic material present in their own living broodstocks. Thus, smaller genetic distance must be expected between broodstocks of a determined hatchery.
Despite of the absence of stock-specific markers, the established genetic relationships provide helpful information to compose new broodstocks. Currently in Brazil, there is a strong technological tendency focused on genetic improvement programs of L. vannamei, with
the development of select lines for growth and pathogen-free/resistant individuals (ABCC, 2002). The utilization of genetically unrelated individuals as breeders can in-crease the levels of genetic variation within new stocks, mitigating possible negative effects caused by genetic drift and/or inbreeding (Thorpe et al., 2000).