Pesq. agropec. bras., Brasília, v.48, n.8, p.968-974, ago. 2013 DOI: 10.1590/S0100-204X2013000800023
Genetic variability of marine shrimp in the Brazilian industry
Rodrigo Maggioni(1), Maria Raquel Moura Coimbra(2), Raimundo Bezerra da Costa(3), Fábio Mendonça Diniz(4),
Wagner Franco Molina(5), Diana Magalhães de Oliveira(3) and Angela Puchnick‑Legat(4)
(1)Universidade Federal do Ceará, Instituto de Ciências do Mar, Centro de Diagnóstico de Enfermidades de Organismos Aquáticos,
Avenida Abolição, no 3.207, Meireles, CEP 60165‑081 Fortaleza, CE, Brazil. E‑mail: [email protected] (2)Universidade Federal Rural de
Pernambuco, Departamento de Pesca e Aquicultura, Laboratório de Genética Aplicada, Avenida Dom Manoel de Medeiros, s/no, Dois
Irmãos, CEP 52171‑900 Recife, PE, Brazil. E‑mail: [email protected] (3)Universidade Estadual do Ceará, Faculdade de Veterinária,
Núcleo de Genômica e Bioinformática, Avenida Paranjana, no 1.700, CEP 60740‑903 Fortaleza, CE, Brazil. E‑mail: [email protected],
[email protected] (4)Embrapa Meio‑Norte, Núcleo de Pesquisa em Aquicultura e Pesca, Laboratório de Biotecnologia Aquática,
BR‑343, Km 35, CEP 64200‑970 Parnaíba, PI, Brazil. E‑mail: [email protected], [email protected] (5)Universidade Federal do
Rio Grande do Norte, Centro de Biociências, Departamento de Biologia Celular e Genética, Laboratório de Genética de Recursos Marinhos, Lagoa Nova, s/no, CEP 59078‑970 Natal, RN, Brazil. E‑mail: [email protected]
Abstract – The objective of this work was to estimate the genetic variability level and distribution in Brazilian broodstocks of marine shrimp (Litopenaeus vannamei). Nine of the country’s largest hatcheries were evaluated using codominant and highly polymorphic microsatellite markers. The results obtained from genotyping of ten microsatellite loci are indicative of genetic variability that is compatible with that found in wild populations of L. vannamei in Mexico and Central America. A possible explanation is the highly diversified and relatively
recent origin of the available broodstocks. Bayesian analysis detected a signal for five founding populations. The distribution of genetic distances partially reflects geographical location, and this information will be useful for the creation of new broodstocks. Therefore, L. vannamei genetic variability among nine of the largest national hatcheries can be considered high.
Index terms: Litopenaeus vannamei, aquaculture, microsatellite, shrimp farming.
Variabilidade genética do camarão marinho na indústria brasileira
Resumo – O objetivo deste trabalho foi estimar o nível e a distribuição da variabilidade genética em reprodutores brasileiros do camarão marinho (Litopenaeus vannamei). Nove dos maiores laboratórios de maturação do país foram analisados por meio de marcadores microssatélites codominantes e altamente
polimórficos. Os resultados obtidos a partir da genotipagem de dez locos de microssatélites são indicativos de variabilidade genética compatível com aquela encontrada em populações naturais de L. vannamei no México
e na América Central. Uma possível explicação é a origem altamente diversificada e relativamente recente dos plantéis disponíveis. A análise bayesiana detectou sinal correspondente a cinco populações originais. A distribuição das distâncias genéticas reflete parcialmente a localização geográfica, e essa informação será útil na formação de novos plantéis. Portanto, a variabilidade genética de L. vannamei entre nove dos maiores laboratórios de maturação nacionais pode ser considerada alta.
Termos para indexação: Litopenaeus vannamei, aquacultura, microssatélite, carcinicultura.
Introduction
The Pacific white shrimp [Litopenaeus vannamei
(Boone, 1931)] is arguably the world’s most profitable species in marine aquaculture (Food and Agriculture Organization of the United Nations, 2010). It is a highly adaptable farm species that has been successfully introduced from its native Western American coast to all South America and parts of Asia, including Thailand and China. It is also practically the only cultured marine shrimp species in Brazil, at the moment, and over 95% of the national production is
located on the Northeast coast. Litopenaeus vannamei
However, after more than ten years of disordered growth, the effects of poor planning started to show mainly through decreasing productivity and the dissemination of infectious diseases (Gesteira & Paiva, 2003; Nunes et al., 2004), such as the newly discovered infectious myonecrosis (Poulos et al., 2006). One of the immediate concerns of the Brazilian shrimp industry has been the genetic diversity of the available shrimp broodstocks, especially since the country does not have access to wild stocks of L. vannamei. Brazilian
L. vannamei broodstocks have multiple origins, with
recorded imports from Panama, Ecuador, and Venezuela (Francisco & Galetti Junior, 2005; Gonçalves et al., 2005). However, no detailed information is available about origin, management practices, and performance results. In typical conditions, Brazilian hatcheries have a production cycle of 3–5 months, after which breeders are completely replaced, often with individuals from the same broodstock. In general, hatchery managers acknowledge occasional animal exchange with hatcheries or farms from different parts of the country, when signs of productivity loss are detected. Within a hatchery, breeding usually takes place in tanks with 100 to 140 individuals in equal sex proportion.
The increasing availability of advanced molecular tools has allowed obtaining new results on the genetics of shrimp broodstocks and natural populations, which have been accumulating quickly since the mid 1990’s (Ball & Chapman, 2003; Francisco & Galetti Junior, 2005; Valles‑Jimenez et al., 2005). DNA microsatellites have been the basis of the majority of the recent approaches. Microsatellite loci consist of motifs of one to six base pairs repeated in tandem, which are very common in eukaryotic genomes (Tautz & Renz, 1984). Microsatellites are inherently instable and most mutations are believed to be caused by slip‑strand mispairing errors during DNA replication and recombination (Hancock, 1999). These errors result in high mutation rates, and a large number of alleles is normally observed, resulting in high polymorphism. Microsatellites are codominant and produce potentially cumulative data. They are considered ideal markers for characterizing inbreeding and for pedigree studies and, therefore, have been widely used to monitor genetic diversity in aquaculture species (Koljonen et al., 2002; Skaala et al., 2004). However, penaeid shrimp microsatellites have sometimes proven difficult to type and validate, and null alleles are often observed (Valles‑Jimenez et al., 2005).
The objective of this work was to estimate the genetic variability level and distribution of the Brazilian broodstocks of marine shrimp (L. vannamei).
Materials and Methods
A total of 450 individuals were sampled from nine of the main commercial hatcheries in Brazil, from 2005 to 2006. Locations and laboratories were kept anonymous throughout this paper for confidentiality reasons. For DNA analysis, the fifth pair of pleopods was collected and stored in 95% ethanol. DNA was extracted following the standard proteinase K/phenol‑chloroform‑isoamyl alcohol (PCI) protocol of Sambrook et al. (1989) with a few modifications. Pleopod muscular tissue was digested in Tris‑HCl 100 mmol L‑1, pH 7.5, 1% SDS,
with a final concentration of 0.5 mg mL‑1 Proteinase K.
The mixture was initially incubated at 50°C for 2 hours, and after that at 37°C, overnight. DNA was purified by successive washes with phenol:chloroform:isoamyl alcohol 25:24:1 (v/v/v) and chloroform:isoamyl alcohol 24:1 (v/v). Each purification step was followed by centrifugation at 10,000 g for 10 min. The supernatant
was transferred to a 1.5 mL microtube, and total DNA was precipitated by centrifugation at 10,000 g for 15
min, in cold absolute ethanol; pellets were washed with 70% ethanol, air dried, diluted in 50 µL TE (Tris‑HCl 10 mmol L‑1, pH 8.0, EDTA 1 mmol L‑1, pH 8.0), and
stored at ‑20ºC.
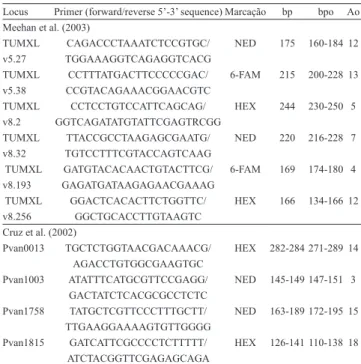
All ten microsatellite loci used in the present study were chosen on the basis of polymorphism and reproducibility, as reported by Cruz et al. (2002) and Meehan et al. (2003) (Table 1). Each 10 µL singleplex polymerase chain reaction (PCR) contained 1 U of Platinum Taq DNA polymerase (Life Technologies
do Brasil, Ltda., São Paulo, SP, Brazil), 200 µmol L‑1
of each dNTP, 10 mmol L‑1 Tris‑HCl (pH 8.3),
50 mmol L‑1 KCl, 1.5 mmol L‑1 MgCl
2, 0.5 µmol L‑1 of
each primer, and 10–50 ng of DNA. When automated genotyping was involved, one of the primers was substituted for a fluorophore labeled primer in the same concentration (Table 1). PCR cycling conditions included an initial denaturing step of 94°C for 4 min, followed by 35 cycles of 94°C for 30 s, 50°C for 45 s, 72°C for 1 min, and final extension of 72°C for 1 hour, to ensure homogeneous A‑tailing.
Pesq. agropec. bras., Brasília, v.48, n.8, p.968‑974, ago. 2013 DOI: 10.1590/S0100‑204X2013000800023
the silver staining protocol, PCR products were separated by singleplex electrophoresis in vertical 4 or 5% polyacrylamide gels, depending on the size of the fragments. Electrophoresis was conducted for 1 hour and 30 min at 2,000 V, 60 MA, and 55 W. After electrophoresis, gels were fixed in acetic acid at 10%, dyed with silver nitrate at 0.1%, and developed with sodium carbonate at 3%. Gel images were recorded with a conventional scanner. For the fluorescent capillary protocol, multiplex electrophoresis was conducted on an Applied Biosystems ABI 3100 automated sequencer (Life Technologies do Brasil, Ltda., São Paulo, SP, Brazil) following manufacturer recommendations. Allele sizes were standardized between capillary and gel electrophoresis through screening of a subset of representative samples on the automated sequencer.
Basic statistics and exact tests for Hardy‑Weinberg equilibrium and linkage among loci were performed through Fisher’s exact tests, using Genepop 4.0 (Rousset, 2008), on 100,000 dememorization steps, 1,000 batches, and 10,000 iterations per batch. Significance of multiple tests was adjusted by Bonferroni correction (Rice, 1989). The presence of
null alleles was estimated through Micro‑Checker v2.2.3 (Oosterhout et al., 2006). To check for a signal of population structuring, present or past, among different broodstocks, ten replicate runs were conducted with the model‑based clustering software Structure 2.2 (Pritchard et al., 2000), with 500,000 steps burn‑in period and 100,000 replicates, with the parameter k varying from 1 to 12. For these runs, only four loci, with data available for all nine hatcheries, were used. Results from population structure analysis were adjusted through the analysis of ∆k (Evanno et al., 2005). Membership coefficients among clusters from different runs were averaged with the use of CLUMPP 1.1.2 (Jakobsson & Rosenberg, 2007) and visualized with the Distruct software (Rosenberg, 2004). Wright’s F‑statistic was estimated through Fstat 2.9.3 (Goudet, 1995). Genetic distance among hatcheries was estimated through DA (Nei et al., 1983) using DISPAN
(Ota, 1993). From pairwise DA, a neighbour‑joining
tree was built through PHYLIP (Felsenstein, 1989). Finally, in order to evaluate how broodstock management affects genetic variability within hatcheries, the relatedness (r) among individuals of each broodstock was estimated through MER v3 (Wang, 2002).
Results and Discussion
Analyses of genetic variability in shrimp farming are decisive for efficient germoplasm management and genetic improvement programs. In general, some genetic erosion is expected due to founding effects and inbreeding (Benzie, 2009). In the present study, nine hatcheries were evaluated, which are responsible for at least 50% of the total Brazilian postlarvae production, according to the 2003 census (Rocha et al., 2004). Genotypes were produced for five to ten loci per hatchery (Table 2). Complete genotype tables for all nine hatcheries were produced for loci TUMXLv5.27, TUMXLv5.38, TUMXLv8.32, and Pvan0013. Many departures from Hardy‑Weinberg expected proportions were observed in the produced data. Before Bonferroni correction, 40 out of 58 tests (69%) showed significant departure from Hardy‑Weinberg proportions, at a confidence level of 0.05. After Bonferroni correction was applied, 38% of the tests still showed significant Hardy‑Weinberg disequilibrium. Most of the time, disequilibrium was caused by homozygote excess,
Locus Primer (forward/reverse 5’‑3’ sequence)Marcação bp bpo Ao
Meehan et al. (2003)
TUMXL CAGACCCTAAATCTCCGTGC/ NED 175 160‑184 12 v5.27 TGGAAAGGTCAGAGGTCACG
TUMXL CCTTTATGACTTCCCCCGAC/ 6‑FAM 215 200‑228 13 v5.38 CCGTACAGAAACGGAACGTC
TUMXL CCTCCTGTCCATTCAGCAG/ HEX 244 230‑250 5
v8.2 GGTCAGATATGTATTCGAGTRCGG
TUMXL TTACCGCCTAAGAGCGAATG/ NED 220 216‑228 7
v8.32 TGTCCTTTCGTACCAGTCAAG
TUMXL GATGTACACAACTGTACTTCG/ 6‑FAM 169 174‑180 4 v8.193 GAGATGATAAGAGAACGAAAG
TUMXL GGACTCACACTTCTGGTTC/ HEX 166 134‑166 12 v8.256 GGCTGCACCTTGTAAGTC
Cruz et al. (2002)
Pvan0013 TGCTCTGGTAACGACAAACG/ HEX 282‑284 271‑289 14
AGACCTGTGGCGAAGTGC
Pvan1003 ATATTTCATGCGTTCCGAGG/ NED 145‑149 147‑151 3
GACTATCTCACGCGCCTCTC
Pvan1758 TATGCTCGTTCCCTTTGCTT/ NED 163‑189 172‑195 15
TTGAAGGAAAAGTGTTGGGG
Pvan1815 GATCATTCGCCCCTCTTTTT/ HEX 126‑141 110‑138 18
ATCTACGGTTCGAGAGCAGA
(1)bp, size range in base pairs, according to the original reference; bpo,
observed size range, in base pairs; Ao, number of alleles observed in the present study.
Table 1. Primer sets used. 6‑FAM, HEX, and NED
indicate the flourophore labels used in the case of capillary
as indicated by average FIS values above 0.20 for all hatcheries (Table 2). No significant linkage disequilibrium was found at the 0.05 level, after Bonferroni correction, when comparing all loci in each population as well as across all populations.
The presence of null alleles was indicated by homozygote excess in many instances, but no consistent pattern was observed for any particular locus. Null alleles have been reported for penaeid microsatellite loci (Ball & Chapman, 2003) and may be common for the studied markers (Cruz et al., 2002; Meehan et al., 2003). However, previous analysis performed on wild population samples indicates that the effects of null alleles for some of these markers could be negligible (Valles‑Jimenez et al., 2005). In addition to that, the estimates of null alleles by Micro‑Checker v2.2.3 are mostly based on the assumption of Hardy‑Weinberg equilibrium (Oosterhout et al., 2006), which cannot be immediately assumed for commercial breeding stocks. Considering the number of assumptions involved in adjusting the allele frequencies to account for null alleles, the following analysis used the observed allele frequencies as basic data.
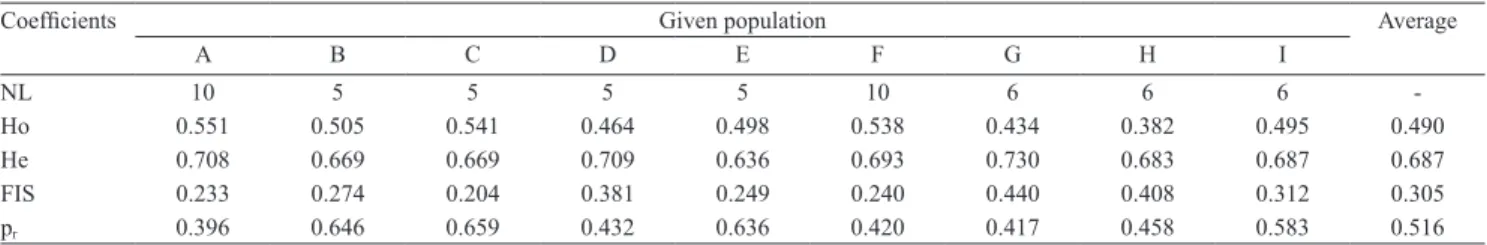
Average observed and estimated heterozygosities among the surveyed hatcheries were, respectively, 49 and 69% (Table 2). Inbreeding, estimated through Wright’s FIS, ranged from 0.204 to 0.440. These values indicate that even with a considerable amount of inbreeding, a high genetic variability remains among the studied broodstocks. The relatedness estimate among the sampled hatcheries suggests that more than 50% of the sampled individuals may be half‑siblings or closer. This observation seems to agree with the limited inbreeding scenario indicated by the inbreeding coefficient FIS. Variation among cultured stocks is, in general, reported to be reduced in comparison to that of wild populations (Benzie, 2009). For commercial
penaeid species other than L. vannamei, reported
heterozygosities among natural populations, estimated through microsatellite loci, usually reach over 90% (Tsoi et al., 2007; You et al., 2008). However, average values reported for four populations of native
L. vannamei from Mexico to Panama were 32 and
68%, for observed and expected heterozygosities, respectively (Valles‑Jimenez et al., 2005). The genetic variability reported here for the group of hatcheries surveyed, at this specific point in time, considering the same class of molecular markers, seems to be at a level compatible with that of L. vannamei wild populations.
In the Bayesian search for genetic signal of the original founder stocks, on all ten replicates, the highest posterior probabilities (p=0.998 to p=1.000) were consistently associated with an assumed structure of five original populations (Table 3). However, analysis of ∆k (Evanno et al., 2005) suggests that the true value may be lower (Figure 1). Individual membership coefficients for a five cluster scenario indicate that broodstocks in each laboratory are of highly mixed origin (Figure 2). There are no formal, public access records about L. vannamei
introduction in Brazil; however, the first animals may have been brought from Ecuador as early as 1981 and 1983. Between 1991 and 1997, a number of introductions originated from Ecuador, Panamá, Venezuela, El Salvador, and Mexico, all of them countries with access to natural populations of L. vannamei. The results found in the present study seem to detect the genetic signal of these founder stocks. However, the assignment power to any specific hatchery remains poor, which may indicate a process of intense genetic exchange among hatcheries. The formation of new stocks from a mixture of previously extant ones has already been reported (Francisco & Galleti Junior, 2005). Notwithstanding localized inbreeding, the nine broodstocks surveyed seem to have reached a state of high admixture, possibly
Table 2. Average heterozygosis and inbreeding coefficients among nine commercial Litopenaeus vannamei hatcheries estimated from a panel of microsatellite loci(1).
Coefficients Given population Average
A B C D E F G H I
NL 10 5 5 5 5 10 6 6 6 ‑
Ho 0.551 0.505 0.541 0.464 0.498 0.538 0.434 0.382 0.495 0.490
He 0.708 0.669 0.669 0.709 0.636 0.693 0.730 0.683 0.687 0.687
FIS 0.233 0.274 0.204 0.381 0.249 0.240 0.440 0.408 0.312 0.305
pr 0.396 0.646 0.659 0.432 0.636 0.420 0.417 0.458 0.583 0.516
(1)NL, number of loci screened; Ho, observed heterozygosis; He, expected heterozygosis; FIS, estimate of inbreeding coefficient through Fstat 2.9.3 (Goudet,
Pesq. agropec. bras., Brasília, v.48, n.8, p.968‑974, ago. 2013 DOI: 10.1590/S0100‑204X2013000800023
Table 3. Posterior probabilities for four of the ten replicates
of the Bayesian analysis performed using the model‑based
clustering program Structure 2.2(1).
Number of populations (k)
Rep 1 Rep 2 Rep 3 Rep 4
1 ‑5,525.2 ‑5,525.5 ‑5,525.3 ‑5,524.5 2 ‑5,250.1 ‑5,250.0 ‑5,252.0 ‑5,247.2 3 ‑5,233.8 ‑5,229.6 ‑5,236.8 ‑5,231.1 4 ‑5,181.6 ‑5,186.9 ‑5,166.7 ‑5,174.4 5 ‑5,170.4(2) ‑5,169.4(2) ‑5,160.6(3) ‑5,151.5(2)
6 ‑5,184.7 ‑5,178.4 ‑5,249.0 ‑5,195.5 7 ‑5,227.0 ‑5,198.9 ‑5,184.1 ‑5,216.2 8 ‑5,282.2 ‑5,288.8 ‑5,216.8 ‑5,213.7 9 ‑5,303.3 ‑5,277.5 ‑5,346.1 ‑5,324.3 10 ‑5,341.2 ‑5,329.2 ‑5,424.7 ‑5,302.2 11 ‑5,356.0 ‑5,364.5 ‑5,340.6 ‑5,336.5 12 ‑5,444.2 ‑5,429.6 ‑5,434.2 ‑5,491.5
(1)Rep 1–4, likelihood estimates for replicates 1 to 4. (2)Posterior probability
= 1.000. (3)Posterior probability = 0.998.
Figure 1. Results from ∆k analysis. Likelihood values on the
left axis, and ∆k values on the right axis. Diamonds represent average (±SD) likelihoods over ten replicates; open circles represent resulting ∆k values; and k represents the number
of clusters.
through frequent animal exchange among hatcheries. Even though the signal for the original populations remains detectable, it is very unlikely that the available Brazilian broodstocks maintain any features of these populations. That hypothesis, however, remains to be tested.
The study of genetic differentiation among breeding stocks is highly useful in guiding the formation of new ones. This is particularly important in a situation
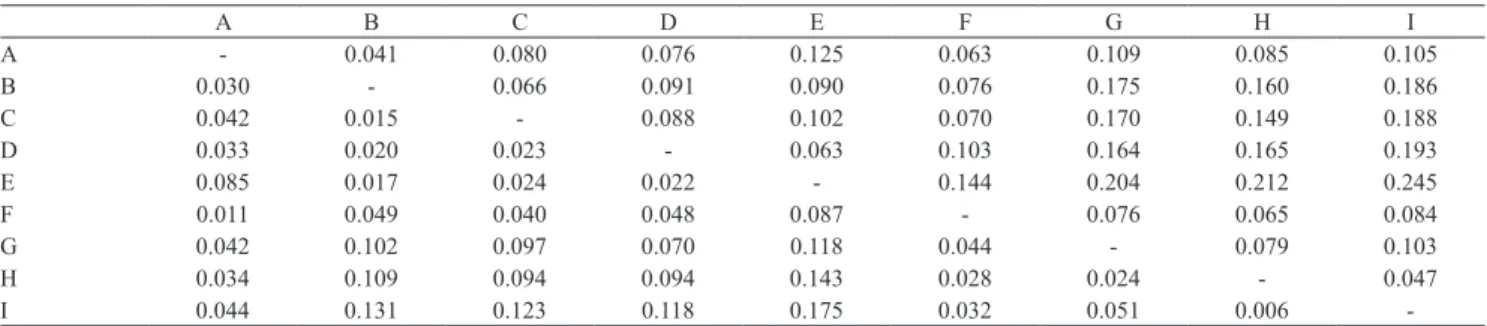
when no free access to wild populations is available. In Brazil, the reduction in genetic variability and significant differentiation among specific lines has already been reported (Freitas & Galetti Junior, 2002; Francisco & Galetti Junior, 2005; Gonçalves et al., 2005; Magalhães et al., 2007). In the present study, the observed genetic differentiation among hatcheries was reflected by FST values ranging from 0.006 to 0.175 (Table 4). The lowest genetic distances were
I H G F A B C D E
Figure 2. Average membership coefficients for a total of 428 individuals, from nine laboratories (A to I), considering five inferred clusters and ten independent runs.
Table 4. Pairwise FST values (below diagonal) and DA genetic distances (above diagonal) among the surveyed hatcheries.
A B C D E F G H I
A ‑ 0.041 0.080 0.076 0.125 0.063 0.109 0.085 0.105
B 0.030 ‑ 0.066 0.091 0.090 0.076 0.175 0.160 0.186
C 0.042 0.015 ‑ 0.088 0.102 0.070 0.170 0.149 0.188
D 0.033 0.020 0.023 ‑ 0.063 0.103 0.164 0.165 0.193
E 0.085 0.017 0.024 0.022 ‑ 0.144 0.204 0.212 0.245
F 0.011 0.049 0.040 0.048 0.087 ‑ 0.076 0.065 0.084
G 0.042 0.102 0.097 0.070 0.118 0.044 ‑ 0.079 0.103
H 0.034 0.109 0.094 0.094 0.143 0.028 0.024 ‑ 0.047
I 0.044 0.131 0.123 0.118 0.175 0.032 0.051 0.006 ‑
1 2 3 4 5 6 7 8 9 10 11 12
-5,500 -5,450 -5,400 -5,350 -5,300 -5,250 -5,200 -5,150
Number of clusters (k)
160
140 120
100
80
60
40
20
0
k
∆
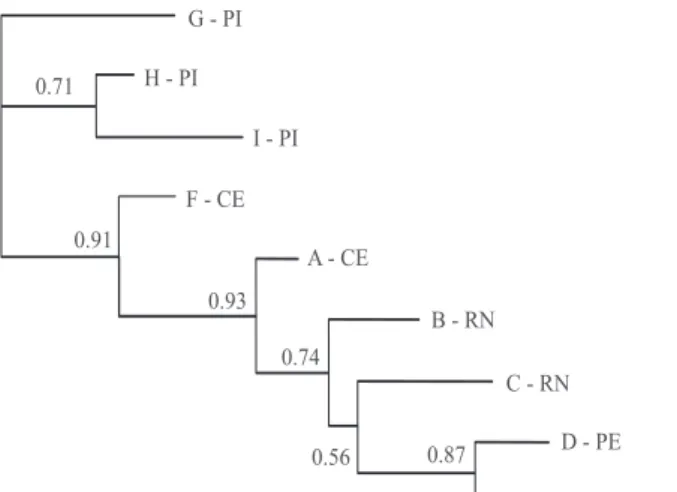
Figure 3. Neighbor‑joining tree based on DA distances
among hatcheries. Numbers correspond to relative support, after 1,000 bootstrap replicates. Laboratory locations are indicated by state abbreviation. PI, Piauí; CE, Ceará; RN, Rio Grande do Norte; PE, Pernambuco.
Conclusions
1. The population genetic analysis based on microsatellite loci is able to detect the genetic signal for a small number of founding populations, consistent with the informal history of the Brazilian broodstocks.
2. The Brazilian commercial broodstocks of
Litopenaeus vannamei shows clear signals of limited inbreeding.
3. The overall L. vannamei genetic variability found among nine of the largest national hatcheries can be considered high.
Acknowledgements
To Financiadora de Estudo e Projetos (Finep), for financial support; to Fundação Cearense de Apoio ao Desenvolvimento Científico e Tecnológico (Funcap), to Fundação de Amparo à Pesquisa do Estado do Piauí (Fapepi), and to Conselho Nacional de Desenvolvimento Científico e Tecnológico (CNPq), for postgraduate and undergraduate student grants; and to Associação Brasileira de Criadores de Camarão (ABCC) and its members, for unrestricted support.
References
BALL, A.O.; CHAPMAN, R.W. Population genetic analysis of white shrimp, Litopenaeus setiferus, using microsatellite genetic
markers. Molecular Ecology, v.12, p.2319‑2330, 2003. DOI:
10.1046/j.1365‑294X.2003.01922.x.
BENZIE, J.A.H. Use and exchange of genetic resources of penaeid shrimps for food and aquaculture. Reviews in Aquaculture, v.1,
p.232‑250, 2009. DOI: 10.1111/j.1753‑5131.2009.01018.x. CRUZ, P.; MEJIA‑RUIZ, C.H.; PEREZ‑ENRIQUEZ, R.; IBARRA, A.M. Isolation and characterization of microsatellites in Pacific white shrimp Penaeus (Litopenaeus) vannamei. Molecular
Ecology Notes, v.2, p.239‑241, 2002.
EVANNO, G.; REGNAUT, S.; GOUDET, J. Detecting the number of clusters of individuals using the software STRUCTURE: a
simulation study. Molecular Ecology, v.14, p.2611‑2620, 2005.
DOI: 10.1111/j.1365‑294X.2005.02553.x.
FELSENSTEIN, J. PHYLIP – Phylogeny Inference Package (Version 3.2). Cladistics, v.5, p.164‑166, 1989.
FOOD AND AGRICULTURE ORGANIZATION OF THE UNITED NATIONS. The state of world fisheries and
aquaculture. Rome: FAO, 2010. 218p.
FRANCISCO, A.K. de; GALETTI JUNIOR, P.M. Genetic
distance between broodstocks of the marine shrimp Litopenaeus vannamei (Decapoda, Penaeidae) by mtDNA analyses. Genetics
and Molecular Biology, v.28, p.258‑261, 2005. DOI: 10.1590/
S1415‑47572005000200014. observed among hatcheries A–B and H–I. The general
distribution of genetic distances surprisingly reflects geographical location to some extent (Figure 3), and seems to agree with the broodstock composition indicated by the membership coefficients (Figure 2). However, further considerations in that direction would require more historical detail than was available at the moment of this study.
The Brazilian commercial broodstocks of L. vannamei shows clear signals of limited inbreeding. However, the overall L. vannamei genetic variability found among nine of the largest national hatcheries can be considered high. These findings stress the necessity of adequate management of this valuable genetic resource. Moreover, the results suggest that a genetic improvement program based on the available germoplasm is feasible. Finally, the recent level of global interest in L. vannamei aquaculture
indicates that the creation of a standardized database of molecular markers would be highly useful for the shrimp industry, providing information for localized management, higher level of breeding control and traceability. There are currently no molecular marker standards for the shrimp industry. The creation of such a database would also be relevant for conservation purposes, since L. vannamei has been introduced in many different ecosystems and seems likely to have an impact on natural populations of marine shrimp in the near future.
0.91
0.71 H - PI
G - PI
I - PI
A - CE
B - RN
C - RN
D - PE
E - PE F - CE
0.93
0.74
Pesq. agropec. bras., Brasília, v.48, n.8, p.968‑974, ago. 2013 DOI: 10.1590/S0100‑204X2013000800023
FREITAS, P.D. de; GALETTI JUNIOR, P.M. PCR‑based VNTR core sequence analysis for inferring genetic diversity in the shrimp Litopenaeus vannamei. Genetics and Molecular Biology, v.25,
p.431‑434, 2002. DOI: 10.1590/S1415‑47572002000400012. GESTEIRA, T.C.V.; PAIVA, M.P. Impactos ambientais dos cultivos de camarões marinhos no Nordeste do Brasil. Arquivos
de Ciências do Mar, v.36, p.23‑38, 2003.
GONÇALVES, M.M.; LEMOS, M.V.F.; GALETTI JUNIOR, P.M.; FREITAS, P.D.; FURTADO NETO, M.A.A. Fluorescent amplified fragment length polymorphism (fAFLP) analyses and
genetic diversity in Litopenaeus vannamei (Penaeidae). Genetics
and Molecular Biology, v.28, p.267‑270, 2005. DOI: 10.1590/
S1415‑47572005000200016.
GOUDET, J. FSTAT (Version 1.2): a computer program to calculate F‑statistics. Journal of Heredity, v.86, p.485‑486, 1995.
HANCOCK, J.M. Microsatellites and other simple sequences: genomic context and mutational mechanisms. In: GOLDSTEIN, D.B.; SCHLÖTTERER, C. (Ed.). Microsatellites: evolution and
applications. Oxford: Oxford University, 1999. p.1‑9.
JAKOBSSON, M.; ROSENBERG, N.A. CLUMPP: a cluster
matching and permutation program for dealing with label switching and multimodality in analysis of population structure.
Bioinformatics, v.23, p.1801‑1806, 2007. DOI: 10.1093/
bioinformatics/btm233.
KOLJONEN, M.L.; TÄHTINEN, J.; SÄISÄ, M.; KOSKINIEMI, J.
Maintenance of genetic diversity of Atlantic salmon (Salmo salar) by captive breeding programmes and the geographic distribution of microsatellite variation. Aquaculture, v.212, p.69‑92, 2002. DOI:
10.1016/S0044‑8486(01)00808‑0.
MAGALHÃES, M.; MARTINEZ, R.A.; GAIOTTO, F.A. Diversidade genética de Litopenaeus vannamei cultivado na Bahia.
Pesquisa Agropecuária Brasileira, v.42, p.1131‑1136, 2007.
DOI: 10.1590/S0100‑204X2007000800009.
MEEHAN, D.; XU, Z.; ZUNIGA, G.; ALCIVAR‑WARREN, A. 2003. High frequency and large number of polymorphic microsatellites in cultured shrimp, Penaeus (Litopenaeus)
vannamei [Crustacea: Decapoda]. Marine Biotechnology, v.5,
p.311‑330, 2003. DOI: 10.1007/s10126‑002‑0092‑z.
NEI, M.; TAJIMA, F.; TATENO, Y. Accuracy of estimated
phylogenetic trees from molecular data. Journal of Molecular
Evolution, v.19, p.153‑170, 1983. DOI: 10.1007/BF02300753.
NUNES, A.J.P.; MARTINS, P.C.; GESTEIRA, T.C.V.
Carcinicultura ameaçada. Panorama da Aquicultura, v.14,
p.37‑57, 2004.
OOSTERHOUT, C. van; WEETMAN, D.; HUTCHINSON, W.F. Estimation and adjustment of microsatellite null alleles in nonequilibrium populations. Molecular Ecology Notes, v.6,
p.255‑256, 2006. DOI: 10.1111/j.1471‑8286.2005.01082.x.
OTA, T. DISPAN: genetic distance and phylogenetic
analysis. University Park: Pennsylvania State University,
1993. Available at: <http://www.softsea.com/download/ DISPAN‑Genetic‑Distance‑and‑Phylogenetic‑Analysis.html>. Accessed on: 23 July 2011.
POULOS, B.T.; TANG, K.F.; PANTOJA, C.R.; BONAMI, J.R.; LIGHTNER, D.V. Purification and characterization of infectious
myonecrosis virus of penaeid shrimp. Journal of General
Virology, v.87, p.987‑996, 2006. DOI: 10.1099/vir.0.81127‑0.
PRITCHARD, J.K.; STEPHENS, M.; DONNELLY, P. Inference
of population structure using multilocus genotype data. Genetics,
v.155, p.945‑959, 2000.
RICE, W.R. Analyzing tables of statistical tests. Evolution, v.43,
p.223‑225, 1989. DOI: 10.2307/2409177.
ROCHA, I.P.; RODRIGUES, J.; AMORIM, L. A carcinicultura brasileira em 2003. Revista da ABCC, v.6, p.30‑36, 2004.
ROSENBERG, N.A. Distruct: a program for the graphical display
of population structure. Molecular Ecology Notes, v.4, p.137‑138,
2004. DOI: 10.1046/j.1471‑8286.2003.00566.x.
ROUSSET, F. GENEPOP’007: a complete re‑implementation of the GENEPOP software for Windows and Linux. Molecular
Ecology Resources, v.8, p.103‑106, 2008. DOI: 10.1111/j.1471‑
8286.2007.01931.x.
SAMBROOK, J.; FRITSCH, E.F.; MANIATIS, T. Molecular
cloning: a laboratory manual. 2nd ed. New York: Cold Spring
Harbor, 1989. 1659p.
SKAALA, O.; HØYHEIM, B.; GLOVER, K.; DAHLE G.
Microsatellite analysis in domesticated and wild Atlantic salmon (Salmo salar L.): allelic diversity and identification of individuals.
Aquaculture, v.240, p.131‑143, 2004. DOI: 10.1016/j.
aquaculture.2004.07.009.
TAUTZ, D.; RENZ, M. Simple sequences are ubiquitous
repetitive components of eukaryotic genomes. Nucleic
Acids Research, v.25, p.4127‑4138, 1984. DOI: 10.1093/
nar/12.10.4127.
TSOI, K.H.; CHAN, T.Y.; CHU, K.H. Molecular population
structure of the kuruma shrimp Penaeus japonicus species complex
in western Pacific. Marine Biology, v.150, p.1345‑1364, 2007.
DOI: 10.1007/s00227‑006‑0426‑x.
VALLES‑JIMENEZ, R.; CRUZ, P.; PEREZ‑ENRIQUEZ, R. Population genetic structure of Pacific white shrimp (Litopenaeus vannamei) from Mexico to Panama: microsatellite DNA variation.
Marine Biotechnology, v.6, p.475‑484, 2005. DOI: 10.1007/
s10126‑004‑3138‑6.
WANG, J. An estimator for pairwise relatedness using molecular
markers. Genetics, v.160, p.1203‑1215, 2002.
YOU, E.‑M.; CHIU, T.‑S.; LIU, K.‑F.; TASSANAKAJON, A.; KLINBUNGA, S.; TRIWITAYAKORN, K.; PEÑA, L.D. de la; LI, Y.; YU, H.‑T. Microsatellite and mitochondrial haplotype
diversity reveals population differentiation in the tiger shrimp (Penaeus monodon) in the Indo‑Pacific region. Animal
Genetics, v.39, p.267‑277, 2008. DOI: 10.1111/j.1365‑2052.2
008.01724.x.