Malnutrition in school children in an urban-rural region of the
extreme South of São Paulo city
Desnutrição em escolares em região urbano-rural do extremo sul do município de São Paulo
Marcela Maria Pandolfi1, Fabio Sandrini1, Maurício Rocco de Oliveira1, Jane de Eston Armond1, Ana Cristina Ribeiro
Zöllner1, Yara Juliano1, Patrícia Colombo de Souza1
ABSTRACT
Objective: To evaluate the persistence of nutritional deficit in a sample of schoolchildren. Methods: A cross-sectional study of 1,761 schoolchildren between 6 and 10 years from 3 schools. They were assessed by Z scores of weight for height and height for age, according to the World Health Organization. The variables studied were gender, age, grade and school year. The χ² test was used to relate the nutritional deficit with the variables. Results: Of all children 8.5% were malnourished according to the weight for height Z score, 21.6%, according to height for age. The analysis of the weight for height Z score revealed that 59.7% were male and 40.3% female. The mean age was 8.9 years. As to the Z score of height for age, 53.9% were males and 46.1% females. The risk of malnutrition was higher among boys: 59.7% for the weight for height index and 53.9% for height for age. There was no statistical difference between schools, gender and school year. As to nutritional status, school period (p < 0.0001) and students’ grade (p = 0.0105), we observed statistical significance. Conclusion: Malnutrition still persists among the low-income population and males had a higher percentage of malnutrition. Nutritional evaluation of students is an extremely important tool for understanding the dynamics of child nutrition and development.
Keywords: Protein-energy malnutrition; Nutritional status; Nutritional assessment; Child nutrition
RESUMO
Objetivo: Verificar a persistência do déficit nutricional em amostra de escolares. Métodos: Estudo transversal com 1.761 escolares de 6 a 10 anos provenientes de 3 escolas de ensino fundamental. Foram avaliados pelos escores Z de peso/estatura e estatura/idade, segundo a Organização Mundial da Saúde. As variáveis estudadas foram: gênero, idade, série e período escolar. O teste do χ² relacionou
o déficit nutricional com as variáveis. Resultados: Segundo o escore Z de peso/estatura 8,5% eram desnutridas; 21,6% de acordo com estatura/idade. A análise do escore Z de peso/estatura revelou que 59,7% eram meninos e 40,3% meninas. A média de idade foi de 8,9 anos. Quanto ao escore Z de estatura/idade 53,9% eram do gênero masculino e 46,1% do gênero feminino. O risco de desnutrição foi maior entre os meninos: 59,7% para o índice peso/estatura e 53,9% para o estatura/idade. Não houve diferença estatística na comparação entre as escolas, o gênero e o período escolar. Já entre estado nutricional, período (p < 0,0001) e série dos escolares (p = 0,0105), observamos significância. Conclusão: A desnutrição ainda é persistente entre a população de baixa renda e o gênero masculino apresentou maior prevalência. Pode-se considerar que a avaliação nutricional é uma ferramenta de extrema importância para compreensão da dinâmica nutricional de crianças e seu desenvolvimento.
Descritores: Desnutrição proteico-energética; Estado nutricional; Avaliação nutricional; Nutrição da criança
INTRODUCTION
Childhood malnutrition persists as one of the most important healthcare problems in the current world, due to its magnitude and disastrous consequences for growth, development, and survival of children,
related to about 50% of child mortality world-wide(1).
Concerning this issue it might be said that malnutrition is, without a doubt, a latent problem in the Latin American context that affects primarily the population
under the age of 5 years(2).
Growth is a dynamic and continuous process, one of the best indicators of a child’s health, and it reflects
Study carried out at Universidade de Santo Amaro – UNISA, São Paulo (SP), Brazil.
1 Universidade de Santo Amaro – UNISA, São Paulo (SP), Brazil.
Corresponding author: Patrícia Colombo de Souza – Patrícia Colombo de Souza – Rua Professor Enéas de Siqueira Neto, 340 – Jardim das Imbuias – CEP 04829-030 – São Paulo (SP), Brazil – E-mail: [email protected]
Received on: Jul 15, 2011 – Accepted on: Nov 1, 2011
his/her life conditions in the past and present. When the human being is born, he/she carries a genetic potential for growth which, in order to be reached, will depend on the conditions of life the child is exposed to from conception to adulthood. Growth is influenced by intrinsic (genetic) and extrinsic (environmental) factors, including nutrition, hygiene, and habitation;
these may either retard or accelerate development(3,4).
Nutrition and growth are intrinsically associated, since children do not fulfill their genetic potential for growth if their basic nutritional needs are not met, leading to
stature deficits for their age(5).
The accompaniment of the nutritional situation of children in a country or region is an essential instrument for the assessment of healthcare
conditions of the child population(6). Anthropometric
measures have been used since the 18th century as an
instrument of health evaluation, but it was only less than 40 years ago that they were standardized for the evaluation of the nutritional status of individuals and populations. In this regard, measurements of weight and height are considered highly sensitive for reflecting, particularly during the preschool age, variations in nutritional conditions, and, indirectly, the influence of the social/economic environment. Therefore, anthropometric indices may be considered positive indicators of health, since they enable the assessment of the potential physical development
attained(7).
In Brazil, although nutritional inquiries point to a drop in prevalence of malnutrition over the last 30
years(8), the persistence of infectious and parasitic
diseases, namely those associated with malnutrition, among the top five causes of death and the occurrence of high hospital mortality rates due to malnutrition, suggest that the role of malnutrition is still vital in statistics of morbidity and mortality for those under the
age of 5 years in the country(9-12).
Due to the fact that currently there are fewer severely undernourished children, the importance of the problem has been increasingly minimized to the point of ignoring the existence of the silent epidemic of hidden hunger and malnutrition that is expressed in the number of children with moderate and light starvation,
which are less evident(1).
OBJECTIVE
To evaluate the nutritional status of schoolchildren who attend public schools in the region of Parelheiros, in the southern part of the municipality of São Paulo, in order to detect nutritional alterations as well as associations with gender, grade, level in school, and school period.
METHODS
This was a cross-sectional study, part of a joint project
with the Secretaria Municipal de Saúde e Educação do
Município de São Paulo carried out during the months of September to October, 2009, with the objective of investigating the nutritional conditions of children aged 6 to10 years, in a region of urban and rural characteristics, high fecundity rate and urban violence, low human development, social and economic indexes. The data presented here refer to the group of
children from three elementary I schools (Escola
Municipal de Ensino Funda mental Manuel Vieira de Queiroz Filho, Escola Municipal de Ensino Fundamental Pedro Geraldo Shunck, and Escola Munici pal de Ensino Fundamental Vargem Grande), totalizing 2,173 children. The study included 1,761 children, corresponding to 81% of the entire sample. The 19% loss occurred because of absences on the day of the evaluation.
It is interesting that in one of the schools (Escola
Municipal de Ensino Fundamental Pedro Geraldo Schunck) there were only two class periods (7 a.m. to 11 a.m. and 3 p.m. to 7 p.m.), whereas the other schools had three (7 a.m. to 11 a.m., 11 a.m. to 3 p.m. and 3 p.m. to 7 p.m.), a fact taken into consideration in the results.
Measurements of weight and height were obtained from each child according to the World Organization
of Health (WHO) international protocol(13). They were
taken by students of the School of Medicine of Santo Amaro (UNISA), who had been duly trained as to standardization of the techniques.
The anthropometric equipment consisted of a
Filizola® platform scale with a capacity for 150 kg and
precision of 100 g. The children were weighed without shoes and wearing light clothing. To measure height, a portable stadiometer with maximal extension of 2m was used.
Height over age (H/A) and weight over height (W/H) were the anthropometric indicators used. The nutritional state was assessed based on the calculation of the Z scores described above for the means and standard deviation of the reference
population of the WHO(14). To classify malnutrition,
the following cut-off points were used. For H/A: ≥ -2
as risk of malnutrition, and < -2 Z scores and ≥ -3
Z scores as malnutrition. For the W/H index, cut-off
points were: ≥ -3 Z score and < -2 Z scores for risk
in school, and class period (7 a.m. to 11 a.m., 11 a.m. to 3 p.m., and 3 p.m. to 7 p.m.).
The databank was analyzed with the Epi-Info
program and Epinut(15). The χ² test was used with a
significance level of 0.05 to evaluate the nutritional
state and the variables studied(16).
As per Resolution 196/96 of the Ministry of Health, several days before the research was conducted, an information flyer and request for authorization for child participation in the study from the parents or persons responsible were sent to the homes.
The study was approved by the Ethics Committee of the University of Santo Amaro, with Protocol # 040/2006.
A 19%-rate of absenteeism among the children and the lack of one class period in one of the schools studied were taken into consideration as possible limiting factors of the study.
RESULTS
Of the 1,761 children studied, 149 (8.5%) were undernourished, according to the Z score of W/H, and 380 (21.6%) according to the Z score of H/A.
Analysis of the Z score of W/H showed that 59.7% were males and 40.3% were females. The age mean was 8.9 years, with a minimum of 6.9 years and a maximum of 10.3 years.
Analysis of the Z score of H/A showed that 53.9% were males and 46.1% were females. The mean age was 9.4 years, with a minimum of 6.8 years and a maximum of 10.2 years.
Table 1 reveals the prevalence of 83.9% of children at risk of malnutrition, as per the W/H Z score, with no statistical difference among the schools studied. Comparing the nutritional status of the child with gender, 59.7% of the children at risk are of the male gender. As to grade in school and class period, there was not statistically significant difference.
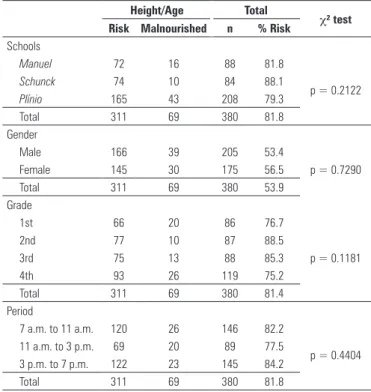
Considering the H/A Z score, table 2 shows the prevalence of 81.8% of children at risk of malnutrition, with no statistical difference among the schools studied. Comparing the nutritional status of the children with gender, 53.9% of the children at risk were males. As to school grade and class period, there was no statistically significant difference.
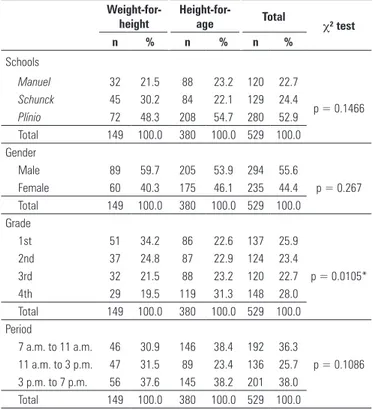
Analyzing the nutritional condition relative to Z scores of W/H and H/A (Table 3), we found no statistically significant difference in the comparison among the schools, genders, and class period. On the other hand, in the relationship between the nutritional status and school grade there was statistical significance (p = 0.0105) in this association.
Table 4 shows the association between malnutrition and the class period. There is a statistically significant difference between the 11 a.m. to 3 p.m. period (p < 0.0001) for
Weight/Height Total
χ² test
Risk Malnourished n % Risk
Schools
Manuel 29 3 32 90.7
p = 0.4516
Schunck 36 9 45 80.0
Plínio 60 12 72 83.3
Total 125 24 149 83.9
Gender
Male 73 16 89 58.4
p = 0.5967
Female 52 8 60 66.7
Total 125 24 149 59.7
Grade
1st 46 5 51 90,2
p = 0.3575
2nd 29 8 37 78,4
3rd 25 7 32 78,2
4th 25 4 29 86,2
Total 125 24 149 83,9
Period
7 a.m. to 11 a.m. 40 6 46 86.9
p = 0.1782
11 a.m. to 3 p.m. 42 5 47 89.4
3 p.m. to 7 p.m. 43 13 56 76.8
Total 125 24 149 83.9
Table 1. Children at risk of malnutrition and malnourished per weight-for-height, enrolled in three municipal primary schools in the Parelheiros region, per gender, grade and period of study
Height/Age Total
χ² test
Risk Malnourished n % Risk
Schools
Manuel 72 16 88 81.8
p = 0.2122
Schunck 74 10 84 88.1
Plínio 165 43 208 79.3
Total 311 69 380 81.8
Gender
Male 166 39 205 53.4
p = 0.7290
Female 145 30 175 56.5
Total 311 69 380 53.9
Grade
1st 66 20 86 76.7
p = 0.1181
2nd 77 10 87 88.5
3rd 75 13 88 85.3
4th 93 26 119 75.2
Total 311 69 380 81.4
Period
7 a.m. to 11 a.m. 120 26 146 82.2
p = 0.4404
11 a.m. to 3 p.m. 69 20 89 77.5
3 p.m. to 7 p.m. 122 23 145 84.2
Total 311 69 380 81.8
Table 2. Children at risk of malnutrition and malnourished per height-for-age, enrolled in three municipal primary schools in the Parelheiros region, per gender, grade and period of study
Manuel = Escola Municipal de Ensino Fundamental Manuel Vieira de Queiroz Filho; Shunck = Escola Municipal de
Ensino Fundamental Padre Geraldo Schunck; Plínio = Escola Municipal de Ensino Fundamental Vargem Grande
Manuel = Escola Municipal de Ensino Fundamental Manuel Vieira de Queiroz Filho; Shunck = Escola Municipal de
Grade
Period P/E
Total 7 a.m. to 11 a.m. 11 a.m. to 3 p.m. 3 p.m. to 7 p.m.
n % n % n % n %
1st 10 21.7 31 66.0* 10 17.8 51 34.2
2nd 10 21.7 7 14.9 20 35.7 37 24.8
3rd 4 8.7 9 19.1 19 33.9 32 21.5
4th 22 47.9 0 0 7 12.5 29 19.5
Total 46 100 47 100 56 100 149 100.0
Grade
Period E/I
Total 7 a.m. to 11 a.m. 11 a.m. to 3 p.m. 3 p.m. to 7 p.m.
n % n % n % n %
1st 25 17.8 39 43.8 22 15.2 86 22.6
2nd 14 9.6 9 10.2 64 44.1 87 22.9
3rd 8 5.5 40 44.9 40 27.6 88 23.2
4th 99 67.1** 1 1.12 19 13.1 119 31.3
Total 146 100 89 100 145 100 380 100.0
Table 4. Malnourished children per weight-for-height and height-for-age per grade and period of study
* Calculated χ² test = 62.24; p < 0.0001 ** Calculated χ² test = 209.73; p < 0.0001
children with a nutritional deficit, as per the W/H index, and the 7 a.m. to 11 a.m. period (p < 0.0001) for children with nutritional deficits, as the H/A index.
DISCUSSION
Despite the improvement of nutritional conditions of children in Brazil, malnutrition has occurred in a very
unequal manner, and the problem is even more serious in the poorest regions of the country, and in the pockets
of poverty within the large cities(17).
In developing countries, it is estimated that the prevalence of malnutrition in children aged up to 60 months is 8% for weight-for-height, 32% for height/age,
and 27% for weight-for-age(18).
A study carried out by Burlandy(19) with school
children between 7 and 10 years of age identified a total of 13.2% who presented with malnutrition seen by height deficit (13.8 and 12.5% of the boys and girls, respectively). The highest prevalence occurred, as expected, in the rural Northeast (21.9%), and the lowest, in the rural Southeast (8.4%). Prevalence in the rural area is still superior to that of the urban area. Malnutrition with a weight deficit was low, and it can be said that in truth there apparently was no malnutrition, since the values of Z < -2 are close to what is expected for a healthy population (approximately 2.5%).
In the states of Ceará, Paraíba, and Piauí state-wide surveys were conducted for height relative to age. In the state of Paraíba, the prevalence to the entire state was 14.5%, with a height deficit of 17.86% in the rural area
and 11.87% in the urban area(20).
The prevalence of the risk of malnutrition and malnutrition in this study was relatively high. As to the association between gender and malnutrition, there was a predominance in the male gender, although without statistical significance, with is in agreement with the results presented in other investigations.
Specifically related to the age bracket of the schoolchildren, nation-wide analyses on the nutritional status of this segment are scarce. Studies this size normally focus on the situation of children under the age of 5 years or schoolchildren from specific regions/ cities of the country. For example, a representative sample of schoolchildren of the municipality of Rio de
Janeiro, Anjos et al.(21) found very low prevalence rates
of malnutrition reflected in height deficit (1.9 and 2.8% for girls and boys up to ten years of age, respectively). Analysis of data from the National Research on Health and Nutrition indicated a 12.9% percentage of malnutrition with height deficit in Brazilian children aged 6 to 10 years, and the highest prevalence rates
were found in the Northeast and North regions(22).
The cutoff point recommended internationally for classifying a child as undernourished (Z-score under 2 standard deviations, compared to the mean national
reference value)(23) has been used in population studies,
identifying prevalence and tendencies of moderate to severe malnutrition.
In Brazil, between 1975 and 1989, as a result of economic gains and of the great expansion of healthcare
Weight-for-height
Height-for-age Total χ² test
n % n % n %
Schools
Manuel 32 21.5 88 23.2 120 22.7
p = 0.1466
Schunck 45 30.2 84 22.1 129 24.4
Plínio 72 48.3 208 54.7 280 52.9
Total 149 100.0 380 100.0 529 100.0
Gender
Male 89 59.7 205 53.9 294 55.6
p = 0.267
Female 60 40.3 175 46.1 235 44.4
Total 149 100.0 380 100.0 529 100.0
Grade
1st 51 34.2 86 22.6 137 25.9
p = 0.0105*
2nd 37 24.8 87 22.9 124 23.4
3rd 32 21.5 88 23.2 120 22.7
4th 29 19.5 119 31.3 148 28.0
Total 149 100.0 380 100.0 529 100.0
Period
7 a.m. to 11 a.m. 46 30.9 146 38.4 192 36.3
p = 0.1086
11 a.m. to 3 p.m. 47 31.5 89 23.4 136 25.7
3 p.m. to 7 p.m. 56 37.6 145 38.2 201 38.0
Total 149 100.0 380 100.0 529 100.0
Table 3. Malnourished children per weight-for-height and height-for-age, enrolled in three municipal primary schools in the Parelheiros region, per gender, grade and period of study
programs, the prevalence of child malnutrition was reduced by about 60%, representing more than 1 million children. However, the most common form of malnutrition, the height deficit relative to age, is concentrated in the poorest regions of the country,
showing that the problem is not totally controlled(1,2).
It is estimated that 38.1% of children under the age of 5 years who live in developing countries suffer severe growth compromise (stunting) and that 9.0% present with
extreme thinness (wasting).These conditions are associated
with other signs of damage, an increase in incidence and severity of infectious diseases, increased rates of child mortality, psychomotor development retardation, difficulties in school performance, and decreased height
and productive capacity in adult life(24,25).
Grave malnutrition may leave two important sequelae: one related to height, and the other to mental development. Height may develop if the child does not experience recurring infections and receives an adequate diet, but mental development alterations may be serious and permanent; depending on the degree of malnutrition, these lesions are responsible for neurological and psychomotor development delays in children, although this retardation may be recovered if the child receives an adequate diet and is in a stimulating
sociocultural environment(26).
As to the child’s school grade, the fourth grade has the children with the highest school age and displays the worst results as to malnutrition, as per the H/A Z-score. As to malnutrition according to the W/H Z-score, the first grade was the most affected, and this difference was statistically significant. This shows that there is still a large percentage of school-aged children with stature deficits incorrigible by treatments.
The intermediate class period (11 a.m. to 3 p.m.) was created by the Prefecture of São Paulo in the 1970s to serve high demand areas where there were no vacancies in the morning and afternoon classes. For this reason, the third class period was squeezed in between the other two, with a class load limited to 4 daily hours imposed by law.
This temporary solution continues until today(27).
When analyzing the class period of the children in the study, we noted that the 11 a.m. to 3 p.m. period was statistically significant for children with nutritional deficits as per the W/H index, and the 7 a.m. to 1 a.m. period for the children with nutritional deficits as per the H/A index. Since this period coincides with the lunch hour, it is called the “hunger period”, a fact that can hinder school performance and meal times. This can have repercussions in the child’s nutritional status, in this case, primarily for acute malnutrition, due to the inadequate timing of the meal.
The nutritional evaluation of children by means of nutritional monitoring using repeated collections of
anthropometric data allows orientation for planning, executing, and evaluation healthcare programs in a
given population(4,28,29).
Due to the fact that the nutritional status increases the development of diseases and interferes in a child’s growth and development, early nutritional evaluations are necessary in the child population, which can reveal the magnitude of the current deficiency and the determining factors for
the occurrence of damage(30).
CONCLUSION
Malnutrition is still persistent among the low-income population, the irreparable form of nutritional deficit is greater in absolute numbers, and males presented with the higher percentage of cases. Based on the analysis made in the Parelheiros region, one can consider that the nutritional assessment of school children – especially the performance of the anthropometric technique – is an extremely important tool for understanding the nutritional dynamics of children and their development, thus helping to formulate healthcare policies and more effective actions to eradicate this problem persistent for so long in the history of healthcare in Brazil. We suggest the continuity of this work in other regions of the municipality.
REFERENCES
1. Monte CM. Desnutrição: um desafio secular à nutrição infantil. J Pediatr (Rio J). 2000;76(Suppl 3):285-97.
2. Martins IS, Marinho SP, Oliveira DC, Araújo EA. Pobreza, desnutrição e obesidade: inter-relação de estados nutricionais de indivíduos de uma mesma família. Cienc Saúde Coletiva. 2007;12(6):1553-64.
3. Romani SA, de Lira PI. Fatores determinantes do crescimento infantil. Rev. Bras. Saúde Mater Infant. 2004;4(1):15-23.
4. Neves OM, Brasil ALD, Brasil LM, Taddei JA. Antropometria de escolares ao ingresso no ensino fundamental na cidade de Belém, Pará, 2001. Rev Bras Saúde Matern Infant. 2006;6(1):39-46.
5. Sichieri R, Taddei JA, Everhart JE. Influence of parental height and sociodemographic factors on adolescent height in Brazil. J Adolesc Health. 2000;26(6):414-9.
6. Silva KS, Lopes AS, Silva FM. Sensibilidade e especificidade de diferentes critérios de classificação do excesso de peso em escolares de João Pessoa, Paraíba, Brasil. Rev Nutr. 2010;23(1):27-35.
7. Fernandes IT, Gallo PR, Advíncula AO. Avaliação antropométrica de pré-escolares do município de Mogi-Guaçú, São Paulo: subsídio para políticas públicas de saúde. Rev Bras Saúde Matern Infant. 2006;6(2):217-22. 8. Monteiro CA. A dimensão da pobreza, da desnutrição e da fome no Brasil. Est.
Avançado. 2003;17(1):7-20.
9. Victora CG, César JA. Saúde materno-infantil no Brasil: padrões de morbimortalidade e possíveis intervenções. In: Rouquayrol MZ, Almeida Filho N. Epidemiologia e saúde. Rio de Janeiro: Medsi; 2003. p. 415-68. 10. Falbo AR, Alves JG. Desnutrição grave: alguns aspectos clínicos e
11. Monteiro CA, Benicio MH, Konno SC, Silva AC, Lima AL, Conde WL. Causes for the decline in child under-nutrition in Brazil, 1996-2007. Rev Saúde Pública. 2009;43(1):1-8.
12. Lima AL, Silva AC, Konno SC, Conde WL, Benicio MH, Monteiro CA. Causas do declínio acelerado da desnutrição infantil no Nordeste do Brasil (1986-1996-2006). Rev Saúde Pública. 2010;44(1):17-27.
13. Organización Mundial de la Salud. El estado físico: uso e interpretación de la antropometría: informe de um Comité de Expertos de la OMS. Ginebra; OMS; 1995. (Serie de Informes Técnicos, 854).
14. de Onis M, Garza C, Victora CG, Maharaj K, Bhan MK, Norum KR.The WHO multicentre growth reference study (MGRS): Rationale, planning, and implementation. Food Nutr Bull. 2004:25(1 Suppl. 1):S1- S45.
15. Dean AG, Dean JA, Coulombier D, Brendel KA, Smith DC, Burton HA, et al. Epi Info, version 6.04: a word processing database and statistics program for a epidemiology on microcomputers. Atlanta: Centers for Disease Control and Prevention; 1996.
16. Siegel S, Castellan NJ Jr. Estatística não paramétrica para ciências do comportamento. 2a ed. Artmed. Porto Alegre. 2006.
17. Santos RB, Martins PA, Sawaya AL. Estado nutricional, condições socioeconômicas, ambientais e de saúde de crianças morados em cortiços e favela. Rev Nutr. 2008;21(6):671-81.
18. Goulart RM, Junior IF, Souza MF. Recuperação nutricional de crianças desnutridas e em risco nutricional em programa de suplementação alimentar no Município de Mogi das Cruzes, São Paulo, Brasil. Cad Saúde Pública. 2007;23(1):147-56.
19. Burlandy L, Anjos LA. Acesso à alimentação escolar e estado nutricional de escolares no Nordeste e Sudeste do Brasil, 1997. Cad Saúde Pública. 2007;23(5):1217-26.
20. Carvalho AT, Costa MJ, Ferreira LO, Batista Filho M. Cartografia do retardo estatural em escolares do Estado da Paraíba, Brasil. Rev Saúde Pública. 2000;34(1):3-8.
21. Anjos LA, Castro IR, Engstrom EM, Azevedo AMF. Crescimento e estado nutricional em amostra probabilística de escolares no Município do Rio de Janeiro, 1999. Cad Saúde Pública. 2003;19 Suppl 1:S171-9.
22. Engstrom EM, Anjos LA. Déficit estatural nas crianças brasileiras: relações com condições sócio-ambientais e estado nutricional materno. Cad Saúde Pública. 1999;15(3):559-67.
23. Blössner M, Onis M. Malnutrition: quantifying the health impact at national and local levels. Geneve: WHO; 2005. (Environmental Burden of Disease Series, nº 12).
24. Monteiro CA, Conde WL. Tendência secular da desnutrição e da obesidade na infância na cidade de São Paulo (1974-1996). Rev Saúde Pública. 2000; 34(6 Supl):52-61.
25. Ministério da Saúde. Sistema de Vigilância Alimentar e Nutricional (SISVAN): Orientações básicas para coleta, processamento, análise de dados e informação em serviços de saúde. Brasília: Ministério da Saúde. 2008. 26. Muradas MR, Carvalho SD. Fatores que influenciam a desnutrição infantil em
um centro de saúde do município de Campinas (SP). Cienc Cuid Saúde. 2008; 7(1):53-8.
27. Ministério do Planejamento, Orçamento e Gestão. O turno da fome. Porta ClippingMP de 08/01/2010. [Internet] [citado 2010 Mar 1] Disponível em: https://conteudoclippingmp.planejamento.gov.br.
28. Martino HS, Ferreira AC, Pereira CN, Silva RR. Avaliação antropométrica e análise dietética de pré-escolares em centros educacionais municipais no Sul de Minas Gerais. Cienc Saúde Coletiva. 2010;15(2):551-558.
29. Tuma RC, Costa TH, Schmitz BA. Avaliação antropométrica e dietética de pré-escolares em três creches de Brasília, Distrito Federal. Rev Bras Saúde Matern Infant. 2005;5(4):419-28.