http://dx.doi.org/10.1590/S1982-21702015000300048
Bol. Ciênc. Geod., sec. Artigos, Curitiba, v. 21, no 4, p.814-831, out-dez, 2015.
Article
ATMOSPHERIC EFFECTS ON RTK NETWORK IN FLORIDA
Efeitos Atmosféricos na Rede RTK na Flórida
M. Berber1
N. Arslan2
1Department of Civil and Geomatics Engineering, California State University, Fresno, CA, USA 2Department of Geomatics Engineering, Cukurova University, Ceyhan, Adana, Turkey
Corresponding author: M. Berber, [email protected], (559) 278 2974
Abstract:
Commonly used real time kinematic (RTK) network (RTK Network) techniques, i.e., MAX, I-MAX, FKP and VRS, are tested by taking monthly measurements for a year in Florida. Additionally, RTCM message versions 2 and 3 are used with I-MAX and VRS measurements. The results revealed that mostly, horizontal coordinates vary a few centimeters and generally changes in vertical coordinates are less than two decimeters. In terms of horizontal coordinates, the best results are produced by I-MAX3 method and FKP yielded the worst results. In terms of vertical coordinates, almost all results look alike; however, the best results are produced by VRS3 method. It appears that I-MAX3 performed better than I-MAX2 and VRS3 performed better than VRS2. Yet, MAX did not stand out among other techniques.
Keywords: Master-Auxiliary Concept, Network RTK, RTK corrections, Virtual Reference Station
Resumo:
Bol. Ciênc. Geod., sec. Artigos, Curitiba, v. 21, no 4, p.814-831, out-dez, 2015. Palavras-chave: Correção Master-Auxiliary. RTK em rede, correções RTK, Estação de Referência Virtual.
1. Introduction
Real Time Kinematic (RTK) Global Navigation Satellite Systems (GNSS) technique - specifically, the Global Positioning System (GPS) - came on the market by early 1990s and since then it has been used widely, for instance, in the field of surveying. Nonetheless, in RTK GPS, as the distance between the rover and the reference station increases, the atmospheric conditions at the rover and reference station become increasingly different. This decreases the accuracy and makes it more difficult for the rover to fix the ambiguities. To extend the capabilities of RTK positioning over long distances, Network RTK concept was investigated by Wubbena et al. (1996). An RTK Network is a network of permanent GNSS receivers that continuously stream satellite observations to a central server in which combined data is used to generate RTK corrections for precise positioning use within the coverage area of the reference stations and these network generated RTK corrections are called Network RTK. To minimize the influence of distance dependent errors, Network RTK system performs three things: i) computes Network RTK corrections, ii) interpolates these corrections, and iii) transmits them (Lachapelle and Alves, 2002). For the computations of corrections, Network RTK server makes use of known coordinates of permanent GNSS receivers and fixed carrier phase ambiguities and then computes the corrections for atmospheric and orbital errors. In order to interpolate (or model) the distance-dependent residual biases, several interpolation methods have been proposed over the years. They include the Linear Combination Model (Han and Rizos 1996, Han 1997), the Distance-Based Linear Interpolation Method (Gao and Li 1998), the Linear Interpolation Method (Wanninger 1995), the Low-Order Surface Model (Wubbena et al. 1996, Fotopoulos and Cannon 2001), and the Least Squares Collocation Method (Raquet 1998, van der Marel 1998). The theoretical and numerical comparison of the various interpolation algorithms has been made by Dai et al. (2003), and it is concluded that the performance of all the methods is similar (Rizos 2002). For transmission of Network RTK corrections to users in real time, the commonly used techniques are correction service which utilizes Master-Auxiliary Concept (MAX), Individualized MAX (I-MAX), Area Correction Parameters or more commonly called Flachen Korrektur Parameter (FKP) and Virtual Reference Station (VRS). There are significant differences between these methods and therefore different quality RTK solutions are achieved (see, e.g., Leica 2012a).
In this study, the commonly used RTK Network transmission techniques, i.e., MAX, I-MAX, FKP and VRS, are analyzed in order to assess their performances. To achieve this goal, data collected for a year in Florida, USA, have been used.
2. Observation Equations
Bol. Ciênc. Geod., sec. Artigos, Curitiba, v. 21, no 4, p,814-831, out-dez, 2015.
where f1 is frequency of L1, c is speed of light in a vacuum, t is measurement epoch,
j A,1 t
is
raw phase measurement,
j A t is geometric range,
j A I tis total ionospheric refraction, j A,1 N
is
initial phase ambiguity and 1, is random measurement noise. Similar equations can also be written for other frequencies, for example, L2. Here, a mere summary is given; however, for
detailed information readers are referred to Euler et al. (2001), Keenan et al. (2002), Euler and Zebhauser (2003), Euler et al. (2004), among others.
To expand the observation equations, an ionospheric model and a residual parameter are introduced. Additionally, the parameter for the non-dispersive term will be split into the geometric range, the receiver and satellite clock errors, the broadcast orbit error, and the tropospheric path delay. Thus, the expanded observation equation is given as:
where
j A s% tis geometric range,
j A ˆ I tis modeled ionospheric refraction,
j A I t is residual
ionospheric refraction effect,
j A ˆ T tis modeled tropospheric refraction effect,
j A T t is residual
tropospheric refraction effect, j A
r r
is station (antenna) - satellite vector, rrj,BE is broadcast orbit
error, dtA,1, is total receiver clock error and j 1, dt
is total satellite clock error.
If we use between station single difference (Δ), we can write,
where
j AB s% tis geometric range single difference and
j,BE AB
r
r is broadcast orbit error induced
distance dependent effect on baseline AB.
Bol. Ciênc. Geod., sec. Artigos, Curitiba, v. 21, no 4, p.814-831, out-dez, 2015. where f2 is frequency of L2 and
j
AB,1,RTCM
is double differenced carrier phase correction in which RTCM (Radio Technical Commission for Maritime Services) is the message type used to send the corrections. More explanation on the dispersive and non-dispersive components is provided in the following section.
3. Atmospheric Effects
The aim of RTK Network is to minimize the influence of distance dependent errors on the rover’s computed position. These distance dependent errors are mainly atmospheric errors. Satellite signals while travelling through the atmosphere encounter refraction effects including ray bending and propagation delays. For satellite signal travel, atmosphere is divided into two as ionosphere and troposphere. Tropospheric delay is not frequency dependent, and therefore it cannot be eliminated through linear combinations of L1 and L2 observations as in the case of
ionospheric delay. On the other hand, to achieve high accuracy RTK Network results, atmospheric errors are to be modeled or minimized.
Bol. Ciênc. Geod., sec. Artigos, Curitiba, v. 21, no 4, p,814-831, out-dez, 2015.
4. Application and Results
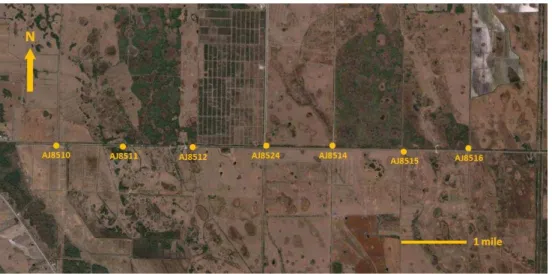
A triple frequency GNSS system (Leica GX1230) is used to collect the measurements. Antenna and receiver are mounted on a fixed-height 2 m range pole. As can be seen in Fig. 1, the measurements are taken at seven National Geodetic Survey (NGS) points along Road 714 in Florida.
Figure 1. Seven NGS points along Road 714 in Martin County, FL, USA (image from Google).
As can be seen in Fig 2, measurements are collected beginning by October 2012 and ending by August 2013. In July 2013, no measurement is taken since it was vacation time. September 2013 measurements could not be made because Florida Permanent Reference Network underwent a complete change over and this network upgrade was not completed until the end of September 2013 and thus no measurement was possible.
Figure 2. The dates in which measurements were collected.
Bol. Ciênc. Geod., sec. Artigos, Curitiba, v. 21, no 4, p.814-831, out-dez, 2015. have many obstructions to block satellite visibility except for a few trees in the distance. Multipath effect was not an issue at all since our points were NGS points in country site. In addition, multipath has to be similar for all techniques at each point.
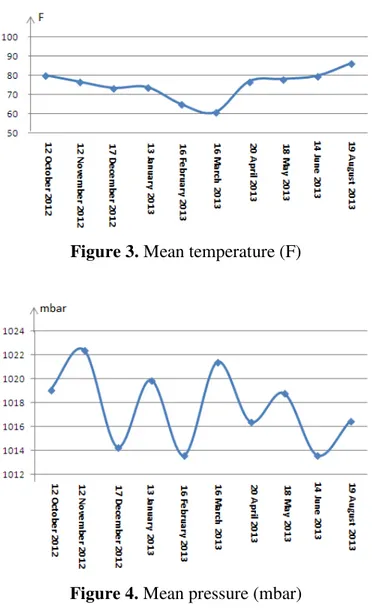
As mentioned already, our project is carried out in Martin County, FL which is in south eastern Florida. Since the southern half of Florida is flat, so is our project area. Tropospheric parameters might vary greatly in undulating areas; however, since our project area is almost completely flat, tropospheric effect on the measurements was considered the same for all the points. On the other hand, since the measurements are taken once a month, monthly changes must be considered. Figs. 3, 4, 5 and 6 show mean temperature, mean pressure, mean relative humidity and precipitation, respectively. This data is obtained from Florida Climate Center.
Figure 3. Mean temperature (F)
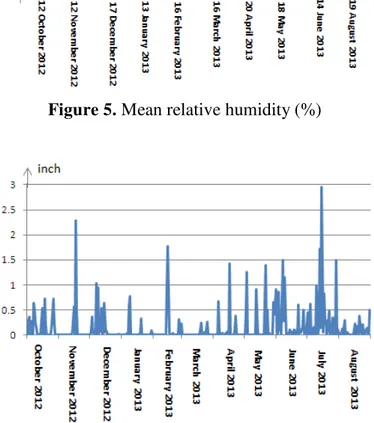
Bol. Ciênc. Geod., sec. Artigos, Curitiba, v. 21, no 4, p,814-831, out-dez, 2015. Figure 5. Mean relative humidity (%)
Figure 6. Precipitation (inch)
As can be seen in Fig. 3, temperature decreases from October to March and from March to August it gradually increases. In Fig. 4, pressure starts high and becomes the highest in November afterward it fluctuates. For summer months, high pressure means warm, sunny days; whereas, for winter months, it means cold, cloudy days. Low pressure is the complete opposite of high pressure. Humidity is the amount of water vapor in the air and relative humidity is the amount of water vapor relative to the total amount that the air can hold. As can be seen in Fig. 5, it is high in December and it is the highest in April. Since south Florida has a tropical climate, precipitation is high during summer months and this is also apparent in Fig. 6.
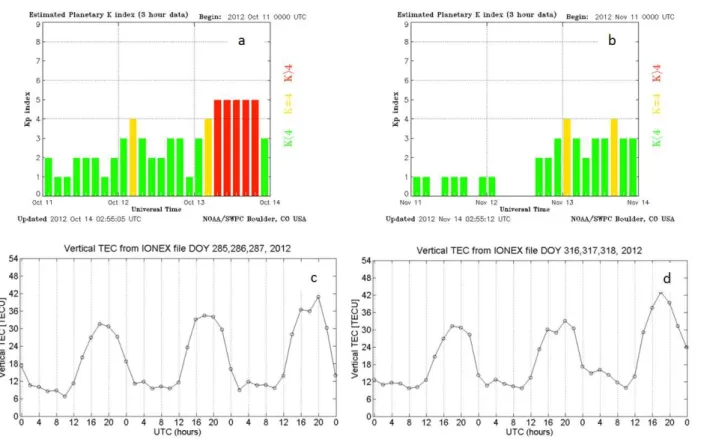
Bol. Ciênc. Geod., sec. Artigos, Curitiba, v. 21, no 4, p.814-831, out-dez, 2015. Figure 7. (a) Kp index values for DOY 285 to 287, 2012 and (b) for DOY 316 to 318, 2012; (c)
VTEC values for DOY 285 to 287, 2012 and (d) for DOY 316 to 318, 2012.
Bol. Ciênc. Geod., sec. Artigos, Curitiba, v. 21, no 4, p,814-831, out-dez, 2015.
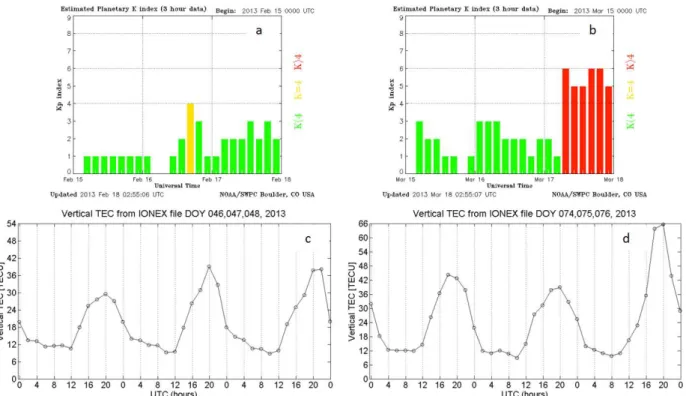
Figure 9. (a) Kp index values for DOY 046 to 048, 2013 and (b) for DOY 074 to 076, 2013; (c) VTEC values for DOY 046 to 048, 2013 and (d) for DOY 074 to 076, 2013.
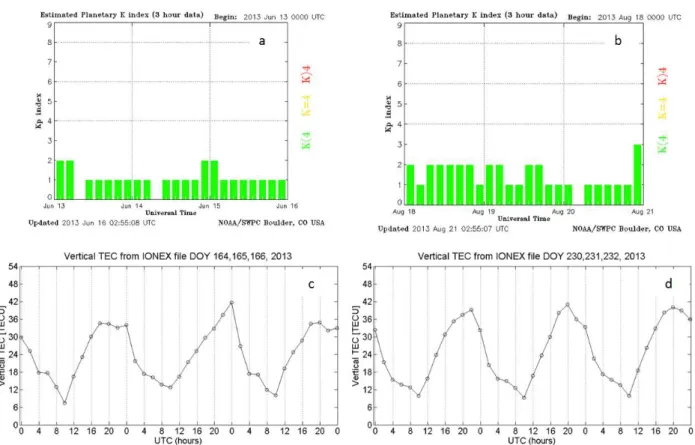
Bol. Ciênc. Geod., sec. Artigos, Curitiba, v. 21, no 4, p.814-831, out-dez, 2015. Figure 11. (a) Kp index values for DOY 164 to 166, 2013 and (b) for DOY 230 to 232, 2013; (c)
VTEC values for DOY 164 to 166, 2013 and (d) for DOY 230 to 232, 2013.
In Fig. 7, Kp values range between 0 and 5. This implies some geomagnetic activity. The minimum VTEC values are around 6 TEC unit (TECU) and maximum values are around 42 TECU. In Fig. 8, Kp values range between 0 and 4 meaning that there is no significance of effects of geomagnetic storms. The minimum VTEC values are about 12 TECU and maximum values are about 30 TECU. As can be seen, VTEC values display regular periodical pattern. In Fig. 9, Kp values range between 0 and 6. This indicates that there is geomagnetic storm related activity. The minimum VTEC values are approximately 12 TECU and maximum values are approximately 66 TECU. As seen in Fig. 9d, when geomagnetic storm occurs, VTEC values rises. In Fig. 10, Kp values range between 0 and 5. As a result, there is some geomagnetic activity is in effect. The minimum VTEC values are roughly 6 TECU and maximum values are roughly 54 TECU. Some days VTEC values exhibit irregular pattern. In Fig. 11, Kp values range between 0 and 3. This suggests quiet geomagnetic activity. The minimum VTEC values are about 6 TECU and maximum values are about 42 TECU.
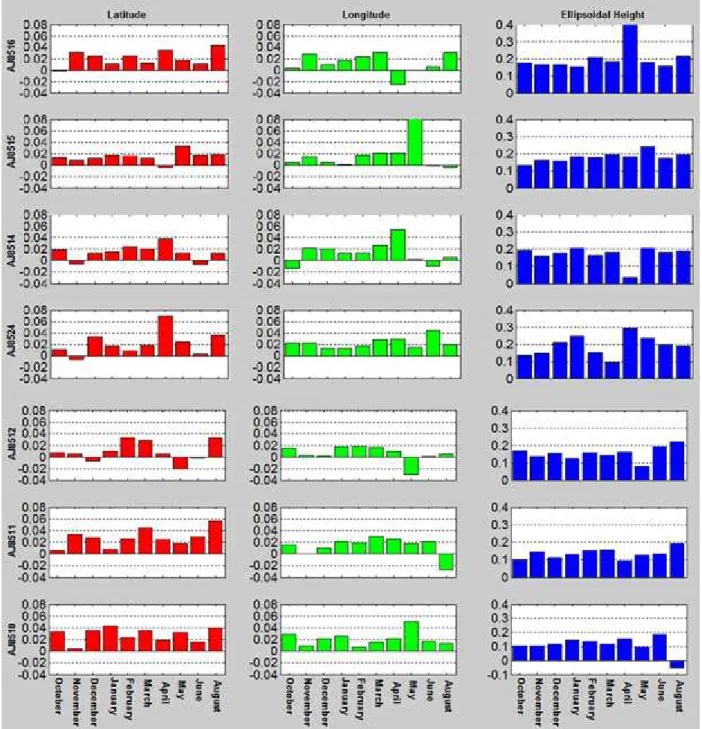
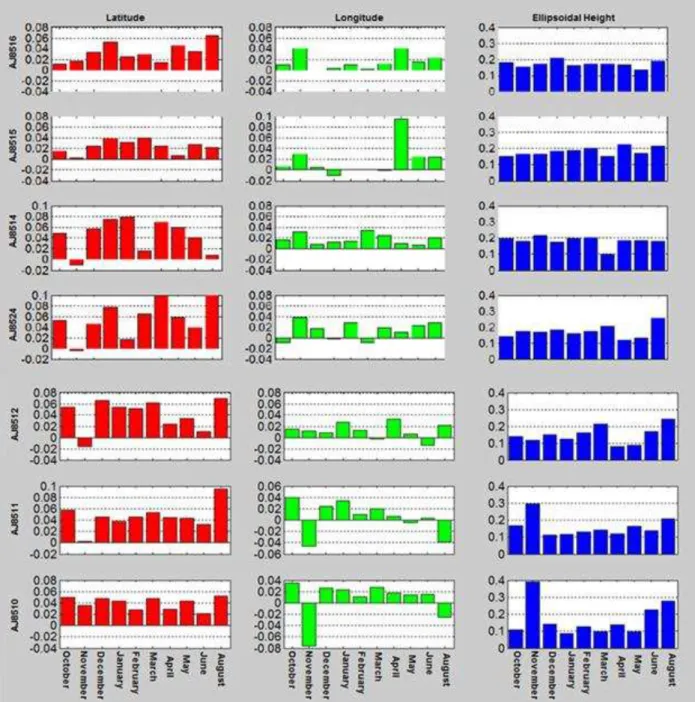
In this study, MAX, I-MAX2, I-MAX3, FKP, VRS2 and VRS3 are considered. The 2 and 3 represent RTCM versions; for example, VRS2 and I-MAX2 mean that these techniques used RTCM version 2 and VRS3 and I-MAX3 used RTCM version 3. RTCM message version 3 was used with MAX and version 2 was used with FKP. For more information about RTCM formats and their effect on the results, see Berber and Arslan (2013).
Bol. Ciênc. Geod., sec. Artigos, Curitiba, v. 21, no 4, p,814-831, out-dez, 2015.
the established datum for Florida Permanent Reference Network system is on NAD83 (Epoch 2002), all the computations are done using this datum.
Bol. Ciênc. Geod., sec. Artigos, Curitiba, v. 21, no 4, p,814-831, out-dez, 2015.
Bol. Ciênc. Geod., sec. Artigos, Curitiba, v. 21, no 4, p,814-831, out-dez, 2015.
Bol. Ciênc. Geod., sec. Artigos, Curitiba, v. 21, no 4, p.814-831, out-dez, 2015. Figure 17. Differences between VRS3 and static survey results at each point.
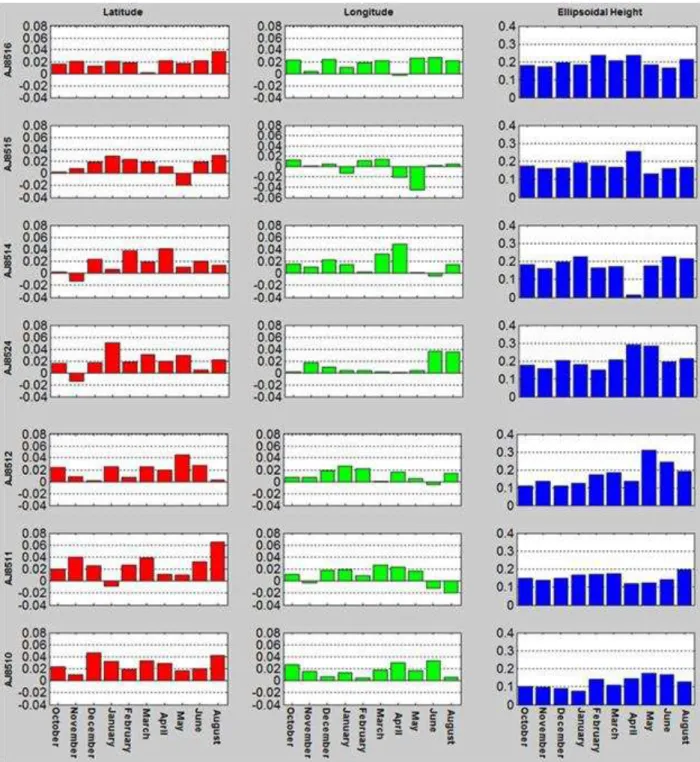
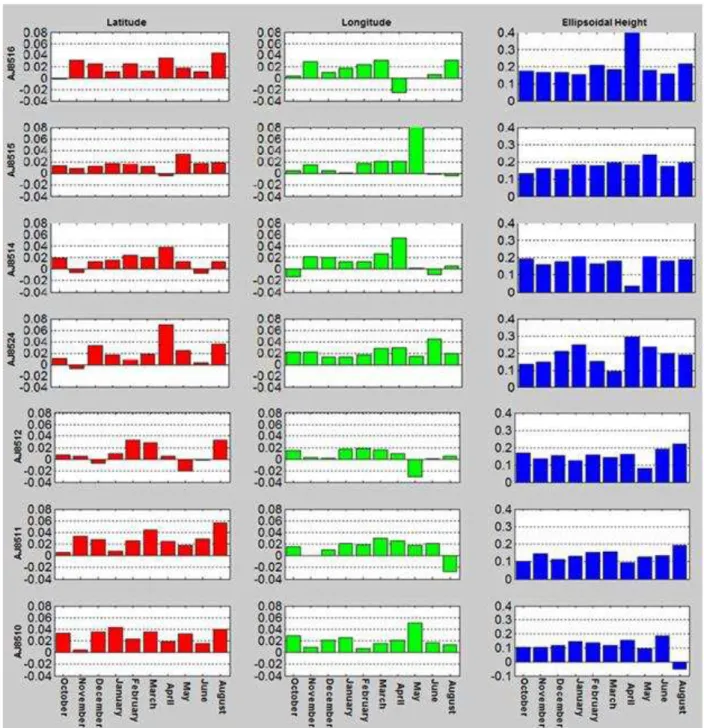
As can be seen in Figs. 3 to 6, throughout the year, temperature is changing, pressure is going up and down, the amount of water vapor in the air is rising and falling and there is more precipitation during summer months. If we look at the Figs. 7 to 11, we see that mostly ionospheric activity remains low; yet, on May 18, 2013 there is considerable geomagnetic activity. Additionally, as seen in vertical TEC graphs, TEC values are varying substantially. In spite of all these shifts in the atmosphere, as shown in Figs. 12-17, changes in horizontal coordinates are most of the time a few centimeters and in vertical coordinates for the most part less than two decimeters. These yearlong results in Figs. 12-17, indicate that Network RTK system in Florida is robust against changes in atmospheric conditions.
Bol. Ciênc. Geod., sec. Artigos, Curitiba, v. 21, no 4, p,814-831, out-dez, 2015.
Table 1. RMSE values at each point for each technique used (m).
5. Conclusions
In this study, to evaluate their performance, four RTK Network corrections, namely, MAX, I-MAX, VRS and FKP were compared by taking monthly measurements at seven sites for a year. Despite changing atmospheric conditions, variations in coordinates were stable throughout the year. This can be ascribed to the good performance of the atmospheric modeling done by the RTK Network software. Most of the time, horizontal coordinates change a few centimeters and for the most part changes in vertical coordinates are less than two decimeters. Source of decimeter level variations in the vertical coordinates can be having only 2 minutes data at a point. In terms of horizontal coordinates, the best results are produced by I-MAX3 method and FKP yielded the worst results. In terms of vertical coordinates, almost all results look alike however the best results are produced by VRS3 method. It appears that I-MAX3 performed better than I-MAX2 and VRS3 performed better than VRS2. This can be attributed to the improvements in RTCM message types. On the contrary to expected MAX method did not stand out among others even though MAX uses more advanced approach by providing rover with full raw observations and coordinate information to allow the rover to calculate an optimized solution by combining network data with its own data. In total, 418 measurements are taken (see Figs. 12-17) and among them there are only 2 outlying observations and this corresponds approximately to 0.5% error which is 10 times better than the accepted error level (significance level α=5%).
REFERENCES
Berber, M., A. Ustun and M. Yetkin, “Comparison of Accuracy of GPS Techniques”,
Measurement 45 (2012), 1742–1746.
Berber, M. and N. Arslan, “Network RTK: A case study in Florida”, Measurement 46 (2013), 2798-2806.
Dai, L., S. Han, J. Wang and C. Rizos, “Comparison of interpolation algorithms in network -based GPS techniques”, Navigation 50 (2003), no. 4, 277-293.
Euler, H. J., R. Keenan, B. Zebhauser and G. Wubbena, “Study of a Simplified Approach in Utilizing Information from Permanent Reference Station Arrays”, Proceedings of ION GPS 2001
Bol. Ciênc. Geod., sec. Artigos, Curitiba, v. 21, no 4, p.814-831, out-dez, 2015. Euler, H. J. and B. Zebhauser, “The Use of Standardized Network RTK Messages in Rover Applications for Surveying”, Proceedings of the 2003 National Technical Meeting of The Institute of Navigation, Anaheim, CA, January 2003, pp. 377-384.
Euler H. J., S. Seeger, O. Zelzer, F. Takac and B. Zebhauser, “Improvement of Positioning Performance Using Standardized Network RTK Messages”, ION NTM January 26-28, 2004, San Diego, California, USA.
Fotopoulos, G. and M. E. Cannon, “An overview of multi-reference station methods for cm-level positioning”, GPS Solutions, 4 (2001), 1-10.
Gao, Y. and Z. Li, “Ionosphere effect and modeling for regional area differential GPS network”,
11th Int. Tech. Meeting of the Satellite Div. of the U.S. Institute of Navigation, Nashville, Tennessee, 15-18 September 1998, 91-97.
Han, S. and C. Rizos, “GPS network design and error mitigation for real-time continuous array monitoring systems”, 9th Int. Tech. Meeting of the Satellite Div. of the U.S. Institute of Navigation, Kansas City, Missouri, 17-20 September 1996, 1827-1836.
Han, S., “Carrier Phase-Based Long-Range GPS Kinematic Positioning”, UNISURV S-49, School of Geomatics Engineering, The University of New South Wales, Sydney, Australia, 1997.
Keenan, R., B. Zebhauser, H. J. Euler and G. Wubbena, “Using the Information from Reference Station Networks: A Novel Approach Conforming to RTCM V2.3 and Future V3.0”, 0 -7803-7251-4/02/$10.00 0 2002 IEEE.
Lachapelle, G. and P. Alves, “Multiple Reference Station Approach: Overview and Current Research”, Journal of Global Positioning Systems, 1 (2002), no. 2, 133-136.
Leica, “RTK Networks –Different Methods”, System 1200 Newsletter, 2012a, no. 53, SmartNet, EU.
Leica, “RTK Networks –A Case Study”, System 1200 Newsletter, 2012b, no. 54, SmartNet, EU. Raquet, J. F., “Development of a Method for Kinematic GPS Carrier-Phase Ambiguity Resolution Using Multiple Reference Receivers”, PhD Thesis, Dept. of Geomatics Engineering,
University of Calgary, Canada, 1998.
Rizos, C., “Network RTK Research and Implementation - A Geodetic Perspective”, Journal of Global Positioning Systems, 1 (2002), no. 2, 144-150.
van der Marel, H., “Virtual GPS reference stations in the Netherlands”, 11th Int. Tech. Meeting of the Satellite Div. of the U.S. Institute of Navigation, Nashville, Tennessee, 15-18 September 1998, 49-58.
Wanninger, L., “Improved ambiguity resolution by regional differential modeling of the ionosphere”, 8th Int. Tech. Meeting of the Satellite Div. of the U.S. Institute of Navigation, San Diego, California, 12-15 September 1995, 55-62.
Wubbena, G., A. Bagge, G. Seeber, V. Böder and P. Hankemeier, “Reducing distance dependent errors for real-time precise DGPS applications by establishing reference station networks”, 9th Int. Tech. Meeting of the Satellite Div. of the U.S. Institute of Navigation, Kansas City, Missouri, 17-20 September 1996, 1845-1852.