Article
Printed in Brazil - ©2013 Sociedade Brasileira de Química0103 - 5053 $6.00+0.00
A
*e-mail: [email protected]
Efficiencies of Acid and Base-Catalyzed Methylation of Vegetable Oils by Ambient
Mass Spectrometry
Oscar O. Santos Júnior,*,a Paula F. Montanher,a Elton G. Bonafé,a Swami A. Maruyama,a
Fabiana Carbonera,a Rosana M. Alberici,b Marcos N. Eberlinb and Jesuí V. Visentainera
aDepartment of Chemistry , State University of Maringá, 87020-900 Maringá-PR, Brazil
bThoMSon Mass Spectrometry Laboratory, Institute of Chemistry,
University of Campinas, 13083-970 Campinas-SP, Brazil
O perfil de ácidos graxos (AG) é um parâmetro importante de qualidade e tipificação para alimentos em geral. Esses perfis funcionam como uma espécie de “impressão digital”, e podem ser úteis para monitorar fraudes e deterioração em diversos tipos de alimentos. Para os óleos vegetais, o perfil de AG é geralmente determinado após hidrólise, metilação e análise por cromatografia gasosa (CG). Neste trabalho, a metilação do óleo de soja por métodos de catálise básica e ácida foi monitorada por CG-DIC e também por espectrometria de massas ambiente com ionização sonic-spray (EASI-MS). Os principais parâmetros monitorados por EASI-MS foram o perfil de AG e a possível geração de hidroperóxidos dos ésteres metílicos, que foram comparados. O método catalisado por base mostrou-se superior em relação aos demais, por ser mais barato, menos tóxico, não originar produtos de oxidação e ter maior rendimento (95,66% m/m contra 92,86% e 94,51% dos métodos catalisados por ácido).
The fatty acids (FA) profile is an important parameter for quality control and typification for foods in general. These profiles work as a sort of “fingerprint”, and may be useful to monitor frauds and deterioration of diverse types of foods. For vegetable oils, the FA profile is commonly determined after hydrolysis, methylation and gas chromatography (GC) analysis. In this work, the acid and base-catalyzed soybean oil methylation methods was monitored via GC-FID and also by ambient sonic-spray ionization mass spectrometry (EASI-MS). The base-catalyzed method is much superior regarding other esterification assays, because it is cheaper, less toxic, no oxidation products are formed and its reaction yield is greater (95.66% m/m against 92.86% and 94.51% from acid-catalyzed methylation methods, respectively).
Keywords: hydroperoxides, soybean oil, acid and base-catalyzed methylation,ambient mass
spectrometry
Introduction
The fatty acids (FA) profile of a food product is an important and characteristic parameter for quality control and typification, working as a kind of “fingerprint” signature. For vegetable oils, these profiles have been used for quality control and to assist in fraud and deterioration monitoring.1
FA are present in food mainly as triacylglycerols (TAG). Therefore, hydrolysis followed by derivatization or a trans-esterification reaction are used to release the free FA and to increase their volatility for quantification
via gas chromatography (GC).2 Among such reactions, trans-esterification with methanol leading to formal methylation of the FA is the most employed, in which TAG react with methanol in the presence of an acid or alkaline catalyst to form fatty acid methyl esters (FAME).3
and uses higher reaction temperatures (100oC), being less effective in terms of total reaction yields.4
GC coupled to flame ionization detector (FID) is the most used method to determine FA profiles, due to its high sensibility (10-12 g) and differential response.5 GC-FID also allows the determination of hydrolysis intermediates such as monoacylglycerols (MAG), diacylglycerols (DAG) as well as residual TAG.6 Recent studies have however indicated that the use of acid catalysts in oil methylation may lead to oxidation of the unsaturated FA to form mainly hydroperoxides,7-9 which escape detection during GC-FID analysis. Therefore, these side-reactions may alter the FA profiles.
In this work, the authors have used GC and tested a direct MS technique to determine the FAME profile after methylation of vegetable oils. The MS technique used was easy ambient sonic-spray ionization mass spectrometry (EASI-MS).10 EASI belongs to a group collectively known as ambient desorption/ionization techniques for mass spectrometry analysis.11 EASI uses no sample preparation steps. For EASI-MS analysis of oils, a single droplet of the sample is placed in a inert surface (a paper sheet for instance), and fast, direct and simple MS analysis is performed under ambient conditions without risks of sample oxidation.11 EASI-MS has been applied with success in the analysis of TAG and their hydroperoxides from vegetable oils and biodiesel.12,13 In the positive ion mode, EASI(+)-MS provides typical profiles of the main components (FAME and residual TAG, DAG and MAG) detected as [M + Na]+ ions.12 The efficient desorption from surfaces as well as the soft sonic-spray ionization leads to detection of molecules in the mixture as a major single ion with relative abundances that reflect the composition of the sample.
In this work the efficiency of methylation of soybean oil, via acid or base-catalysis was monitored via GC and EASI-MS, which was selected due to its ability to provide FAME profiles directly from the undisturbed sample as well as to monitor oxidation and degradation products in real time.
Experimental
Chemical reagents and samples.
High-performance liquid chromatography (HPLC)-grade methanol was purchased from Merck (Rio de Janeiro, Brazil) and used without further purification. Soybean oil was acquired from Cocamar enterprise (Maringá, Brazil) and used in the methylation assay through alkaline catalysis described by the International Organization for Standardization (ISO).14 A mass of 1.0 g of oil was weighed and added with 10 mL of n-heptane and stirred. Next,
0.50 mL of 2 mol L-1 KOH in methanol was added and stirred for 20 s. After phase separation, the supernatant was collected for later gas chromatography analysis. The same soybean oil was also used for methylation assays through acid catalysis described by Hartman and Lago (HAT),15 and Joseph and Ackman (JAC).16
Acid index
Total content of FFA from the oil sample was determined according with Adolfo Lutz Institute method.17
Peroxide index
Peroxide index of the refined and methylated oil samples were determined according to AOCS Cd 8-53 official method.18
Chromatographic analysis
The percentages (m/m %) of TAG, DAG, MAG and total esters were determined using a Thermo TRACE CG Ultra gas chromatograph, equipped with PTV (Programmed Temperature Vaporizing) injector and autosampler. A 5% phenyl fused silica capillary column (10 m × 0.32 mm ID × 0.1 µm film thickness) was connected to an uncoated, deactivated 5 m × 0.53 mm ID fused silica pre-column with a press-tight fitting. The column was maintained at 50 °C for 1 min, followed by a heating rate of 15 °C min-1 until 180 °C. Then, it was once again raised to 230 °C at a rate of 7 °C min-1. Finally, after this period, the column was heated to 370 °C at a rate of 30 °C min-1 and maintained for 8 minutes. The injector was maintained at 600 °C for 1 min, followed by a heating rate of 14.5 °C min-1 until 370 °C, which was maintained for 30 min. Detector was kept at 370 °C. The flow rates for the carrier (H2), auxiliary (N2) and detector flame (H2 and synthetic air) gases were 1.2 mL min-1, 30 mL min-1, 35 mL min-1 and 350 mL min-1, respectively.
(1)
where C (m/m %) is the mass percentage of TAG, DAG or MAG present in the product sample; A is the sum of MAG or DAG or TAG peak areas; Api is the internal standard peak area; Mpi:is the internal standard mass; m is the sample mass (mg); a is MAG or DAG or TAG calibration curve slope and b is MAG or DAG or TAG calibration curve intercept.
FAME content was calculated according using equation 2:19
(2)
where C is FAMEs content (m/m %); A is ester peak area; Asi is the internal standard peak area (methyl tricosanoate); Csi is the concentration (mg mL-1) of the methyl tricosanoate solution which was employed; Vsi is the volume (mL) of the methyl tricosanoate solution which was employed and m is the sample mass (mg).
EASI-MS analysis
EASI-MS was performed in the positive ion mode using a single-quadrupole mass spectrometer (Shimadzu LCMS 2010), equipped with a homemade EASI source, which is described in detail elsewhere.10 The main experimental parameters were as follows: methanol flow rate of 20 µL min-1, N
2 nebulizing gas of 3 L min-1, and paper-entrance angle of ~30o. A tiny droplet of the oil or FAME sample (2 µL) was placed directly onto the paper surface (brown Kraft envelope paper), and mass spectra were
accumulated over 60s, being scanned over the m/z 50-1000 range.
Statistical analyses
All analyses were performed in triplicate. The results were submitted to variance (ANOVA) analysis and Tukey’s test (5% probability) using the Statistica 5.0 software.
Results and discussion
Soybean oil characterization
To verify the quality of the soybean oil used in all methylation assays, its acid index (AI), peroxide index (PI) and MAG/DAG/TAG contents were determined (Table 1). The soybean oil was therefore found to be of good quality,20 with AI and PI values within the ranges which were recommended by ANVISA. The TAG content (97.46%) is also in accordance with Jakab et al.,21 which reports a TAG amount of 97% for refined vegetable oils.
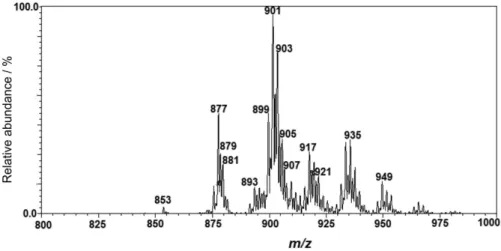
EASI-MS was then used to characterize the soybean oil according to its TAG profile (Figure 1, Table 2). This TAG
Table 1. Characterization of the soybean oil employed in the methylation assays
Analysis Results Maximum limit
ANVISA 2005 AI / (mg KOH g-1 sample) 0.08 ± 0.02 0.60 PI / (meq O2 kg-1) 6.92 ± 0.18 10.0
MAG / %, m/m ND
-DAG / %, m/m 1.54 ± 0.33
-TAG / %, m/m 97.46 ± 0.25
-AI: acid index; PI: peroxide index; MAG: monoacylglycerol; DAG: diacylglycerol; TAG: triacylglycerol; ND: not determined.
profile is in accordance with Simas et al.,22 which employed EASI-MS to characterize corn, cotton, olive and soybean oils, finding that each oil display a unique TAG profile via EASI(+)-MS that allow typification and the detection of problems which are related to quality control, such as adulteration via admixtures.
In Figure 1, the ion of greatest abundance is the [TAG + Na]+ of m/z 901, and its relative abundance has been used as a typification and quality parameter in soybean oil analysis by EASI(+)-MS.23,24
Since refined vegetable oils are not bottled under vacuum at industrial facilities, molecular oxygen will be present inside the bottle either in the headspace or dissolved in the oil. The relatively high unsaturation level of soybean oil also increases its susceptibility to oxidation. The oxidation products of soybean oil could therefore be detected (Figure 1) mainly via the ions [TAG hydroperoxide + Na]+ of m/z 931, 933, 935, 937 corresponding to LLLn/OLnLn, LLL/OLLn, OLL/OOLn and OOL, respectively, and [TAG hydroperoxide + K]+ of
m/z 947, 949, 951, 953 corresponding to LLLn/OLnLn, LLL/OLLn, OLL/OOLn, OOL, respectively (Table 2). Auto-oxidation of vegetable oils is usually triggered via the generation of reactive oxygen species (hydroxyl radicals and hydroperoxide anion) formed by photo-oxidation due to exposure to UV light during storage. These free radicals react most favorably with unsaturated FA to start a series of chain oxidation reactions.12,22,24
Sample characterization after methylation
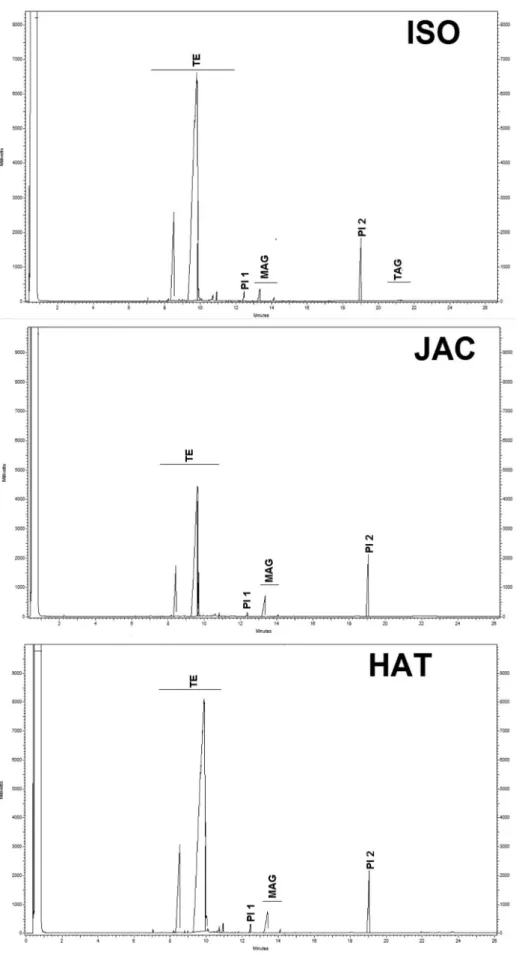
The oil samples were analyzed via GC-FID to verify the effectiveness of methylation via acid or basic catalysis as well as the content of the residual molecules MAG, DAG and TAG (Table 3 and Figure 2).
There is significant difference (p < 0.05) between acid and base-catalyzed methylation, with the base catalysis showing greater ester yield (95.66%) than acid catalysis (94.51% for HAT and 92.86% for JAC). Much similar yields were obtained upon comparison of the same type of methylation methods for canola, olive and soybean oil,8 but the residual MAG, DAG and TAG have probably not been measured. Table 3 shows clearly that MAG and TAG are still present in the final product when using ISO assay. For the HAT and JAC methods, only MAG was detected as residues. These methods use high reaction temperatures and in the first part of the JAC procedure, TAG are methylated in the presence of NaOH, and any remaining TAG residual are further methylated with BF3. Employment of heating for the JAC procedure should however increase oxidation levels, and oxidation products are not detected via GC-FID analysis.
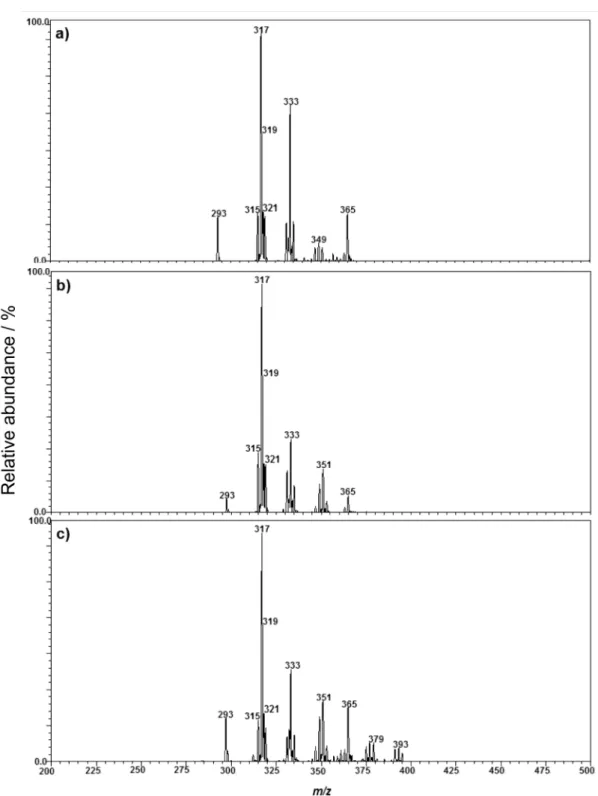
Figure 3 shows EASI(+)-MS of soybean oil which was methylated via the different acid and base-catalyzed methods employed in this study.14-16 Note that FAME are
Table 2. TAG ions and TAG hydroperoxides detected by EASI(+)-MS
TAG CN/DB [M + Na]+ [M + K]+
PPL 50:2 853 869
PLL 52:4 877 893
POL 52:3 879 895
POO or PSL 52:2 881 897
LLLn 54:7 899 915
LLL or OLLn 54:6 901 917
OOLn or OLL 54:5 903 919
SLL or OOL 54:4 905 921
OOO or SOL 54:3 907 923
[TAG hydroperoxide]
[LLLn hydroperoxide] 931 947
[LLL or OLLn hydroperoxide] 933 949
[OOLn or OLL hydroperoxide ] 935 951
[SLL or OOL hydroperoxide] 937 953
CN/DB: carbon number/double bond; P: palmitic acid; S: stearic acid; O: oleic acid; L: linoleic acid; Ln: linolenic acid.
Table 3. Total esters, MAG, DAG and TAG analysis for soybean oil after different acid and base-catalyzed methylation methods
Components
Methods
Alkaline
catalysis Acid catalysis
ISO14 JAC15 HAT16
TE / %, m/m 95.66a ± 0.35 92.86b ± 1.09 94.51a,b± 0.25
MAG / %, m/m 1.37b ± 0.16 1.28b ± 0.02 2.34a ± 0.04
DAG / %, m/m ND ND ND
TAG / %, m/m 0.08a ± 0.00 ND ND
Calibration curves
MAG Y = 0.59228X – 0.00149; RSD = 1,92529E-4 (% m/m); R2 = 0.99952
DAG Y = 0.6813X + 0.00883;
RSD = 5,88317E-4 (% m/m); R2 = 0.99427
TAG Y = 0.94466X + 0.02177; RSD = 8,73828E-5 (% m/m); R2 = 0.99915
Figure 3. EASI(+)-MS profiles of soybean oil after “methylation” by the a) ISO14 basic catalysis methods or by the b) Hartman & Lago, (HAT)16 or c) Joseph & Ackman, (JAC)15 acid catalysis methods.
detected in the form of [FAME + Na]+ and [FAME + K]+ ions, with the predominance of the [FAME + Na]+ ion of
m/z 317 (linoleic acid) followed by those of m/z 319 (oleic acid), m/z 315 (linolenic acid), m/z 321 (stearic acid) and
m/z 293 (palmitic acid). The [FAME + K]+ ions of m/z 333, 335, 331, 337 and 309 correspond to linoleic, oleic, linolenic, stearic and palmitic acids, respectively.24-31 The FAME profile obtained via EASI(+)-MS closely reflect
the FA composition expected for soybean oil, in which linoleic acid is predominant (49.7-56.9%), followed by oleic (17.7-26%), palmitic (9.9-12.2%) and linolenic (3.0-5.4%) acids.21
As for TAG, oxidized FAME were also detected in Figure 3 mainly as [FAME hydroperoxide + Na]+ ions of
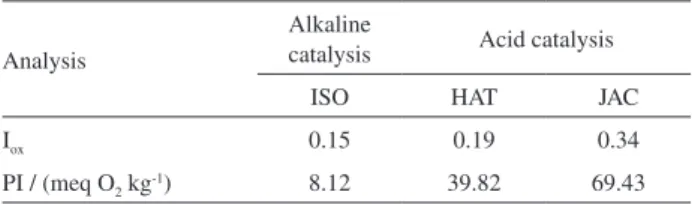
Table 4. Oxidation index (Iox) and peroxide index (PI) to the acid and base-catalyzed methylation of soybean oil.
Analysis
Alkaline
catalysis Acid catalysis
ISO HAT JAC
Iox 0.15 0.19 0.34
PI / (meq O2 kg-1) 8.12 39.82 69.43 acids, respectively. These ions of m/z 347, 349 and 351 work therefore as markers of oxidation and they were detected in all spectra (Figure 3). Note that the spectrum of figure 3c also shows a cluster of ions of m/z 375, 377 and 379 that probably correspond to [MAG + Na]+ ions. GC-FID analysis confirms higher amounts of MAG when using the JAC method.
To determine if EASI-MS technique is able to detect minor differences in the content of hydroperoxides, a oxidation index (Iox) has been calculated for each methylation methods, where Iox is defined as the ratio between the sum of the relative abundances of oxidized polyunsaturated FAME and the sum of the relative abundances of non-oxidixzed polyunsaturated FAME, both detected as sodiated and potassiated molecules (Table 4).
Conventional peroxide index analysis was also performed to quantify the content of peroxides and to compare with EASI-MS the Iox index. Higher values of PI were indeed found for HAT and JAC as compared to ISO, similar to what the Iox indexes have indicated. These results confirm a direct influence of the methylation reaction towards acceleration of the oxidative process and greater oxidation via acid catalysis.
The greater oxidation levels for acid catalysis can be attributed to the higher reaction temperatures used (100oC during 30 min), which are likely to accelerate auto-oxidation. The HAT method uses as catalyst a prepared mixture of ammonium chloride with sulfuric acid and methanol, forming as a product hydrochloric acid in methanol which acts as catalyst. Since HCl is a weak oxidizing agent and sample heating time is short (10 min), oxidation occurs but to a much reduced extent.11
Conclusions
The EASI(+)-MS technique allows rapid, efficient and undisturbed monitoring of FA profiles of methylation products of vegetable oils, as exemplified herein for soybean oil, including hydroperoxides. The degree of oxidation monitored via EASI-MS at the molecular level via a Iox index proposed herein was found to directly
correlate with the overall oxidation level quantified by the classical peroxide index.
GC analysis showed that alkaline catalysis (ISO) provided higher reaction yields while EASI-MS detected lower formation of hydroperoxides during the methylation. The ISO procedure was also found to be superior due to lesser demands of toxic reagents. However, the ISO procedure can only be applied to samples with FFA content less than 1% (m/m). For samples with higher FFA contents, the HAT procedure when compared to the JAC method is more suitable since esterification is achieved with lesser oxidation.
Acknowledgements
The authors would like to thank FAPESP, CAPES and CNPq for their financial support and fellowships and COCAMAR by providing samples.
References
1. Ficarra, A.; Lo Fiego, D. P.; Minelli, G.; Antonelli, A.; Food Chem. 2010,121, 809.
2. Naviglio, D.; Romano, R.; Pizzolongo, F.; Santini, A.; De Vito, A.; Schiavo, L.; Nota, G.; Spagna Musso, S.; Food Chem. 2007, 102, 399.
3. Schuchardf, U.; Sercheli, R.; Vargas, R. M.; J. Braz. Chem. Soc. 1998,9, 199.
4. Atadash, I. M.; Aroua, M. K.; Aziz, A. R.; Sulaiman, N. M. N.;
J. Ind. Eng. Chem.2013, 19, 14.
5. Shantha, N. C.; Napolitano, G. E.; J. Chromatogr.1992, 624,
37.
6. Prados, C. P.; Rezende, D. R.; Batista, L. R.; Alves, M. I. R.; Antoniosi Filho, N. R.; Fuel2012, 96, 476.
7. Fulk, W. K.; Shorb, M. S.; J. Lipid Res.1970, 11, 276. 8. Milinski, M. C.; Matsushita, M.; Visentainer, J. V.; Oliveira,
C. C.; Souza, N. E.; J. Braz. Chem. Soc. 2008, 19, 1475. 9. Zara, R. F.; Bonafé, E. G.; Martin, C. A.; Souza, N. E.; Muniz,
E. C.; Visentainer, J. V.; Am. J. Anal. Chem.2012, 3, 288. 10. Haddad, R.; Sparrapan, R.; Eberlin, M. N.; Rapid. Commun.
Mass. Spectrom. 2006, 20, 2901.
11. Alberici, R. M.; Simas, R. C.; Sanvido, G. B.; Romão, W.; Lalli, P. M.; Benassi, M.; Cunha, I. B. S.; Eberlin, M. N.; Anal. Bioanal. Chem.2010, 398, 265.
12. Simas, R. C.; Catharino, R. R.; Cunha, I. B. S.; Cabral, E. C.; Barrera-Arellano, D.; Eberlin, M. N.; Alberici, R. M.; Analyst 2010, 135, 738.
13. Alberici, R. M.; Souza, V.; Gonçalves, L. V.; Cunha, V. S.; Eberlin, M. N.; Daroda, R. J.; J. ASTM Int. 2012, 9, 1. 14. ISO Guide 5509: Animal and Vegetable Fats and Oils –
15. Hartman, L.; Lago, R. C. A.; Lab. Pract. 1973, 22, 474. 16. Joseph, J. D.; Ackman, R. G.; J. AOAC Int. 1992, 75, 488. 17. Lutz, A.; Normas Analíticas do Instituto Adolfo Lutz. Métodos
Químicos e Físicos para Análise de Alimentos, 3ª ed.; IMESP: São Paulo, 1985, pg. 260.
18. American Oil Chemists’ Society (AOCS); Official Methods and Recommended Practices of the American Oil Chemists’ Society,
5th ed.; AOCS Press: Champaign, IL, 1998. 19. Visentainer, J.V.; Quim. Nova2012, 35, 274.
20. Agência Nacional de Vigilância Sanitária (ANVISA);
Regulamento Técnico para Óleos Vegetais, Gorduras Vegetais e Creme Vegetal, Resolution RDC No. 270, 2005.
21. Jakab, A.; Héberger, K.; Forgács, E.; J. Chromatogr., A 2002,
976, 255.
22. Simas, R. C.; Barrera-Arellano, D.; Eberlin, M. N.; Catharino, R. R.; Souza, V.; Alberici, R. M.; J. Am. Oil. Chem. Soc.2012,
89, 1193.
23. Firestone, D.; Physical and Chemical Characteristics of Oils, Fats and Waxes, AOCS Press: Washington, DC, 1999. 24. Prates, R. G. D.; Augusti, R.; Fortes, I. C. P.; Energy Fuels.
2010, 24, 3183.
25. García-Reyes, J. F.; Mazzoti, F.; Harper, J. D.; Charipar, N. A.; Oradu, S.; Ouyang, Z.; Sindona, G.; Cooks, R. G.; Rapid Commun. Mass Spectrom. 2009, 23, 3057.
26. Gidden, J.; Liyanage, R.; Durham, B.; Lay Jr, J. O.; Rapid Commun. Mass Spectrom. 2007, 21, 1951.
27. Lay, J. O.; Liyanage, R.; Durham, B.; Brooks, J.; Rapid Commun. Mass Spectrom. 2006, 20, 952.
28. Al-Saad, K. A.; Zabrouskov, V.; Siems, W. F.; Knowles, N. R.; Hannan, R. M.; Hill Jr, H. H.; Rapid Commun. Mass Spectrom. 2003, 17, 87.
29. Eberlin, L. S.; Abdelnur, P. V.; Passero, A.; Daroda, R. J.; Souza, V.; Eberlin, M. N. Analyst2009, 114, 1652.
30. Catharino, R. R.; Milagre, H. M. S.; Saraiva, S. A.; Garcia, C. M.; Schuchardt, U.; Eberlin, M. N.; Augusti, R.; Pereira, R. C. L.; Guimarães, M. J. R.; Sá, G. F.; Caixeiro, J. M. R.; Souza, V.; Energy Fuels2007, 21, 3698.
31. Eide, I.; Zahlsen, K.; Energy Fuels2007, 21, 3702.
Submitted: July 19, 2013 Published online: September 11, 2013