Article
J. Braz. Chem. Soc., Vol. 28, No. 5, 819-830, 2017. Printed in Brazil - ©2017 Sociedade Brasileira de Química 0103 - 5053 $6.00+0.00
*e-mail: [email protected]
Identification of Alkaloids from
Hippeastrum aulicum
(Ker Gawl.) Herb.
(Amaryllidaceae) Using CGC-MS and Ambient Ionization Mass Spectrometry
(PS-MS and LS-MS)
Carliani D. P. B. Bessa,a Jean P. de Andrade,a Renata S. de Oliveira,b Eloilson Domingos,c
Heloa Santos,c Wanderson Romão,c Jaume Bastidad and Warley S. Borges*,a
aDepartamento de Química, Universidade Federal do Espírito Santo, 29075-910 Vitória-ES, Brazil
bDepartamento de Botânica, Instituto de Biociências, Universidade de São Paulo,
05508-900 São Paulo-SP, Brazil
cLaboratório de Petroleômica e Química Forense, Departamento de Química,
Universidade Federal do Espírito Santo, 29075-910 Vitória-ES, Brazil
dGrup de Productes Naturals, Departament de Biologia, Sanitat i Medi Ambient,
Facultat de Farmàcia, Universitat de Barcelona, 08028 Barcelona, Spain
Amaryllidaceae alkaloids are well-known isoquinolines which have demonstrated a wide range of biological activities such as antiviral, anticancer, acetylcholinesterase inhibition, antimalarial, among others. Mass spectrometry (MS) studies based on capillary gas chromatography (CGC), paper spray (PS), and leaf spray (LS) ionization were carried out for alkaloid investigation of the native Brazilian species Hippeastrum aulicum, along with nuclear magnetic resonance (NMR) techniques. Thirty-one alkaloids were identified including the new compound haemanthamine N-oxide. The results from PS- and LS-MS techniques were consistent with those observed in CGC-MS analysis. To the best of our knowledge, it is the first study combining NMR, CGC-MS and the ambient ionization-mass spectrometry (PS- and LS-MS) on Amaryllidaceae plants.
Keywords: Amaryllidaceae, Hippeastrum aulicum, CGC-MS, PS-MS/LS-MS, isoquinoline
alkaloids
Introduction
Amaryllidaceae is a well-known family of monocotyledons which are distributed widely over the temperate and warm regions of the world.1 Amaryllidaceae plants are able to synthesize a specific group of isoquinoline alkaloids, which have demonstrated remarkable biological activities, such as antitumoral, antiviral, antiparasitic, acetylcholinesterase inhibitory, among others.1 The outstanding feature of Amaryllidaceae plants is a consistent presence of a unique group of alkaloids, which have been isolated from all the genera of this family.1 The current investigation on Amaryllidaceae alkaloids has focused on hyphenated techniques, which exploit the advantages of both chromatographic and spectral methods.2,3 This strategy can be understood as a kind of dereplication process,4 which is very
attractive in that it avoids labor-intensive chromatographic steps and analysis of worthless components.
Capillary gas chromatography-mass spectrometry (CGC-MS) has become the most successful technique for a dereplication approach to Amaryllidaceae alkaloids since these compounds have shown accurate detection under CGC-MS conditions. The construction of an in-home alkaloidal database based on electron impact-mass spectrometry fragmentation (EI-MS) and retention index allows a quick identification of known compounds.5 Although most Amaryllidaceae alkaloids are suitable for CGC-MS analysis, even as underivatized compounds, there are exceptions like alkaloids in the form of salts or N-oxide,6 which therefore require the support of other methodologies for correct identification and/or quantification.
techniques constitute simplified and efficient alternatives for the detection and quantification of analytes directly from their natural environments (the “real world”) or when placed on auxiliary surfaces.9
An important ambient ionization technique is paper spray (PS) ionization. PS analysis is performed by placing the sample in the middle of a triangular piece of paper, held by a metallic clip attached to a high voltage source that is positioned in front of the inlet orifice of the mass spectrometer (MS). The paper is moistened with a solvent and a high voltage is applied to the paper through the metal clip. Consequently, in the paper tip is formed a spray with charged droplets that go towards the entrance of the MS and are analyzed.9,10
Recently, a variant technique of PS was introduced, the leaf spray(LS). The difference between paper spray and leaf spray is that the latter uses the sample itself (a plant tissue) for generating ions in gaseous phase. Ions can be generated in plant tissue without adding a solvent,11 due to the natural juice present in fruit and vegetables. However, mass spectra with more intense signals and an improved signal/noise ratio can be obtained when a solvent is added.
The PS-MS and LS-MS have been applied in chemical identification of natural products present in coffee,12 fruits,13 extra-virgin olive oils14 and herbal teas.15 Furthermore, LS-MS has also demonstrated excellent sensitivity for the direct identification of chemical species on the surface of leaves of plants such as Populus deltoids, Populus grandidentata,11
Hibiscus moscheutos, Hibiscus syriacus16 and Illicium
anisatum.17
I n t h e p r e s e n t wo r k , i n d i g e n o u s B r a z i l i a n
Hippeastrum aulicum was submitted to a classical
phytochemical procedure assisted by CGC-MS, PS-MS and LS-MS. Thirty-one compounds were identified, including the new compound haemanthamine N-oxide, which was completely characterized by mono (1D) and bidimensional (2D) nuclear magnetic resonance (NMR) experiments. The results obtained via CGC-MS were compared with ambient mass spectrometry techniques (PS-MS and LS-MS).
Experimental
General experimental procedures
Column chromatography (CC) and vacuum liquid chromatography (VLC) were carried out using silica gel 60 (70-230 mesh, Merck) and silica gel 60 ACC (6-35 µm, Chromagel-SDS), respectively. For thin layer chromatography (TLC), commercial plates with silica gel F254 as the stationary phase and dimensions of 20 cm × 20 cm × 0.20 mm and 20 cm × 20 cm × 0.25 mm
were used for analytical and semi-preparative TLC (SPTLC), respectively. High performance liquid chromatography (HPLC) was performed on an Agilent G1311C-1260 quaternary pump coupled to a UV-Vis diode array (DAD), model G1315D-1260, using the semi-preparative column Zorbax RX-Sil (9.4 × 250 mm, 5 µm) and HPLC grade solvents. NMR spectra (nuclear magnetic resonance) were recovered on a Varian 400 MHz instrument using deuterated chloroform (CDCl3) or deuterated methanol (CD3OD) as solvents and tetramethylsilane (TMS) as the internal standard. The CGC-MS spectra (capillary gas chromatography-mass spectrometry) were obtained on a GC-17A Shimadzu CG-MS QP 5000 operating in the EI mode at 70 eV using a DB5 MS column (30 m × 0.25 mm × 0.25 µm). The temperature program was as follows: 100-180 °C at 15 °C min-1, 1 min hold at 180 °C and 180-300 °C at 5 °C min-1 and 10 min hold at 300 °C. The injector temperature was 280 °C. The flow rate of carrier gas (helium) was 0.8 mL min-1, and the split ratio was 1:20. HRESIMS (high-resolution electrospray ionization mass spectrometry) was performed on 9.4 T FT-ICRMS (Solarix) by direct injection of the compound dissolved in methanol (MeOH). A Jasco-J-810 Spectrophotometer (Easton, MD, USA) was used to run CD (circular dichroism) spectra, all recorded in MeOH. Infrared (IR) spectrum was recorded on a PerkinElmer Spectrum 400 FT-IR/FT-NIR Spectrometer. UV (ultraviolet) spectrum was obtained on a UV-PerkinElmer, Lambda 45, UV-Vis.
Acetone (Me2CO), ammonia (NH3), ammonium hydroxide (NH4OH), 1-butanol (n-BuOH), dichloromethane (CH2Cl2), n-hexane (n-Hex), ethyl acetate (EtOAc) and sulphuric acid (H2SO4) used for the extraction and isolation procedures were of analytical grade.
Plant material
Approximately 1.7 kg of fresh bulbs and 1.0 kg of fresh leaves of Hippeastrum aulicum (Ker Gawl.) Herb. were collected in Biritiba-Mirim City of São Paulo State, in September 2013. A voucher specimen was deposited in the Herbarium UEC (Campinas-SP, Brazil), under the reference number 114. The species was identified by Dr Renata S. de Oliveira. A new specimen was collected at the same location in February 2016 and again identified as H. aulicum (Ker Gawl.) Herb. by Dr Renata S. de Oliveira. This specimen was used for ambient MS analysis.
Extract procedure
filtered and the solvent evaporated under reduced pressure. The plant material was then twice extracted with MeOH (48 hours each), filtered and the solvent evaporated under reduced pressure. The remaining crude extract was finally combined.
Extraction and isolation procedures
Leaves
The leaf crude extract was acidified with H2SO4 (2%) up to pH 2 and extracted with n-Hex (9 × 200 mL) to remove neutral material. The aqueous phase was basified with NH4OH (25%) up to pH 10 and extracted with n-Hex (5 × 200 mL) yielding the extract IA (166.5 mg), followed by the extraction with EtOAc (15 × 200 mL) affording extract IIA (897.2 mg), and finally extracted with the mixture of EtOAc:MeOH (3:1, 3 × 200 mL) providing the extract IIIA (1.56 g).
The extract IA was chromatographed by CC, starting with a mixture of EtOAc:n-Hex (9:1), gradually increasing the polarity up to 100% EtOAc and finally increasing the MeOH percentage in the mixture up to a ratio of EtOAc:MeOH (1:1). 320 fractions (5 mL each) were collected and after analytical TLC were grouped by similarity in six fractions. Fraction 5 was resuspended in MeOH, and haemanthamine (16) (5.0 mg) precipitated spontaneously. Fraction 6 was purified by SPTLC (n-Hex:EtOAc:Me2CO:MeOH:isopropanol, 5:2:2:1:2, in NH3 atmosphere) and allowed the isolation of albomaculine (29) (5.9 mg).
A CC column (EtOAc:MeOH, 49:1) was performed to purify the components of the extract IIA, in which 800 fractions (4 mL each) were collected and combined according to their TLC profile, which afforded 11 fractions. Fraction 9 (650.5 mg) was resuspended in MeOH and haemanthamine (16) (228.2 mg) precipitated spontaneously. The supernatant was subjected to CC, starting with EtOAc:MeOH (23:2) and increasing solvent polarity with MeOH up to 1:1, which allowed the collection of 342 fractions (4 mL each). Fractions were compared by analytical TLC (plates were revealed with Dragendorff’s reagent and UV light at 254 nm) and combined according to their similarities, obtaining 10 subfractions. From subfraction 9.7 (320.5 mg, viscous material), 66.0 mg of haemanthamine (16) precipitated spontaneously. The supernatant from subfraction 9.7 was purified by CC starting with EtOAc:MeOH (9:1), gradually increasing the MeOH percentage up to EtOAc:MeOH (1:1) and affording 634 fractions (3 mL each). After analytical TLC analysis, fractions were again combined by similarity, yielding 12 subfractions. Sample 9.8.7 was purified by
SPTLC (EtOAc:CH2Cl2:Me2CO:MeOH:n-Hex, 2:2:2:1:1, along with drops of NH4OH, in NH3 atmosphere) allowing the purification of the alkaloids haemanthidine (22) and 6-epihaemanthidine (23) (16.5 mg).
Fractions 10 (33.9 mg) and 11 (34.5 mg) were purified by SPTLC (n-Hex:EtOAc:Me2CO:MeOH:n-BuOH, 4:3:3:2:1, in NH3 atmosphere). Haemanthamine N-oxide (1) (10.0 mg) and 7-methoxy-O-methyllycorenine (12) (5.7 mg) were obtained from fraction 10 and compound 12 (6.7 mg) was again obtained from fraction 11.
The extract IIIA showed a negligible alkaloid content by CGC-MS and analytical TLC analysis.
Bulbs
The bulb extract was submitted to the same acid-base extraction as outlined previously. The n-Hex extract (IB) afforded 506.7 mg, while the EtOAc extract (IIB) yielded 2.65 g. Finally, 2.06 g was provided by the EtOAc:MeOH (3:1) extract (IIIB).
The extract IB was subjected to CC eluting, firstly with a mixture of EtOAc:MeOH:CH2Cl2 (3:1:1), along with drops of the NH4OH. The system polarity was gradually increased, enriching the mixture with MeOH and decreasing the amount of EtOAc to 50% of MeOH in the mixture. Approximately 770 fractions of 5 mL each were collected. These fractions were analyzed by TLC and then combined according to their alkaloidal profile under UV λ 254 light and Dragendorff’s reactive spots, affording 18 fractions. Fraction 9 (60.0 mg) was purified by SPTLC (CH2Cl2:EtOAc:Me2CO:n-Hex:MeOH, 2:2:1.5:3:1, along with drops of NH4OH, in NH3 atmosphere) and alkaloids haemanthamine (16) (6.5 mg), albomacuine (29) (3.5 mg) and 7-methoxy-O-methyllycorenine (12) (8.0 mg) were isolated. The alkaloid aulicine (15) (48.0 mg) precipitated from fraction 11.
(2:2:1:1:1), the system polarity being increased by adding MeOH (up to the ratio 2:2:1:5:1). 944 fractions of 4 mL each were obtained. The fractions were combined according to their alkaloid profile by TLC using UV (λ 256) and Dragendorff’s reagent stain, resulting in 11 subfractions. SPTLC (EtOAc:CH2Cl2:Me2CO:MeOH:n-Hex, 2:2:1:1:1, along with drops of the NH4OH, in NH3 atmosphere) was performed to purify subfraction 13.6, and the alkaloid galanthine (21) (3.6 mg) was isolated. Subfraction 13.7 was identified as the alkaloid haemanthamine (16) (49.0 mg). After resuspension of subfraction 13.8 in MeOH, haemanthamine (16) (253.0 mg) precipitated spontaneously. Subfraction 13.9 was purified by SPTLC (EtOAc:CH2Cl2:Me2CO:MeOH:n-Hex, 2:2:1:1:1, along with drops of the NH4OH, in NH3 atmosphere) resulting in the isolation of the isomers haemanthidine (22) and 6-epihaemanthidine (23) (3.5 mg) and alkaloid norpluviine (14) (1.5 mg).
Like extract IIIA, extract IIIB showed a negligible alkaloid content by CGC-MS and analytical TLC analysis.
Haemanthamine N-oxide (1)
Amorphous solid; CD [Θ]λ20: [Θ]245 − 5224, [Θ]294 + 2788; UV (MeOH) λmax / nm (ε) 237 (1692), 292
(1884); IR (CHCl3) νmax / cm-1 3361, 2926, 1640, 1487, 1247, 1037, 750; 1H NMR (400 MHz, CDCl
3) and 13C NMR (100 MHz, CDCl3) see Table 1; HRESIMS of [M + H]+
m/z 318.13362 (calculated for C17H20NO5: 318.13360).
Identification of alkaloids by CGC-MS
The alkaloids were identified by comparing their CGC-MS spectra and Kovats retention indices (RI) with our library database. This library has been regularly updated with alkaloids isolated and unequivocally identified via physical and spectroscopic methods.18 NMR data for the known alkaloids described herein closely matched those reported elsewhere.18-26 Mass spectra were deconvoluted using AMDIS 2.64 software (NIST) (WA, USA) and RIs recorded using a standard n-hydrocarbon calibration mixture (C9-C36). The proportion of individual components in the alkaloid fractions are expressed as a percentage of total alkaloid content. CGC-MS peak areas are dependent on the concentration of the injected alkaloid as well as the intensity of its mass spectral fragmentation. Although the data given in Table 2 are not representative of a validated alkaloid quantification method, they can be used for relative comparison purposes.
Table 1. 1H NMR, COSY, NOESY, HSQC and HMBC data of haemanthamine N-oxide (1) (400 MHz, CD 3OD)
Position dH (J in Hz) COSY NOESY HSQC/13C HMBC
1 6.36 br s H-10 126.8 d C-3, C-4a, C-10b
2 6.36 br s H-3, H-4β H-3 131.5 d C-3, C-10b
3 4.02 br s H-2, H-4α, H-4β H-2, 3-OMe, H-4α, H-4β
72.9 d C-1, C-2
4α 2.36 ddd (13.6, 13.2, 4.4) H-3, H-4a, H-4β H-3, H-12exo, H-4β 24.7 t C-4a 4β 2.75 ddd (13.6, 4.0, 1.6) H-2, H-3, H-4a, H-4α H-3, H-4a, H-4α C-2, C-3, C-4a, C-10b
4a 3.74 dd (13.2, 3.6) H-4α, H-4β H-4β, H-6β 75.2 d C-11
6α 4.68 d (15.4) H-7 H-7, H-12endo 75.4 t C-4a, C-6a, C-7, C-10a
6β 4.75 d (15.4) H-7, H-12exo H-4a, H-7 C-6a, C-7, C-10a, C-12
6a 122.5 s
7 6.68 s H-6α, H-6β H-6α, H-6β 107.3 d C-6, C-9, C-10a
8 148.9 s
9 149.6 s
10 6.98 s H-1 104.5 d C-6a, C-8, C-10b
10a 133.5 s
10b 53.7 s
11endo 3.94 br dd (7.2, 3.6) H-12endo, H-12exo H-12endo 77.3 d 12endo 4.37 dd (13.6, 7.2) H-11endo, H-12exo H-6α, H-11endo,
H-12exo
76.9 t C-4a, C-6, C-10b
12exo 3.71-3.66 m H-6β, H- 11endo, H-12endo
H-4α, H-12endo
3-OMe 3.39 s H-3 57.0 q C-3
OCH2O 5.97 s 103.0 t C-8, C-9
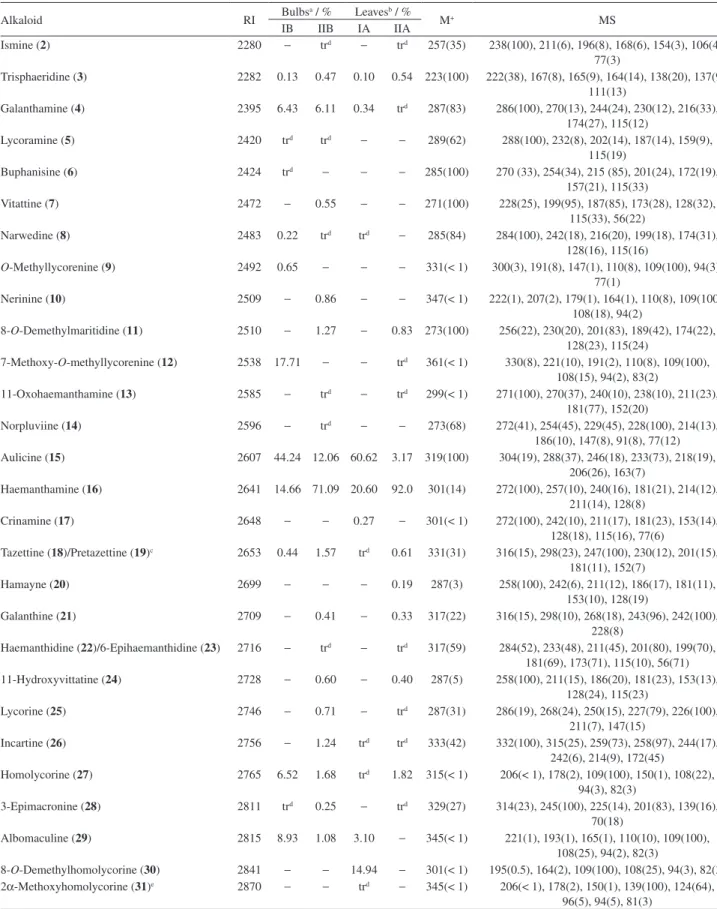
Table 2. CGC-MS data for H. aulicum. Values are expressed as a relative percentage of total ion current (TIC)
Alkaloid RI Bulbs
a / % Leavesb / %
M+ MS
IB IIB IA IIA
Ismine (2) 2280 − trd − trd 257(35) 238(100), 211(6), 196(8), 168(6), 154(3), 106(4), 77(3)
Trisphaeridine (3) 2282 0.13 0.47 0.10 0.54 223(100) 222(38), 167(8), 165(9), 164(14), 138(20), 137(9), 111(13)
Galanthamine (4) 2395 6.43 6.11 0.34 trd 287(83) 286(100), 270(13), 244(24), 230(12), 216(33), 174(27), 115(12)
Lycoramine (5) 2420 trd trd − − 289(62) 288(100), 232(8), 202(14), 187(14), 159(9), 115(19)
Buphanisine (6) 2424 trd − − − 285(100) 270 (33), 254(34), 215 (85), 201(24), 172(19), 157(21), 115(33)
Vitattine (7) 2472 − 0.55 − − 271(100) 228(25), 199(95), 187(85), 173(28), 128(32), 115(33), 56(22)
Narwedine (8) 2483 0.22 trd trd − 285(84) 284(100), 242(18), 216(20), 199(18), 174(31), 128(16), 115(16)
O-Methyllycorenine (9) 2492 0.65 − − − 331(< 1) 300(3), 191(8), 147(1), 110(8), 109(100), 94(3), 77(1)
Nerinine (10) 2509 − 0.86 − − 347(< 1) 222(1), 207(2), 179(1), 164(1), 110(8), 109(100), 108(18), 94(2)
8-O-Demethylmaritidine (11) 2510 − 1.27 − 0.83 273(100) 256(22), 230(20), 201(83), 189(42), 174(22), 128(23), 115(24)
7-Methoxy-O-methyllycorenine (12) 2538 17.71 − − trd 361(< 1) 330(8), 221(10), 191(2), 110(8), 109(100), 108(15), 94(2), 83(2)
11-Oxohaemanthamine (13) 2585 − trd − trd 299(< 1) 271(100), 270(37), 240(10), 238(10), 211(23), 181(77), 152(20)
Norpluviine (14) 2596 − trd − − 273(68) 272(41), 254(45), 229(45), 228(100), 214(13), 186(10), 147(8), 91(8), 77(12) Aulicine (15) 2607 44.24 12.06 60.62 3.17 319(100) 304(19), 288(37), 246(18), 233(73), 218(19),
206(26), 163(7)
Haemanthamine (16) 2641 14.66 71.09 20.60 92.0 301(14) 272(100), 257(10), 240(16), 181(21), 214(12), 211(14), 128(8)
Crinamine (17) 2648 − − 0.27 − 301(< 1) 272(100), 242(10), 211(17), 181(23), 153(14), 128(18), 115(16), 77(6)
Tazettine (18)/Pretazettine (19)c 2653 0.44 1.57 trd 0.61 331(31) 316(15), 298(23), 247(100), 230(12), 201(15), 181(11), 152(7)
Hamayne (20) 2699 − − − 0.19 287(3) 258(100), 242(6), 211(12), 186(17), 181(11), 153(10), 128(19)
Galanthine (21) 2709 − 0.41 − 0.33 317(22) 316(15), 298(10), 268(18), 243(96), 242(100), 228(8)
Haemanthidine (22)/6-Epihaemanthidine (23) 2716 − trd − trd 317(59) 284(52), 233(48), 211(45), 201(80), 199(70), 181(69), 173(71), 115(10), 56(71) 11-Hydroxyvittatine (24) 2728 − 0.60 − 0.40 287(5) 258(100), 211(15), 186(20), 181(23), 153(13),
128(24), 115(23)
Lycorine (25) 2746 − 0.71 − trd 287(31) 286(19), 268(24), 250(15), 227(79), 226(100), 211(7), 147(15)
Incartine (26) 2756 − 1.24 trd trd 333(42) 332(100), 315(25), 259(73), 258(97), 244(17), 242(6), 214(9), 172(45)
Homolycorine (27) 2765 6.52 1.68 trd 1.82 315(< 1) 206(< 1), 178(2), 109(100), 150(1), 108(22), 94(3), 82(3)
3-Epimacronine (28) 2811 trd 0.25 − trd 329(27) 314(23), 245(100), 225(14), 201(83), 139(16), 70(18)
Albomaculine (29) 2815 8.93 1.08 3.10 − 345(< 1) 221(1), 193(1), 165(1), 110(10), 109(100), 108(25), 94(2), 82(3)
8-O-Demethylhomolycorine (30) 2841 − − 14.94 − 301(< 1) 195(0.5), 164(2), 109(100), 108(25), 94(3), 82(3) 2α-Methoxyhomolycorine (31)e 2870 − − trd − 345(< 1) 206(< 1), 178(2), 150(1), 139(100), 124(64),
96(5), 94(5), 81(3)
PS-MS and LS-MS
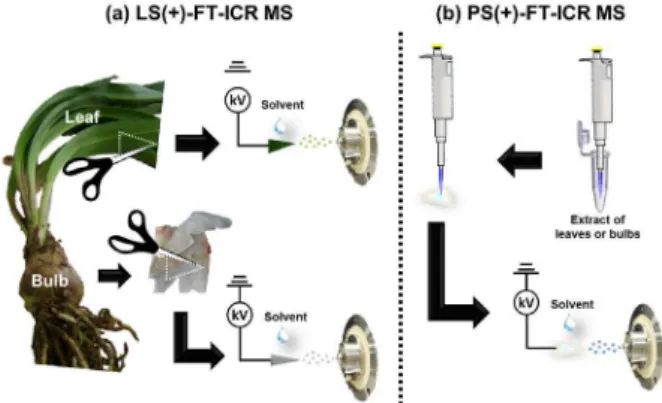
For LS-MS analysis, freshly collected leaves and bulbs of H. aulicum were cut into a triangle (base and height of 1 cm each) and held by a metal clip at a distance of 5-7 mm from the mass spectrometer inlet (Figure 1a).9 Approximately 10 µL of MeOH (HPLC grade, JTBaker) and a high voltage (3 kV) supplied by the mass spectrometer were applied to the leaf or bulb to generate the LS mass spectra.
For PS-MS analysis, extracts of bulbs and leaves were dissolved in MeOH at 2 mg mL-1. Then, 10 µL of solution was applied on the surface of a triangular paper (Whatman Grade 1, GE Healthcare)27,28 with base and height of 1 cm each. The triangular paper was fixed with a metal clip, connected to 0.5 mm wire linked to the mass spectrometer (Figure 1b). Then, 20 µL of MeOH was applied with a high voltage (3 kV) to the triangular paper to generate the PS mass spectra.
LS and PS-MS experiments were performed in positive ion mode (LS(+) and PS(+)) using a Fourier transform ion cyclotron resonance mass spectrometer (FT-ICR MS, model 9.4 T Solarix, Bruker Daltonics Bremen).27,29 Ion time accumulation was 0.010 s. LS(+) and PS(+)-FT-ICR mass spectra were acquired by accumulating 32 scans of time-domain transient signals in 16 mega-point time-time-domain data sets. All mass spectra were externally calibrated using NaTFA (m/z from 200 to 1200). A resolving power, m /∆m50% = 78000 (in which ∆m50% is the full peak width at the half-maximum peak height of m/z 300) and a mass accuracy of < 2 ppm provided the unambiguous molecular formula assignments for singly charged molecular ions. The proposed structures for each formula were assigned using the chemspider (www.chemspider.com) database. The degree of unsaturation for each molecule can be deduced directly from its double bond equivalent (DBE) value according to equation DBE = c – h / 2 + n / 2 + 1, where c, h, and n are the numbers of carbon, hydrogen, and nitrogen atoms, respectively, in the molecular formula.29
Results and Discussion
Alkaloid comparison
The phytochemical procedure assisted by MS and NMR approaches identified thirty-one compounds in H. aulicum (Figure 2 and Table 2). Thirteen alkaloids are reported here for the first time in H. aulicum, although some chemical similarities with previous studies have also been found.18,30 The H. aulicum studied here, from Biritiba-Mirim City (São Paulo, Brazil), displayed aulicine (15), haemanthamine (16), and lycorine (25) as the main compounds, as does H. aulicum from Cunha City (São Paulo, Brazil).18 Both Brazilian cities are relatively close, which may explain the presence of the same major components. Lycorine (25) was found to be one of the main alkaloids (see Experimental section) even though its low solubility in MeOH31 covered the correct relative quantification by CGC-MS (Table 2). A former H. aulicum investigation30 also revealed alkaloids such as norpluviine (14) and galanthine (21), which were observed in the present work. No information about the collection of the plant species in this previous study is available. In contrast, while ambelline, anhydrolycorine, chlidanthine, montanine, narcissidine and pseudolycorine have been previously reported,18,30 they were not found in this work. Notably, the identification of the alkaloids incartine (26) and buphanisine (6), which are uncommon in the Hippeastrum genus, is reported here for the first time in H. aulicum.32
CGC-MS dereplication
The CGC-MS results are shown in Table 2. The specific EI-MS fragmentation mechanisms for the distinct skeleton types together with retention indices are the key for alkaloid identification in Amaryllidaceae research. Concerning the skeleton types found in H. aulicum, the EI mass fragmentation of homolycorine-type alkaloid ∆3,4-derivatives features a dominant retro-Diels Alder process and cleavage of ring C, yielding a very abundant ion peak characterized by the pyrrolidine ring (m/z 109).33 Consequently, the alkaloids 9, 10, 12, 27, 29 and 30 show the base peak at m/z 109 (100%), with all remaining ion peaks displaying less than 10% of abundance. Otherwise, alkaloid 31 possesses a methoxyl group at C-2 and so displays the base peak at m/z 139, which is in agreement with the pyrrolidine residue along with the methoxyl substituent at C-2.33 Lycorine-type compounds, which are biogenetically related to the homolycorine skeleton, also suffer a retro-Diels Alder process followed by the loss of C-1 and C-2, along with their substituents, yielding the base peak at m/z 228, 242 and
226 for compounds 14, 21 and 25, respectively. Alkaloid 26, which lacks the 3,4-unsaturation, possesses the base peak at m/z 332 (M-1) instead of the typical base peak after the retro-Diels Alder process.34
The EI-MS fragmentation of the tazettine-type skeleton, represented by compounds 18, 19 and 28, is strongly supported by the stereochemistry of the substituent at C-3. The β-orientation of the C-3 substituent induces a retro-Diels Alder process at ring C followed by the loss of the neutral fragment [C5H8O], which yields the base peaks at m/z 247 and 245 for compounds 18 and 28, respectively (Table 2). Compound 18 is an artefact of 19 under CGC-MS.31 Considering the high temperature of the CGC-MS method, the haemanthamine-type skeleton also suffers a thermal decomposition, particularly those compounds with a substitution at C-11, as in the case of 13, 16, 17, 20, 22,
23 and 24.6,35 Conversely, the EI-MS fragmentation of galanthamine-type compounds under CGC and direct
insertion probe (DIP) conditions are very similar and feature abundant [M]+ and [M − H]+ ion peaks, similarly to lycorine-type alkaloids.36 The galanthamine-type compounds also show typical fragmentation, with domination of one or another pathway depending on the substituents of the skeleton. In summary, the 4,4a-unsaturation induces the loss of the substituent at C-3 followed by the elimination of the nitrogen [C3H7N], as in galanthamine (4) and narwedine (8). In the EI-MS spectrum of lycoramine (5), a dihydro derivative, this induction is weaker and the remaining ion peaks are considerably less abundant than those observed for galanthamine (4) and narwedine (8) (Table 2).
Phytochemical procedure and NMR data of haemanthamine
N-oxide (1)
In the course of the phytochemical procedure, the known Amaryllidaceae alkaloids haemanthamine (16),19,23
a l b o m a c u l i n e (2 9) ,1 8 h a e m a n t h i d i n e (2 2) , 6 - e p i h a e m a n t h i d i n e (2 3) ,1 9 7 - m e t h o x y -O -methyllycorenine (12),18 aulicine (15),18 lycorine (25),22,23 trisphaeridine (3),21,24 galanthine (21),20 and norpluviine (14),25 were isolated and identified by comparison of their spectroscopic data with those previously reported. The phytochemical procedure was assisted by CGC-MS and the new compound haemanthamine N-oxide (1) was purified from a natural source for the first time. Compound 1 showed an 1H NMR spectrum very similar to that of haemanthamine. The characteristic 1H NMR spectrum included: (i) two para -oriented aryl singlets at d 6.98 and 6.68, the most deshielded of which was assigned to H-10 due to its NOESY (nuclear Overhauser effect spectroscopy) correlation with H-1; (ii) H-1 and H-2 were assigned at d 6.36 (2H), confirmed by COSY (correlation spectroscopy) correlation with H-3 (d 4.02) and two HSQC (heteronuclear single quantum coherence) correlations at d 126.8 and 131.5, respectively; (iii) a typical resonance at d 5.97 corresponding to the methylenedioxy group; (iv) the aliphatic methoxyl group confirmed at position C-3 due to the HMBC (heteronuclear multiple bond correlation) correlation between 3-OMe and C-3; (v) the magnitude of the coupling constant between H-4α and H-3 (J = 4.4 Hz) was indicative of a trans relationship between 3-OMe and the 5,10b-ethano bridge. The remaining 1H NMR signals were consistent with the structure of haemanthamine (16), with the exception of positions H-4a, H-6 and H-12. The H-4a resonance was 0.48 ppm more deshielded than its homolog in haemanthamine. Both H-6 were assigned at d 4.68 and 4.75 ppm, 0.94 and 0.49 ppm more deshielded than the H-6α and H-6β in haemanthamine, respectively. Finally, the H-12endo and H-12exo were 0.94 and 0.50 ppm more deshielded than their homologs in haemanthamine. This kind of deshielding effect was congruent with the alkaloid haemanthamine in salt or N-oxide form. HRESIMS analysis was carried out to confirm an additional oxygen atom in the structure. Compound 1 exhibited a parent [M + H]+ ion at m/z 318.13362 in its HRESIMS spectrum, suggesting the molecular formula C17H20NO5 (calcd. 318.13360), and confirming 1 as haemanthamine N-oxide. Haemanthamine N-oxide (1) was obtained here for the first time from a natural source, even though it has already been obtained by synthesis.37 The complete 1D and 2D NMR data are shown in Table 1.
The confirmation of the absolute stereochemistry of 1
was achieved through circular dichroism (CD). Negative and positive Cotton effects were observed at 245 and 294 nm, whose absorptions were in agreement with the haemanthamine-type skeleton.38
LS(+)-MS and PS(+)-MS
Figure 3 displays the LS(+) mass spectra for bulb and leaf analyses of H. aulicum, which had a similar chemical profile. Signals varying from m/z 280 to 400 were detected as protonated molecules, [M + H]+. A similar
m/z distribution has been observed for Hibiscus species.16 Table 3 shows measured m/z values, mass error (ppm), DBE and molecular formula of the main compounds detected by the LS(+)-MS technique, where 10 and 8 species were identified in bulb and leaf, respectively. The ions of m/z 302, 318, 320, 332 and 348 are the most abundant species found, having double bond equivalents (DBEs) of 7-9. These species correspond to alkaloids, presenting odd molecular weight values from molecular formula of neutral species (M). As a consequence, an odd number of nitrogen is detected in their chemical structure, N1Ox class, where x = 4-6 (Table 3). The species of m/z 302.1387 and 320.1858 ([C17H19NO4 + H]+ and [C18H25NO4 + H]+ ions) correspond to haemanthamine (16) and/or its isomers and aulicine (15), respectively (Figure 1). The high relative intensity detected for these species is in good agreement with the CGC-MS data (Table 2). Compounds with m/z 318.1337, 332.1492 and 348.1809 ([C17H19NO5 + H]+, [C18H21NO5 + H]+ and [C19H25NO5 + H]+ ions, respectively) correspond to haemanthamine N-oxide (1) and its isomer, tazettine/petrazettine (18-19), and nerinine (10), respectively. The first compound is an isobar of galanthine (21), M = C18H23NO4, which was only detected by the CGC-MS technique (Table 2). The ion of m/z 288.1233, detected only in bulbs, corresponds to the [C16H17NO4 + H]+ ion, that is, lycorine (25), 11-hydroxyvittatine (24) or hamayne (20). The galanthamine (4) isobar, M = C17H21NO3 and Mw 287 Da, was not identified, as indicated in Table 2. Another alkaloid was detected from LS(+)-MS as a [C18H25NO5 + H]+ ion of
m/z 336 (Table 3), although no chemical structure has been proposed so far. The only species not classified as an alkaloid was detected by LS(+)-MS as a sugar: an adduct sucrose, [C12H22O11 + K]+ ion of m/z 381.0801.
Figure 3. LS(+)-FT-ICR mass spectra for bulb and leaf analysis of H. aulicum.
Table 3. Measured m/z values, mass error (ppm), DBE and molecular formula of main compounds detected from LS(+)-MS and PS(+)-MS data for H. aulicum
Proposed alkaloid
LS-MSa PS-MSb
m/zmeasured Error / ppm DBEe [M + H]+ Bulb Leaf Bulbs
c Leavesd
IB IIB IA IIA
Hamayne (20) or 11-hydroxyvittatine (24) orlycorine (25)
X − − X − − 288.12288 0.55 9 [C16H17NO4 + H]+
Haemanthamine (16) or crinamine (17) or 8-O-demethylhomolycorine (30)
X X X X X X 302.13868 0.02 9 [C17H19NO4 + H]+
Homolycorine (27) X X − − − − 316.15443 0.30 9 [C18H21NO4 + H]+
Haemanthidine (22) or 6-epihaemanthidine (23) or haemanthamine N-oxide (1)
X X X X − X 318.13369 0.29 9 [C17H19NO5 + H]+
− X − − − − 356.08986 1.06 [C17H19NO5 + K]+
Aulicine (15) X X X X X X 320.18577 0.42 7 [C18H25NO4 + H]+
Tazettine (18) or pretazettine (19) X X X X − X 332.14924 0.03 9 [C18H21NO5 + H]+
− X − X X X X 336.18058 0.08 7 [C18H25NO5 + H]+
2α-Methoxyhomolycorine (31) X X X − − X 346.16562 0.72 9 [C19H23NO5 + H]+
Nerinine (10) X X X X X X 348.18086 0.91 8 [C19H25NO5 + H]+
7-Methoxy-O-methyllycorenine (12) − − X X X X 362.19673 1.46 8 [C20H27NO5 + H]+
− − − − X X − 376.17629 2.19 9 [C20H25NO6 + H]+
Sucrose or isomers X X − − − − 381.08008 1.86 2 [C12H22O11 + K]+
(Figure 5a) and PS(+)-MS (Figure 5b). In general, a good agreement is observed between the ambient MS techniques. LS(+)-MS has proved to be a promising approach for the identification of alkaloids from Hippeastrum aulicum (Ker Gawl.) Herb. and should be explored in future work with other species, since it is a fast and easy analysis requiring no prior step of sample preparation.
Conclusions
The phytochemical investigation of Hippeastrum aulicum resulted in the identification of thirty-one
Figure 4. PS(+)-FT-ICR mass spectra from n-Hex and EtOAc extracts of bulbs and leaves for H. aulicum.
Figure 5. Comparison of relative intensity of main ions detected from LS(+) and PS(+)-FT-ICR MS of bulbs and leaves for H. aulicum.
from 200 to 400, DBEs of 7-10 and exact mass lower than 2 ppm. Regarding the chemical structure of alkaloids, their carbon number varied from C16 to C20, containing NOx as the heteroatom class, where x = 4-6. Among the main species detected were compounds with m/z 302, 318, 320, 332 and 348, which correspond to haemanthamine (16) and/or its isomers (17 and 30), haemanthamine N-oxide (1) and its isomers (22 and 23), aulicine (15), tazettine/pretazettine (18
and 19), and nerinine (10), respectively. Similar LS(+)-MS and PS(+)-MS results were obtained from leaf and bulb surfaces. Taken together, the results obtained from ambient ionization MS demonstrated a notable agreement with the CGC-MS analysis.
Supplementary Information
Spectra and NMR data of all isolated alkaloids are available free of charge at http://jbcs.sbq.org.br.
Acknowledgments
The authors thank R. P. Camargo for collecting the plant material. The authors also thank CAPES-PVE (No. 88881.030427/2013-01), CNPq (445987/2014-6), CAPES (23038.007083/2014-40), FAPES (65921380/2013) and NCQP-UFES.
References
1. Bastida, J.; Berkov, S.; Torras-Claveria, L.; Pigni, N. B.; de Andrade, J. P.; Martínez, V.; Codina, C.; Viladomat, F. In Recent Advances in Pharmaceutical Sciences; Muñoz-Torrero, D., ed.; Transworld Research Network: Kerala, 2011.
2. Cortes, N.; Alvarez, R.; Osorio, E. H.; Alzate, F.; Berkov, S.; Osorio, E.; J. Pharm. Biomed. Anal.2015, 102, 222.
3. Shawky, E.; Abou-Donia, A. H.; Darwish, F. A.; Toaima, S. M.; Takla, S. S.; Pigni, N. B.; Bastida, J.; Chem. Biodiversity2015,
12, 1184.
4. Hubert, J.; Nuzillard, J.-M.; Renault, J.-H.; Phytochem. Rev.
2015, DOI 10.1007/s11101-015-9448-7.
5. Berkov, S.; Bastida, J.; Sidjimova, B.; Viladomat, F.; Codina, C.; Chem. Biodiversity2011, 8, 115.
6. Kreh, M.; Matusch, R.; Witte, L.; Phytochemistry1995, 38, 773. 7. Alberici, R. M.; Simas, R. C.; Sanvido, G. B.; Romão, W.;
Lalli, P. M.; Benassi, M.; Cunha, I. B. S.; Eberlin, M. N.; Anal. Bioanal. Chem.2010, 398, 265.
8. Harris, G. A.; Galhena, S.; Fernández, F. M.; Anal. Chem.2011,
83, 4508.
9. Pereira, I.; Rodrigues, S. R. M.; Carvalho, T. C.; Carvalho, V. V.; Sanz Lobon, G.; Bassane, J. F.; Domingos, E.; Romão, W.; Augusti, R.; Vaz, B. G.; Anal. Methods2016, 8, 6023.
10. Klampfl, C. W.; Himmelsbach, M.; Anal. Chim. Acta 2015, 890, 44.
11. Snyder, D. T.; Schilling, M. C.; Hochwender, C. G.; Kaufman, A. D.; Anal. Methods2015, 7, 870.
12. Garrett, R.; Rezende, C. M.; Ifa, D. R.; Anal. Methods2013, 5, 5944.
13. Soparawalla, S.; Tadjimukhamedov, F. K.; Wiley, J. S.; Ouyang, Z.; Cooks, R. G.; Analyst2011, 136, 4392.
14. Mazzotti, F.; di Donna, L.; Taverna, D.; Nardi, M.; Aiello, D.; Napoli, A.; Sindona, G.; Int. J. Mass Spectrom.2013, 352, 87. 15. Deng, J.; Yang, Y.; Anal. Chim. Acta2013, 785, 82.
16. Muller, T.; Cooks, R. G.; Bull. Korean Chem. Soc.2014, 35, 919.
17. Schrage, M.; Shen, Y.; Claassen, F. W.; Zuilhof, H.; Nielen, M. W.; Chen, B.; van Beek, T. A.; J. Chromatogr. A 2013, 1317, 246.
18. de Andrade, J. P.; Guo, Y.; Font-Bardia, M.; Calvet, T.; Dutilh, J.; Viladomat, F.; Codina, C.; Nair, J. J.; Zuanazzi, J. A. S.; Bastida, J.; Phytochemistry2014, 103, 188.
19. Pabuççuaglu, V.; Richomme, P.; Gözler, T.; Kivçak, B.; Freyer, A. J.; Shamma, M.; J. Nat. Prod. 1989, 52, 785.
20. Bastida, J.; Codina, C.; Viladomat, F.; Rubiralta, M.; Quirion, J. C.; Husson, H. P.; Ma, G. E.; J. Nat. Prod. 1990, 53, 1456. 21. Suau, R.; Gomez, A. I.; Rico, R.; Phytochemistry1990, 29,
1710.
22. Likhitwitayawuid, K.; Angerhofer, C. K.; Chai, H.; Pezzuto, J. M.; Cordell, G. A.; Ruangrungsi, N.; J. Nat. Prod.1993, 56, 1331.
23. Bastida, J.; Lavilla, R.; Viladomat, F. In The Alkaloids; Cordell, G. A., ed.; Elsevier: Amsterdam, 2006, p. 87.
24. Portela-Cubillo, F.; Scott, J. S.; Walton, J. C.; J. Org. Chem.
2008, 73, 5558.
25. Lamoral-Theys, D.; Andolfi, A.; Van Goietsenoven, G.; Cimmino, A.; Le Calvé, B.; Wauthoz, N.; Mégalizzi, V.; Gras, T.; Bruyère, C.; Dubois, J.; Mathieu, V.; Kornienko, A.; Kiss, R.; Evidente, A.; J. Med. Chem.2009, 52, 6244.
26. Osorio, E. J.; Berkov, S.; Brun, R.; Codina, C.; Viladomat, F.; Cabezas, F.; Bastida, J.; Phytochem. Lett. 2010, 3, 161. 27. Carvalho, T. C.; Oliveira, I. F.; Tose, L. V.; Vanini, G.; Kill, J.
B.; Neto, A. C.; Machado, L. F.; Laboissiere, J. C.; Junior, V. L.; Vaz, B. G.; Romão, W.; Anal. Methods2016, 8, 614. 28. Colletes, T. C.; Garcia, P. T.; Campanha, R. B.; Abdelnur, P. V.;
Romão, W.; Coltro, W. K. T.; Vaz, B. G.; Analyst2016, 141, 1707.
29. Oliveira, B. G.; Costa, H. B.; Ventura, J. A.; Kondratyuk, T. P.; Barroso, M. E. S.; Correia, R. M.; Pimentel, E. F.; Pinto, F. E.; Endringer, D. C.; Romão, W.; Food Chem.2016, 204, 37. 30. Boit, H. G.; Döpke, W.; Naturwissenschaften1960, 47, 109. 31. de Andrade, J. P.; Pigni, N. B.; Torras-Claveria, L.; Berkov, S.;
Codina, C.; Viladomat, F.; Bastida, J.; J. Pharm. Biomed. Anal.
32. de Andrade, J. P.; Pigni, N. B.; Torras-Claveria, L.; Guo, Y.; Berkov, S.; Reyes-Chilpa, R.; El Amrani, A.; Zuanazzi, J. A. S.; Codina, C.; Viladomat, F.; Bastida, J.; Rev. Latinoam. Quim.
2012, 40, 83.
33. Ibuka, T.; Irie, H.; Kato, A.; Uyeo, S.; Tetrahedron Lett.1966,
39, 4745.
34. Kinstle, T. H.; Wildman, W. C.; Brown, C. L.; Tetrahedron Lett.
1966, 39, 4659.
35. Duffield, A. M.; Aplin, R. T.; Budzikiewicz, H.; Djerassi, C.; Murphy, C. F.; Wildman, W. C.; J. Am. Chem. Soc. 1965, 87, 4902.
36. Berkov, S.; Viladomat, F.; Codina, C.; Suárez, S.; Ravelo, A.; Bastida, J.; J. Mass Spectrom. 2012, 47, 1065.
37. Cédron, J. C.; Gutiérrez, D.; Flores, N.; Ravelo, A. G.; Estévez-Braun, A.; Bioorg. Med. Chem. 2012, 20, 5464.
38. De Angelis, G. G.; Wildman, W. C.; Tetrahedron1969, 25, 5099.
Submitted: May 5, 2016 Published online: August 12, 2016