Article
Printed in Brazil - ©2013 Sociedade Brasileira de Química0103 - 5053 $6.00+0.00
A
*e-mail: [email protected]
Blends of Soybean Biodiesel with Petrodiesel: Direct Quantitation via Mass Spectrometry
Patrícia V. Abdelnur,*,a,b Sergio A. Saraiva,b Rodrigo R. Catharino,b,c Mirela Coelho,b Nicolas Schwab,b
Camila M. Garcia,d Ulf Schuchardt,d Vanderléa de Souzae and Marcos N. Eberlinb
aNational Center for Agroenergy Research, Brazilian Enterprise for Agricultural Research,
EMBRAPA Agroenergy, 3448-4246 Brasília-DF, Brazil
bThoMSon Mass Spectrometry Laboratory, Institute of Chemistry, cInnovare Biomarkers Laboratory, School of Medical Sciences and
dPhoenix Laboratory, Institute of Chemistry,
University of Campinas, 13083-970 Campinas-SP, Brazil
eNational Institute of Metrology, Standardization and Industrial Quality,
Directorate of Industrial and Scientific Metrology, Division of Chemical Metrology, 25250-020 Duque de Caxias-RJ, Brazil
Quantificação e identificação de misturas de biodiesel de soja com petrodiesel foram realizadas via espectrometria de massas utilizando duas técnicas de ionização: electrospray (ESI) e
Venturi easy ambient sonic-spray em seu modo líquido (VL-EASI). Diferentes misturas de biodiesel/
petrodiesel (de B0 até B100) foram diluídas e diretamente injetadas e analisadas por ambas as técnicas. Para investigar a adulteração em blendas Bn, misturas óleo de soja/biodiesel e óleo de soja/petrodiesel foram analisadas. Curvas analíticas foram obtidas em triplicata. As duas técnicas apresentaram quantificação suficientemente precisa na faixa de B1-B20. Estas técnicas foram úteis também na detecção de contaminação ou adulteração das misturas Bn com óleos vegetais. A técnica de ESI é hoje largamente difundida e comercialmente acessível enquanto que uma fonte de VL
-EASI pode ser facilmente montada usando peças comuns de laboratório dispensando a aplicação de altas voltagens. As duas técnicas não necessitam de etapas de pré-separação ou derivatização e, portanto, oferecem métodos simples e rápidos para quantificação de misturas Bn. A detecção instantânea e abrangente da composição molecular permite o controle de qualidade e tipificação de biodiesel e, eventualmente, de óleos vegetais em misturas ilegais.
Quantitation and identification of blends of soybean biodiesel with petrodiesel were performed via mass spectrometry using two ionization techniques: electrospray ionization (ESI) and Venturi easy ambient sonic-spray ionization in its liquid mode (VL-EASI). Different soybean biodiesel/
petrodiesel blends (from B0 to B100) were diluted and then directly infused and analyzed by both techniques. To investigate adulteration of Bn blends, different soybean oil/biodiesel and soybean oil/petrodiesel blends were analyzed. Analytical curves were obtained in three replicates. The two techniques were shown to provide reasonably accurate quantitation in the B1-B20 range. These techniques were also successfully used to detect contamination or adulteration of Bn blends with vegetable oils. ESI is a widely used and commercially available technique whereas a VL-EASI
source can be easily mounted using common laboratory parts requiring no use of high voltages. Both techniques require no pre-separation or derivatization steps and offer, therefore, simple and fast methods for the quantitation of Bn blends. The comprehensive snapshots of the molecular composition also allow quality control and typification of the biodiesel and eventually of the vegetable oils in illegal admixtures.
Introduction
Fatty acid methyl and ethyl esters derived from vegetable oils, commonly known as biodiesels, are receiving considerable attention as alternative engine fuels since their properties are very similar to petrodiesel and can therefore be used in compression-ignition engines without modification.1,2 Nevertheless, successful
commercialization and market acceptance of biodiesels require a strong effort in assuring their fuel properties and product quality.3 However, quality control is challenging
for biodiesels since their composition varies due to the many feedstock used for its production, and their use occurs mainly as admixtures with petrodiesel, which are known as Bn blends (where n stands for the v/v percentage of biodiesel). In Brazil, for instance, B5 is currently the mandatory blend used for commercialization.4
The analytical methods commonly used to evaluate fuel quality and monitor biodiesel production5 are based mainly
on chromatographic methods, such as gas chromatography (GC),6 high-performance liquid chromatography
(HPLC)7 and gel permeation chromatography (GPC)5,8 or
spectroscopic methods such as nuclear magnetic resonance (NMR),9-11 near-infrared (NIR),12 Fourier transform infrared
spectroscopy (FTIR)13 and FT-Raman spectroscopy.14,15 To
determine the “n%” of Bn blends, spectroscopic techniques seem to be ideal since they are fast and easily adapted for routine process analysis. GC is less suitable for Bn quantitation due to the complexity of the chromatograms caused by the numerous components of conventional diesel fuel.16 HPLC has shown, however, to provide proper
quantitation of Bn blends.17
IR spectroscopy has also been applied to quantitate Bn blends using the area of the band corresponding to the carbonyl moiety at 1740 cm-1.18,19 IR may suffer, however,
from interferences such as blends contaminated with vegetable oil or other impurities bearing carbonyl groups. NIR spectroscopy has also been applied for Bn quantitation, allowing the discrimination between biodiesel and vegetable oils by monitoring differences in the spectra of methyl esters and triacylglicerides (TAGs), the main compounds in vegetable oils.201H NMR spectroscopy also allows Bn
quantitation since the signal for the methylenic and methynic hydrogen atoms (CH2 and CH) of the glycerol portion of the
vegetable oils absorbs in different frequencies than those from the methoxy groups (O−CH3) of biodiesel molecules.
20
Mass spectrometry (MS) is a very promising technique for Bn quantitation and quality control due to its high chemical selectivity and high speed of analysis.21
Several complex mixtures, such as food products,22
vegetable oils,23 petrofuels24 and biodiesel25,26 have been
successfully analyzed by direct MS approaches without pre-separation or derivatization steps. Furthermore, with the introduction of a diverse set of ambient desorption/ionization techniques,27 MS analysis can be
more easily performed,28 with minimal requirements for
sample handling and preparation. These ambient MS approaches enable the direct MS analysis of samples in their natural environment or matrices, or by the use of auxiliary surfaces. Easy ambient sonic-spray ionization (EASI)29 is
one of such ambient techniques, and has been widely used for the analysis of different analytes and matrices, such as drug tablets,29 fabric softeners,30 natural products31 and
fuels.32-34 EASI-MS is a spray-based desorption/ionization
technique that requires only the assistance of compressed nitrogen or air.28 A simplified version of EASI was recently
developed, Venturi EASI (V-EASI),35 which incorporates
Venturi self-pumping, eliminating therefore the need for electrical pumping. V-EASI has been shown to handle both solid (Vs-EASI) and liquid (VL-EASI) samples.35
Our group has shown in previous works36,37 that
direct infusion ESI-MS in both positive and negative ion modes allows fast fingerprinting and quality control of biodiesels. In the negative ion mode, ESI(−)-MS provides profiles of the free fatty acids (FFA), which function as natural chemotaxonomic markers for the parent animal fat or vegetable oil. EASI(+)-MS has been also used to characterize and to control the quality of biodiesel via profiles of the fatty acid methyl esters (FAME).32,33 Augusti and
co-workers38 have also provided evidence that direct ESI-MS
can be used to quantify Bn blends. Eberlin and co-workers39
have also shown that EASI-MS is able, using an internal standard, to quantitate and monitor the quality of soybean biodiesel/petrodiesel (Bn) blends with results compared to those obtained by nuclear magnetic resonance (NMR) spectroscopy and mid-infrared (IR) spectroscopy. In this study, a comprehensive investigation and a comparison of the ability of ESI and VL-EASI techniques to provide
accurate, simple and fast approaches to quantitate and to control the quality of Bn blends are described. These two direct ionization techniques were applied to sample solutions (no desorption was employed).
Experimental
Chemical reagents and samples
levels of the blends in the following proportions: 1, 2, 5, 10, 20 and 50%. Blends of soybean biodiesel and soybean oil were also prepared in the 5 to 50% v/v range. A single blend was prepared adding 10% of soybean oil in petrodiesel. The experimental design of all sample preparation was performed in three replicates for each sample, which was diluted ten times in methanol before analysis.
General experiment procedures
ESI-MS spectra were obtained in the positive ion mode in a Q-ToF mass spectrometer (Micromass, Manchester, UK) equipped with a TriVersa NanoMate® (Advion
BioSciences, Ithaca, NY, USA) robotic nanoflow ion source. Nanoelectrospray chips with the diameter of spraying nozzles of 4.1 mm were used. The ion source was controlled by a Chipsoft 8.3.1 software (Advion BioSciences, Ithaca, NY, USA). Ionization voltage was +1.4 kV and backpressure was set at 0.3 psi. Q-ToF major parameters were: cone voltage 35 V, extractor 4 V, source temperature 100 °C and desolvation temperature 100 °C.
Aliquots of 100 µL of sample (diesel, soybean oil, biodiesel, and diesel/biodiesel, diesel/soybean oil and biodiesel/soybean oil blends) were transferred to a flask containing 900 µL of a methanol/toluene (1:1) and 0.1% formic acid solution. After shaking for 30 s using a vortex and 5 min of centrifugation, 100 µL of this solution were taken and diluted to 1 mL of total volume with methanol containing 0.1% of formic acid. The resulting solution was then directly infused using the TriVersa NanoMate® source. All the ESI(+)-MS data were analyzed
by using the MassLynx 4.1 software (Waters, Manchester, UK). Mass spectra were accumulated over 60 s to generate final data ranging from m/z 100 to 1000. ESI(+)-MS data were analyzed and the analytical curves were plotted for the quantification of these blends.
VL-EASI-MS experiments were performed in the positive
ion mode using an ion trap mass spectrometer (HCT ETD II System from Bruker, Bremen, Germany) and a homemade VL-EASI ionization source described in details elsewhere.
34
The sonic-spray ionization for VL-EASI was assisted by
compressed N2 at ca. 10 bar and a flow of 3.5 L min -1. The
VL-EASI source33 used a simple Swagelok T-element with
appropriate ferrules and a 53 mm long stainless steel needle for the gas flow (i.d. = 400 µm and o.d. = 728 µm) and a fused-silica capillary (i.d. = 100 µm and o.d. = 125 µm) at the sonic-spray exit for the liquid flow. Pumping of the analyte or spray solution was caused by the Venturi effect at a flow rate of ca. 10-15 µL min-1. Mass spectra were acquired over the
m/z 50-1000 range.
Aliquots of 100 µL of sample (diesel, biodiesel, and biodiesel blends) were transferred to a flask containing 900 µL of a methanol and 0.1% formic acid solution. All the VL-EASI(+)-MS data were analyzed by using the Esquire
Control 6.2 and Data Analysis software (Bruker, Bremen, Germany). Mass spectra were accumulated over 60 s to generate final data ranging from m/z 100-1000.
Results and Discussion
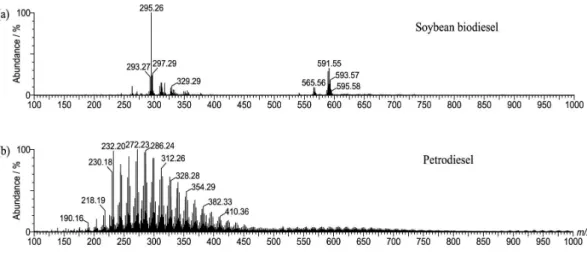
ESI(+)-MS of the pure soybean biodiesel (B100) and pure petrodiesel (B0) were found to be very distinct and characteristic, as shown in Figure 1. The mass spectrum of B100 (Figure 1a) shows the characteristic set of ions for FAME,32 in which the protonated FAME molecules from
linoleic acid predominate, that is, the [FAME + H+] ion of
m/z 295.26 (m/z 295.264 calculated for [C19H34O2 + H+]),
with minor [FAME + H]+ ions from esters of oleic acid,
m/z 297.29 (m/z 297.279 calculated for [C19H36O2 + H+]) and
linolenic acid, m/z 293.27 (m/z 293.248 calculated for [C19H33O2 + H+]). Another set of ions of m/z 591 is due
to [FAME−H−FAME]+ proton-bound dimers. The ESI(+)
mass spectrum of petrodiesel (Figure 1b) also shows a very unique and rich profile of polar markers mainly comprised of a homologous series of N-polycyclic heteroaromatic compounds,40 that is, a homologous series of alkylpyridines.41
Figure 2 shows the ESI(+) mass spectra obtained for Bn blends. To assure the most accurate possible quantitation, a robotic nanoflow ion source with nanoelectrospray chip was employed. The B1, B2, B5, B10 and B20 blends are readily recognized mainly due to the detection and prominence of the characteristic FAME ions of m/z 295 and 589 (the protonated molecule from linoleic acid methyl ester and its proton bound dimer, respectively). Note that for B20, the FAME ions are predominant but the homologous series of marker ions for petrodiesel are still recognized. For blends higher than B20, however, the petrodiesel ions are drastically suppressed (spectra not shown), which result therefore in poor mass spectral distinction between these Bn.
Figure 3 shows the analytical curve for the B1-B20 blends using the abundance ratio for the m/z 272 ion (the most abundant for petrodiesel) and that of m/z 295 (the protonated molecule of the major FAME ion of soybean biodiesel). Note that the accurate quantitation (R2 = 0.993) Figure 2. ESI(+)-MS for diluted solutions of (a) B1, (b) B2, (c) B5, (d) B10 and (e) B20 blends.
is obtained in a direct and rapid fashion using the robotic nanochip ESI(+) source.
ESI(+)-MS was also tested in its ability to detect contamination of soybean biodiesel and petrodiesel with soybean oil, for adulteration and quality control purposes. Figure 4 shows, for instance, the ESI(+)-MS of 10% of soybean oil in biodiesel, and 10% of soybean oil in petrodiesel. According to the literature,42 the most
dominant TAG fatty acid moieties in edible oils are from palmitic (P, 16:0), stearic (S, 18:0), oleic (O, 18:1), linoleic (L, 18:2) and linolenic acids (Ln, 18:3). In both cases, the characteristic soybean oil TAG ions in their [TAG + Na]+
forms: PLL (m/z 855), PLO (m/z 857), POO (m/z 859), LLLn (m/z 877), LLL (m/z 879), LLO (m/z 881), OOL (m/z 883), and OOO (m/z 885)32 were promptly detected,
despite their lower ionization efficiencies when compared to the FAME molecules. A limit of detection of ca. 5% v/v for both admixtures was achieved. Note that the most abundant ion detected for the TAG components was that of LLL (m/z 879), followed by PLL (m/z 855).
An analytical curve for the addition of soybean oil in soybean biodiesel was also constructed (Figure 5). For this curve, the ratio of the total abundances of the two most abundant ions for the soybean oil (m/z 879) and soybean biodiesel (m/z 295) was plotted to minimize fluctuations in abundances that could occur due to instrument variability. Note that the use of the ion ratio and a robotic nanochip ESI(+)-MS source provides a quite good correlation of ca. R2 = 0.993 in the range of 5-50% v/v.
The VL-EASI source in the liquid mode also applicable
to sample solutions was also tested for Bn analysis and quantitation. Figure 6 shows a scheme of the fully direct VL-EASI analysis whereas Figure 7 shows representative
VL-EASI spectra for petrodiesel (B0), soybean biodiesel
(B100) and a typical B10 blend. Note in Figure 6 the
simplicity of the VL-EASI setup, which uses simple
laboratory parts and requires no electrical pumping, no voltages or heating, and demands only the assistance of compressed nitrogen (or a can of compressed air).35
As for ESI(+)-MS, VL-EASI(+)-MS also provides
proper quantitation of Bn blends in the 1-20% range with quite similar figures of merits. An analytical curve was constructed for VL-EASI(+)-MS (not shown), and as
expected for a less stable source (as compared to the robotic
Figure 4. ESI(+)-MS for (a) a diluted methanolic solution of 10% of soybean oil in biodiesel, and (b) 10% of soybean oil in petrodiesel.
Figure 5. Analytical curve for blends of soybean biodiesel and soybean oil (n = 3).
Figure 6. Schematic representation of the VL-EASI analysis of Bn blends.
nanochip Nanomate source), less accurate quantitation was noted (R2 = 0.980). The accuracy of V
L-EASI, however, is
still acceptable, especially when considering its extremely low cost and high simplicity.
Conclusions
Both the widely used and commercially available ESI(+) technique using a robotic nanochip source and the non-commercial VL(+)-EASI technique using a source that
can be easily mounted using common laboratory parts and that requires no use of high voltages have been found to offer interesting alternatives for the quantitation and quality control of Bn blends in the B1-B20 range. If an internal standard is used, as demonstrated recently for the EASI technique,39 an even more direct desorption/ionization
approach can be employed for proper quantitation and quality control. Screening and characterization of contamination or adulteration with vegetable oils are also feasible. Since no pre-separation or derivatization steps are required, these techniques offer therefore fast methods for Bn quantitation and sample characterization at the molecular level. For improved accuracy, a robotic nanochip ESI(+) source could be employed. These techniques also provide comprehensive snapshots of the molecular composition, hence detection of other impurities as well as the detection and typification of vegetable oils present in illegal admixtures are feasible.
Acknowledgements
We thank the following Brazilian research foundations CNPq, FAPESP, FAPERJ and FINEP for financial support.
References
1. Schuchardt, U.; Serchel, R.; Vargas, R. M.; J. Braz. Chem. Soc.
1998, 9, 199.
2. Costa Neto, P. R.; Rossi, L. F. S.; Zagonel, G. F.; Ramos, L. P.;
Quim. Nova2000, 23, 531.
3. Knothe, G.; J. Am. Oil Chem. Soc. 2006, 83, 823.
4. http://www.mme.gov.br/mme/galerias/arquivos/conselhos_ comite/CNPE/resolucao_2009/Resoluxo_6_CNPE.pdf, accessed in June 2012.
5. Knothe, G.; Trans. ASAE2001, 44, 193.
6. Plank, C.; Lorbeer, E.; J. Chromatogr., A1995, 687, 461. 7. Holcapek, M.; Jandera, P.; Fischer, J.; Prokes, B.;
J. Chromatogr., A 1999, 858, 13.
8. Dube, M. A.; Zeng, S.; McLean, D.; Kates, M.; J. Am. Oil Chem. Soc.2004, 81, 599.
9. Costa Neto, P. R.; Caro, M. S. B.; Mazzuco, L. M.; Nascimento, M. G.; J. Am. Oil Chem. Soc.2004, 81, 1111.
10. Geldard, G.; Bres, O.; Vargas, R. M.; Vielfaure, F.; Schuchardt, U. F.; J. Am. Oil Chem. Soc. 1995, 72, 1239.
11. Knothe, G.; J. Am. Oil Chem. Soc. 2000, 77, 489. 12. Knothe, G.; J. Am. Oil Chem. Soc.1999, 76, 795.
13. Zagonel, G. F.; Peralta-Zamora, P.; Ramos, L. P.; Talanta 2004,
63, 1021.
14. Ghesti, G. F.; Macedo, J. L.; Braga, V. S.; Souza, A. T. C. P.; Parente, V. C. I.; Figueiredo, E. S.; Resck, I. S.; Dias, J. A.; Dias, S. C. L.; J. Am. Oil Chem. Soc. 2006, 83, 597.
15. Ghesti, G. F.; Macedo, J. L.; Resck, I. S.; Dias, J. A.; Dias, S. C. L.; Energy Fuels 2007, 21, 2475.
16. Faria, R. C. M.; Rezende, M. J. C.; Rezende, C. M.; Pinto, A. C.;
Quim. Nova 2007, 30, 1900.
17. Floglia, T. A.; Jones, K. C.; Phillips, J. G.; J. Chromatogr., A
2005, 1122, 153.
18. Birová, A.; Svajdlenka, E.; Cvengros, J.; Dostaliková, V.; Eur. J. Lipid Sci. Technol. 2002, 104, 271.
19. Guarieiro, L. L. N.; Pinto, A. C.; de Aguiar, P. F.; Ribeiro, N. M.;
Quim. Nova2008, 31, 421.
20. Knothe, G.; J. Am. Oil Chem. Soc.2001, 78, 1025; Monteiro, M. R.; Ambrozin, A. R. P.; Lião, L. M.; Ferreira, A. G; Fuel
2009, 88, 691; Monteiro, M. R.; Ambrozin, A. R. P.; Lião,
L. M.; Boffo, E. F.; Pereira-Filho, E. R.; Ferreira, A. G.; J. Am. Oil Chem. Soc.2009, 86, 581; Monteiro, M. R.; Ambrozina,
A. R. P.; Santos, M. S.; Boffo, E. F.; Pereira-Filho, E. R.; Lião, L. M.; Ferreira, A. G.; Talanta2009, 78, 660.
21. Dass, C.; Fundamental of Contemporary Mass Spectrometry, 1st ed.; John Wiley and Sons: New Jersey, USA, 2007. 22. Abdelnur, P. V.; Abe, S.; Cunha, I. B. S.; Lima-Pallone, J. A.;
Godoy, H. T.; Eberlin, M. N.; Catharino, R. R.; Qual. Assur. Saf. Crops Foods 2011,3, 185.
23. Riccio, M. F.; Sawaya, A. C. H. F.; Abdelnur, P. V.; Saraiva, S. A.; Haddad, R.; Eberlin, M. N.; Catharino, R. R.; Anal. Lett.
2011,44, 1489.
24. Corilo, Y. E.; Vaz, B. G.; Simas, R. C.; Nascimento, H. D. L.; Klitzke, C. F.; Pereira, R. C. L.; Bastos, W. L.; Neto, E. V. S.; Rodgers, R.; Eberlin, M. N.; Anal. Chem. 2010, 82, 3990. 25. Alberici, R. M.; Simas, R. C.; Abdelnur, P. V.; Eberlin, M. N.;
Souza, V.; de Sá, G. F.; Daroda, R. J.; Energy Fuels 2010, 24, 6522.
26. Soares, I. P.; Russo, R. M. O.; Prates, R. G. D.; Augusti, R.; Fortes, I. C. P.; Pasa, V. M. D.; Quim. Nova 2011, 34, 1439. 27. Alberici, R. M.; Simas, R. C.; Sanvido, G. B.; Romão, W.;
Laali, P. M.; Benassi, M.; Cunha, I. B. S.; Eberlin, M. N.; Anal. Bioanal. Chem. 2010, 398, 265.
28. Schwab, N. V.; Eberlin, M. N.; Drug Test. Anal.2013, 5, 137. 29. Haddad, R.; Sparrapan, R.; Eberlin, M. N.; Rapid Commun.
Mass Spectrom.2006, 20, 2901.
30. Saraiva, S. A.; Abdelnur, P. V.; Catharino, R. R.; Nunes, G.; Eberlin, M. N.; Rapid Commun. Mass Spectrom. 2009, 23, 357. 31. Sawaya, A. C. H. F.; Abdelnur, P. V.; Eberlin, M. N.;
Kumazawa, S.; Ahn, M. R.; Bang, K. S.; Nagarajae, N.; Bankova, V. S.; Afrouzan, H.; Talanta 2010,81, 100. 32. Abdelnur, P. V.; Eberlin, L. S.; Sa, G. F.; Souza, V.; Eberlin,
M. N.; Anal. Chem.2008, 80, 7882.
33. Eberlin, L. S.; Abdelnur, P. V.; Passero, A.; Sa, G. F.; Daroda, R. J.; Souza, V.; Eberlin, M. N.; Analyst 2009,134, 1652. 34. Alberici, R. M.; Simas, R. C.; Souza, V.; de Sá, G. F.; Daroda,
R. J.; Eberlin, M. N.; Anal. Chim. Acta 2010, 659, 15. 35. Santos, V. G.; Regiani, T.; Dias, F. F. G.; Romao, W.; Jara,
J. L. P.; Klitzke, C. F.; Coelho, F.; Eberlin, M. N.; Anal. Chem.
2011, 83, 1375.
36. Catharino, R. R.; Milagre, H. M. S.; Saraiva, A. S.; Garcia, C. M.; Schuchardt, U.; Eberlin, M. N.; Augusti, R.; Pereira, R. C. L.; Guimarães, M. J. R.; de Sá, G. F; Caixeiro, J. M. R.; Souza, V.; Energy Fuels 2007, 21, 3698.
37. Eide, I.; Zahlsen, K.; Energy Fuels 2007, 21, 3702.
38. Prates, R. G. D.; Augusti, R.; Fortes, I. C. P.; Energy Fuels 2010,
24, 3183.
39. Cunha, I. B. S.; Fernandes, A. M. A. P.; Tega, D. U.; Simas, R. C.; Nascimento, H. L.; de Sá, G. F.; Daroda, R. J.; Eberlin, M. N.; Alberici, R. M.; Energy Fuels2012, 26, 7018. 40. Haddad, R.; Regiani, T.; Klitzke, C. F.; Sanvido, G. B.;
Corilo, Y. E.; Augusti, D. V.; Pasa, V. M. D.; Pereira, R. C. C.; Romão, W.; Vaz, B. G.; Augusti, R.; Eberlin, M. N.; Energy Fuels2012, 26, 3542.
41. Zhan, D.; Fenn, J. B.; Int. J. Mass Spectrom. 2000, 194, 197. 42. Jakab, A.; Nagy, K.; Heberger, K.; Vekey, K.; Forgacs, E.; Rapid
Commun. Mass Spectrom. 2002, 16, 2291.
Submitted: September 17, 2012
Published online: May 21, 2013