Article
Printed in Brazil - ©2012 Sociedade Brasileira de Química0103 - 5053 $6.00+0.00
A
*e-mail: [email protected]
Characterization of Thermoplastic Starch/Poly(Lactic Acid) Blends Obtained by
Extrusion and Thermopressing
Carmen M. O. Müller,*,a,b Alfredo T. N. Piresb and Fabio Yamashitaa
aDepartamento de Ciência e Tecnologia de Alimentos, Universidade Estadual de Londrina,
Campus Universitário, 86051-990 Londrina-PR, Brazil
bDepartamento de Química, Universidade Federal de Santa Catarina,
Campus Universitário Trindade, 88040-900 Florianópolis-SC, Brazil
Blendas de poli(ácido láctico)(PLA) e amido termoplástico (TPS) foram preparadas por extrusão e moldagem por compressão utilizando 0,1, 0,2 e 0,3 g de PLA per g de TPS. O TPS
foi obtido por extrusão utilizando 0,25 e 0,30 g de glicerolporg de amido. Foram avaliadas as propriedades mecânicas e de barreira ao vapor de água, e determinadas as isotermas de sorção de umidade. A morfologia dos materiais foi avaliada através de microscopia eletrônica de varredura e as propriedades térmicas dos polímeros puros e das blendas, através de calorimetria diferencial de varredura (DSC). A microscopia e os resultados de DSC indicaram a imiscibilidade da blenda e a presença de duas fases. Nas blendas contendo 20% e 30% de PLA observou-se um aumento da tensão de ruptura e do módulo elástico. A blenda contendo 30% de PLA apresentou uma redução da permeabilidade ao vapor de água, comportamento associado à redução do coeficiente de difusão observada nesta amostra.
Blends of poly(lactic acid) (PLA)/thermoplastic starch (TPS) were prepared by extrusion and thermopressing, with proportions of 0.1, 0.2 and 0.3 g of PLA per g TPS. Thermoplastic starch
was obtained from the extrusion of 0.30 g or 0.25 g of glycerol per g of starch. The mechanical
properties and water vapor permeability were tested and water sorption isotherms were obtained. The morphological characteristics of the samples were observed through scanning electron microscopy (SEM) and the thermal properties of the pure polymers and the blends by differential scanning calorimetry (DSC). The SEM and DSC results indicated the immiscibility of the TPS/ PLA blends and the presence of two phases. For blends with 20% and 30% of PLA increases in the tensile strength and modulus were observed. The lowest water vapor permeability was observed for the blend with 30% of PLA, which is related to the lowest diffusion coefficient value observed for this sample.
Keywords: thermoplastic starch, poly(lactic acid), biodegradable blend
Introduction
The environmental impact of the increased consumption of plastics derived from petrochemicals and their consequent accumulation in the environment has stimulated the development of biodegradable materials from renewable resources. The use of starch as a raw material to produce films has been studied intensively in recent decades due to its wide application, in order to determine the limitations imposed by the use of this raw material. The benefits of starch include its low cost and wide availability, however,
its hydrophilic characteristic can lead to films with high water vapor permeability and poor mechanical properties compared to synthetic materials.1,2
One means to improve the characteristics of starch films is through the preparation of composites or blends with other materials such as fibers, nanoclays or biodegradable polymers. Studies on starch/polyester blends have focused on the incorporation of starch in the polyester matrix to reduce production costs and maintain the biodegradability.3-5
starch/PLA blends with and without the presence of maleic anhydride as a compatibilizer. The micrograph of the starch/ PLA blend obtained showed thermoplastic starch particle sizes ranging between 5 and 30 µm. The presence of maleic anhydride increased the elongation at break from 100 to 200%, compared with values of 50 to 20% for blends without maleic anhydride. However, the materials obtained from the grafting of maleic anhydride onto PLA showed a continuous phase, with small particle size (1 to 3 mm), which significantly decreased the ductility. Other studies have shown that the initial water content does not affect the mechanical or thermal properties of the PLA/starch blends. However, the water content caused an increase in the equilibrium moisture of the blend samples.7 Ke et al.8
evaluated the effect of the amylose content in PLA/starch blends containing more than 60% of starch and reported decreased tensile strength and elongation at break of the films, and increased moisture content in the blend, which was associated with the strong hydrophilicity of starch. On the other hand, Park et al.9 suggested that the starch
acted as a nucleating agent and the glycerol used as the plasticizer contributed to an improvement in the degree of crystallinity of blends.
The extrusion process has been proposed for the preparation of thermoplastic starch since it allows the incorporation of materials of different natures, ease of scale up, versatility and energy efficiency.
In this context, the aim of this study was to obtain and characterize blends of thermoplastic cassava starch and PLA by extrusion and thermopressing, and to assess their suitability for use as packaging materials.
Experimental
Materials
The cassava starch (Manihot esculenta) with 12% of
moisture and 19-25% of amylose, was kindly supplied by Indemil (Diadema-SP, Brazil). The poly(lactic acid) (average molecular weight of 190,000 g mol-1, according
to the manufacture) was purchased from Cargill Agrícola S.A. (Brazil) (Ingeo 2002, lot XA1428B122). Glycerol (analytical grade) was supplied by Dynamics (São Paulo, Brazil). All chemical reagents were used without further purification.
Preparation of thermoplastic starch
To evaluate the effect of the extrusion temperature on the crystallinity of the TPS, temperatures of 120 oC
and 160 oC were used in the extrusion process. Glycerol
(0.30 g of glycerol to 1 g of starch) was incorporated as
a plasticizer. The thermoplastic starch, for use as a blend component, was obtained from the physical mixture of 0.25 g or 0.30 g of glycerol to 1 g starch and subsequent extrusion using a single-screw BGM extruder (model EL-25, Brazil), with a L/D ratio of 30, four heating zones at 120 oC, and a speed of 35 rpm. The notations TPS25 and
TPS30 indicate the amount of glycerol in percentage in relation to one gram of starch in the initial mixture.
PLA/thermoplastic starch blends
The mixtures of TPS and PLA pellets with different compositions were extruded at a temperature of 150 oC in
the four heating zones. M1025, M2025 and M3025 denote 10, 20 and 30 g of PLA to 100 g of TPS25, respectively. Similarly, M1030, M2030 and M3030 represent 10, 20 and 30 g of PLA to 100 g TPS30, respectively. The cylindrical profiles were cooled to room temperature and cut to obtain the pellets. The pellets were then pressed at 150 ºC, using 6 ton for 3 min, in a Schultz thermopress (model 15T - Brazil) with hot plate temperature control and the films were subsequently maintained at room temperature.
Thermal analysis
DSC curves were obtained using ca. 5 mg of sample
in a Shimadzu DSC-50 (Japan) differential scanning calorimeter with heating from –100 °C to 250 °C at 10 °C min-1 in a nitrogen atmosphere (50 mL min-1). Only
one heating cycle was used in all of the thermo-analysis experiments.
Scanning electron microscopy (SEM)
The PLA disperse phase was extracted with chloroform from incompatible PLA/TPS blends. The blend specimens were fractured under liquid nitrogen. The fractured samples were subjected to different treatments: one part was placed in a desiccator containing silica for 24 h while another part was placed in a test tube and sufficient chloroform was added to cover the sample which was then left to stand for 24 h. These samples were subsequently washed with fresh solvent and placed in a desiccator with silica for 24 h. The specimens were coated with gold to avoid charging by the electron beam and analyzed by scanning electron microscopy (SEM, Philips XL 30).
Mechanical properties
analyzer (EMIC, Brazil), according to the ASTM D882-0210
for thin films. The specimens were kept at 23 oC with 58%
of relative humidity (RH) before analysis. To conduct the test, the strips were clamped between grips (50 mm initial distance between the grips) and distended at 50 mm min-1.
The elasticity modulus, tensile strength and elongation to break were calculated from the stress-strain curves considering the results of at least ten tests for each sample (TPSs and blends).
Moisture, thickness and density
Film thickness was measured using a Digimatic digital external micrometer (Mitutoyo Co., Japan) at five different points of the specimen. To determine the density, at least three specimens of 2 cm × 2 cm were maintained in a desiccator (0% RH) for 10 days until constant mass. The dry matter density was calculated through the ratio of dry mass (g) to the product of the area and thickness of the specimen. The moisture content of each specimen was determined in triplicate by the gravimetric method1 using
samples dried in an oven at 105 ºC for 24 h and expressed as g water (g dry mass)-1.
Water vapor permeability
The water permeability of the films was determined in appropriate diffusion cells, using a relative humidity (RH) of 2% (inside the cell) and 75% (outside the cell). The water vapor permeability was calculated using equation 1.11
(1)
were δ is the average film thickness, S is the film permeation area (0.005 m2), a
w1 (RH1/100) is the water activity in the
chamber, aw2 (RH2/100) is the water activity inside the
cell, Ps is the water vapor pressure at the experimental
system temperature (25 oC) and W (water mass/time) was
calculated using the linear regression of mass variation over time, under steady-state permeation. All tests were conducted in triplicate.
Sorption isotherms
The sorption isotherms were determined through the static method, using saturated saline solutions to obtain different relative humidity conditions.12 The samples were
previously dried for 10 days in desiccators containing silica. Samples with 0.500 ± 0.001 g (in triplicate) were then placed in desiccators containing different saturated
salt solutions providing values for the equilibrium relative humidity (ERH) of 11, 33, 43, 58, 75 and 81%. A hygrometer (Instrutemp, mod. ITHT 2210, São Paulo, Brazil) was used to control the relative humidity. The desiccators were placed for 15 days in an environment at 25 ± 2 ºC, until the samples reached the equilibrium moisture content. The Guggenheim-Anderson-de Boer (GAB) model was used to represent the experimental equilibrium data. The GAB model parameters were determined by non-linear regression, using the Statistica Software (version 7.0, Oklahoma, USA).
Water solubility coefficient and effective water diffusion coefficient
The water solubility coefficient of the films (g of water (g of dry mass Pa)-1) was determined according to
Muller et al.,1 based on the experimental moisture sorption
isotherms. The water diffusion coefficients for the films were determined from the water vapor permeability, water solubility coefficient of the film and the film density data.
Statistic analysis
Statistica software (Oklahoma, USA, 2004) version 7.0 was used for all statistical analysis. Analysis of variance (ANOVA) and the Tukey test for comparison of means were applied in the experimental data analysis. The significance level used was 0.05.
Results and Discussion
The melting temperature, enthalpy of fusion and degree of crystallinity of the starch/glycerol physical mixtures extruded at 120 ºC and 160 ºC (thermoplastic starch) were determined. The TPS enthalpy of fusion ranged between 57 J g-1 and 60 J g-1 for samples extruded
at 120 oC and 160 oC, respectively. As expected, the values
for the physical properties evaluated are not dependent on the extrusion process temperature, and the degree of crystallinity of the thermoplastic starches (26-27%) was similar to that obtained by Chaudhary et al.13 for corn
starch/glycerol using an extrusion process temperature of 110 °C (24%).
According to Hulleman et al.14 and Van Soest et al.15 two
types of crystallinity can be distinguished in thermoplastic starches after extrusion processing: (i) residual crystallinity
- native A, B or C crystallinity caused by incomplete melting of the starch granules during processing; (ii)
processing-induced crytallinity - VH, VA or EH crystallinity which
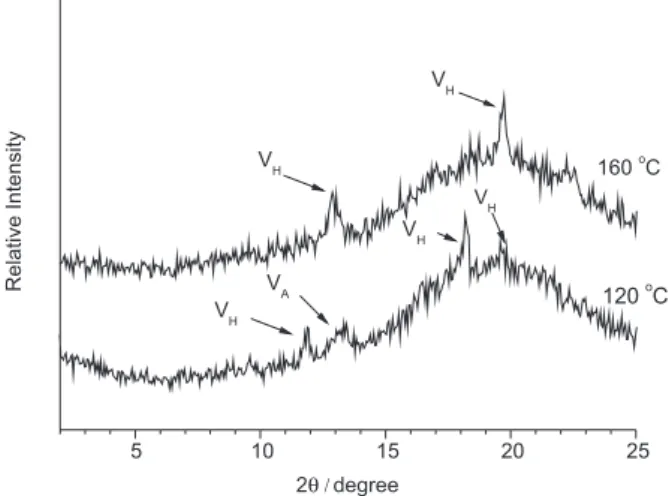
study no residual crystallinity was observed. However, peaks of high relative intensity were observed in the XRD diffratogram for the TPS samples extruded at 120 oC and
160 oC, which characterize the presence of crystallinity
induced through the extrusion process, as indicated in Figure 1.
According to the literature, VH-type crystallinity in
extruded TPS has the characteristic peaks of Bragg angles at 7.1o, 12.6o, 19.4o and 22.1o.15 The lattice of V
H-type has
a 6-fold left-handed helix in an orthorhombic unit, with cell dimensions a, b and c of 13.65 Å, 23.70 Å and 8.05 Å, respectively (space group P212121) or in a hexagonal unit
cell with dimensions a and b of 13.65 Å and c of 8.05 Å (space group P6522). VA-type crystallinity displays the
characteristic peaks of Bragg angles at 7.4o, 13.4o and
20.6o, with cell dimensions a, b and c of 13.0 Å, 22.5 Å
and 7.9 Å, respectively (space group P212121).15 Specimens
of TPS extruded at 160 oC show two peaks in the X-ray
diffratogram at 19.7° and 12.9°, which indicate that the crystallinity is of the type VH. On the other hand, the TPS
specimen extruded at 120 oC shows four peaks at 12.0o,
13.3o, 18.2o and 19.7°, indicating the presence of both V H
and VA crystallinity, associated with the degree of hydration
of the TPS specimens obtained through processing at different temperatures.
The values for the glass transition temperature (Tg) of the TPS samples ranged between 4 oC and 6 °C for TPS30 and
TPS25, respectively, indicating the miscibility of the starch/ glycerol mixture. The PLA showed a single Tg at 59 oC and
the blends presented two transition temperatures, a lower temperature (between 6 oC and 8 oC) related to the glass
transition of the TPS phase and a higher temperature (58 oC)
related to the PLA. These results indicate the immiscibility of the TPS/PLA blends and the presence of two phases.
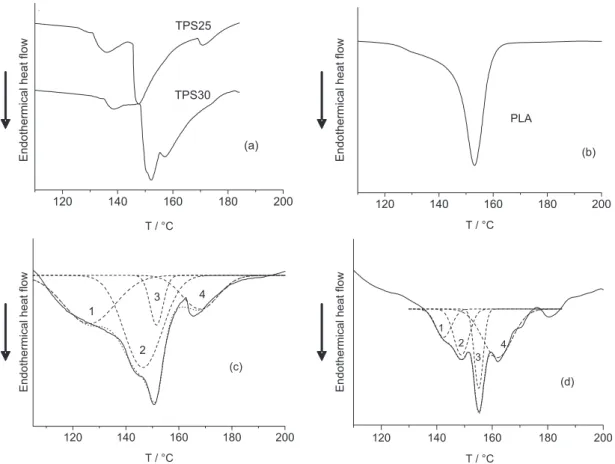
The close values for the melting temperature of the blend components, observed through the deconvolution of the peaks, are associated with the melting temperatures of the undiluted components, shown in Figure 2. The four peaks are related to the melting temperature of the specific crystallization type of the undiluted components. From the values for each peak area related to the change in the enthalpy of fusion we obtained the ratios of 3:24 and 4:24 for the crystallized form of PLA/TPS in blends M3025 and M3030, respectively. These values differ from those for the initial mass of each component since they are related only to the different crystalline unit cells of the components.
In the DSC analysis of the samples TPS25 and TPS30 (Figure 2) the presence of three endothermic peaks was observed. This may be associated with the differences in crystallinity observed in these samples by XRD. As these peaks remained in the blend samples, deconvolution in the region of the endothermic peak (fusion) was necessary in the case of samples M3025 and M3030. These results are presented in Table 1 and the corresponding curves in Figure 2. In both cases, the fitting of the curves obtained by deconvolution had a correlation of R2 > 0.99.
The curve of sample M3025 showed four peaks at temperatures of 126 oC, 146 oC, 151 oC and 168 oC
corresponding to TPS, TPS, PLA and TPS, respectively. Peak 3 is related to the area of the PLA and corresponds to 18.7% of the total area, since this sample has 30 g PLA per
100 g TPS, i.e., the percentage of PLA in the blend is 23%.
We can observe a good correlation for the results obtained by deconvolution with the blend composition. The sample M3030 showed four peaks at temperatures of 142 °C, 149 °C, 155 °C and 161 °Ccorresponding to TPS, TPS, PLA and TPS, respectively. The area for the PLA (peak 3), as in the previous sample, corresponds to the composition of the blend (21.6%) (Table 1).
The morphology of a polymer blend is dependent on the characteristics of the pure components and is related to the microscopic and macroscopic properties of the system. The micrographs of the films are shown in Figure 3.
Since the immiscibility of the PLA/TPS blend was indicated by the thermal analysis data, the specimens were fractured under liquid nitrogen and one part was maintained immersed in chloroform, a PLA solvent, to investigate whether a domain was present. The micrographs of the thermoplastic starch films (TPS25 and TPS30), treated and not treated with chloroform, showed a uniform texture and density, with no domain being observed. The absence of starch granules suggests that the extrusion process used to obtain the TPS favored the rupture of the granular structure. Yew et al.16 studied rice starch/PLA blends prepared by
extrusion without prior conversion of the starch to TPS. Figure 1. Diffratogram of thermoplastic starches extruded at 120 oC
Figure 2. Deconvolution of DSC curves in the temperature range of 110 oC to 200 oC for specimens (a) TPS25 and TPS30, (b) PLA, (c) M3025 and (d) M3030.
Table 1. Peak number and area related to blends with DSC curve deconvolution
Blends Peak Area / % Tm / oC Component
M3025 1 27.4 126 TPS
2 40.6 146 TPS
3 18.7 151 PLA
4 13.5 168 TPS
M3030 1 13.5 142 TPS
2 21.2 149 TPS
3 21.6 155 PLA
4 43.7 161 TPS
For all area fits R2 ≥ 0.96.
Figure 3. Scanning electronic micrograph of TPS and PLA/TPS films. The authors observed by SEM the presence of intact starch
granules in the micrographs of the blend fractures, and associated this with the low interaction between the PLA matrix and starch granules. Conversely, in this study starch granules were not observed in the blend fractures, which may be related to the processing of the granular starch prior to its conversion to TPS promoting a greater efficiency of the extrusion process and improving the polymer mixture.
the morphology of the fractured surfaces were similar to that of pure TPS, Figures 3c and 3e. However, the fracture of the same blends immersed in chloroform showed gaps which were occupied by the PLA phase. The magnitude of the micrographs in Figures 3c and 3d was reduced to better visualize the fracture surface. The phase domains observed are in agreement with the thermal analysis data. The characteristics of the interface between the domains of the blend may be related to the interfacial tension between the hydrophilic surface of the matrix and the hydrophobic surface of the PLA.
Similar fractured film textures of PLA/TPS blends have been observed by other authors who reported the presence of domains in such blends, characterizing them as immiscible.17,18 Wang et al.17 used glycerol, formamide and
water as the plasticizers, alone or combined, in corn TPS/PLA blends and observed that with increasing formamide content the dispersion between the two phases increased considerably. Nin et al.18 used citric acid as a compatibilizer
in TPS/PLA blends and observed a decrease in the size of the domains with increasing acid concentration in the blend.
The moisture of the films after thermopressing ranged from 0.11 ± 0.01 (M2025) to 0.16 ± 0.01 (TPS30) g water
per g dry mass. Samples containing only thermoplastic
starch showed higher values for the moisture content in
their respective blends. This behavior is associated with the more hygroscopic nature of TPS compared with PLA, as verified by other authors who have studied these blends.16,19
In terms of density, differences between the samples of thermoplastic starches and blends were not observed. The density of the films ranged from 0.96 ± 0.07 (M1030) to 1.19 ± 0.09 (TPS30) g per cm3.
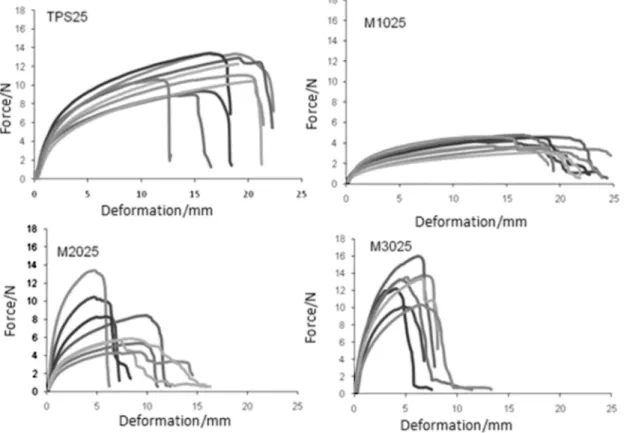
Figure 4 shows the stress-strain curves for the specimens of TPS25, M1025, M2025 and M3025. The strain-stress curve for TPS with 25% of glycerol shows behavior analogous to all specimens analyzed, and the value for the elongation at break increases from 13 to 23 mm, probably due to high water absorption in the sample increasing the plasticization effect. For the PLA/TPS blends, with increasing percentage of TPS a reduction in the elongation at break values and the slope of the linear part of the curve were observed. Moreover, the significant change in the M2025 curves can be attributed to the sample heterogeneity, since it shows the characteristics of other blend specimens evaluated with a high or low TPS percentage in the blend. The M1025 specimen showed a decrease in tensile strength and increased elongation at break when compared to the thermoplastic starch films. However, for the M2025 and M3025 specimens, increasing PLA percentage in the mixture led to an increase in tensile strength and a decrease
in the elongation at break. This behavior was also observed in the blends obtained with TPS30, causing an increase in the elastic modulus and tensile strength, as presented in Table 2.
The blends with thermoplastic starch using 30% glycerol were less rigid and had a lower tensile strength than the specimen with TPS25 (25% glycerol), and higher elongation at break values. This behavior is related to the plasticization effect due to the greater percentage of glycerol in the thermoplastic component of the blend. The tensile strength of the films with the incorporation of 10% of PLA decreased compared to the thermoplastic starch films for both concentrations of plasticizer used. For blends with 20% and 30% of PLA added an increase in the tensile strength was observed, and for the M3025 and M3030 specimens the T values were higher than those for the pure thermoplastic polymer. Similar behavior was observed for the elastic modulus with lower values for the blends with
10% PLA and over 30% PLA, compared to the pure TPS. These data suggest that the incorporation of 30% PLA in the TPS matrix increases the rigidity of the films, a finding which is in agreement with thermal analysis data.
Figure 5 shows the moisture sorption isotherms of the TPS/PLA blends and, the GAB model parameters (m0, C, k). The correlation coefficients for the fits are
shown in Table 3. Table 2. Results for the mechanical testing of films of thermoplastic
starch and PLA: tensile strength (T), elongation at break (ε) and Young’s modulus (Y)
Sample T / MPa ε / % Y / MPa
TPS25 2.1 ± 0.3b 42 ± 7b 28 ± 5b
M1025 0.9 ± 0.2a 36 ± 10b 11 ± 3ª
M2025 1.6 ± 1.0b 17 ± 5ª 23 ± 9b
M3025 2.8 ± 0.8b 14 ± 3ª 74 ± 22c
TPS30 1.0 ± 0.1b 63 ± 12c 16 ± 4b
M1030 0.6 ± 0.2ª 59 ± 11c 3 ± 2ª
M2030 0.8 ± 0.3ª,b 20 ± 5b 13 ± 2b
M3030 1.3 ± 0.3b 8 ± 2ª 37 ± 8c
Means with different letters (a,b,c..) in the same row indicate difference at the 0.05 level according to Tukey’s test.
Figure 5. Moisture sorption isotherms of thermoplastic starch and PLA blends obtained with thermoplastic starch containing (a) 25% glycerol and (b) 30% glycerol.
Table 3. Results for the water vapor permeability (Kw), solubility coefficient (β), mass flux (J) and effective diffusion coefficient (Dw) and parameters of
the GAB model fitted to the sorption isotherms for the films obtained with thermoplastic starch and PLA
Sample GAB parameters β × 10
4 / (kg kg-1 Pa-1) Kw × 1013 /
(kg m m-2 s-1 Pa-1)
J ×106 /
(kg m-2 h-1)
Dw × 1012 /
(m2 s-1)
m0 k C aw = 0.75 aw = 0.02
TPS25 0.06 1.02 12.5 3.5 1.7 2.1 ± 0.2ª 1.1 0.5
M1025 0.09 0.87 31.7 2.1 3.5 3.3 ± 0.7b,c 1.7 1.6
M2025 0.08 0.86 22.8 1.8 2.7 2.9 ± 0.2b 1.6 1.6
M3025 0.07 0.88 25.1 1.7 2.5 2.4 ± 0.4b 1.3 1.4
TPS30 0.07 1.02 62.4 4.1 2.9 2.6 ± 0.1c 1.7 0.6
M1030 0.08 0.96 9.0 3.1 1.7 3.9 ± 0.4b 1.8 1.3
M2030 0.07 0.98 8.2 3.1 1.4 2.8 ± 0.4b 1.4 0.7
M3030 0.06 1.00 16.5 3.1 1.9 1.8 ± 0.2ª 1.1 0.5
For the solubility coefficients, aw = 0.75 and 0.02 correspond to the RH values used to determine the water vapor permeability; m0, k, C - parameters of the GAB where m0 is given in g water (kg dry solid)-1. Coefficient of GAB parameters determination (R2) > 0.99 for all settings. Means with different letters
The GAB model was adjusted satisfactorily to the experimental data, as previously shown by other authors for starch biofilms.1,20-22 The sorption isotherms were of
the sigmoidal type for all films, which is characteristic of hydrophilic materials.
It is important to note that in the range of water activity between 0.6 and 0.9 for all samples we observed an increase in the moisture content which may be associated with the phenomenon of water clustering.22,23 This phenomenon was
less intense in the samples containing 30% PLA (M3025 and M3030) which is consistent with these samples having a less hydrophilic character.
The films showed similar values for the parameter m0,
an indication that these materials had a similar behavior in terms of their hygroscopicity. The parameter C, classically associated with the sorption heat of the monolayer, did not show different behavior for the samples and the magnitude of this parameter was consistent with values reported by other researchers for biofilms.1,20,24
There were no significant differences in the value of k for the different blends studied. Since this parameter is related to multilayer sorption heat, it was consistent with the results obtained for the other parameters. The water vapor permeability (Kw), the solubility coefficient (β), the
mass flux (J) and the effective diffusion coefficient (Dw)
are presented in Table 3. The data show that the Kw values
ranged from 1.8 × 10⁻¹³ kg m s-1 m-2 Pa-1, for sample M3030
and 3.9 × 10⁻¹³ kg m s-1 m-2 Pa-1, for sample M1030.
The diffusion coefficient values determined in this study have the same order of magnitude as those reported by Yew et al.16 for blends of starch and PLA. Films
prepared with 30% of glycerol showed higher water vapor permeability than samples prepared with 25% of glycerol. This behavior has been reported by other authors working with hydrophilic polymers plasticized with polyols and is associated with increased amounts of hydroxyl groups from the plasticizer.20,22,23 This increase causes an increase in the
hygroscopicity of the material, reflected in the increase in the solubility coefficient of the samples with higher glycerol concentration.
On the other hand, the lowest water vapor permeability was observed for the blend M3030, which is related to the lower value for the diffusion coefficient observed for this sample. Decreased diffusivity may be related to a greater compression of the blend due to the presence of smaller domains observed in the microscopic analysis.
The solubility coefficient values determined at 75% RH of the blends were lower than those for the thermoplastic starch used in their preparation. The decrease in the solubility coefficient with increasing concentration of PLA is associated with a decreased amount of hydroxyl
groups in the blend available for interaction. This is associated with the fact that each D-glucose repeating unit contains three of these groups while the PLA has two in each polymer chain.
This behavior was also observed in the β values determined at 2% RH for the samples with 30% glycerol. Moreover, in samples with 25% glycerol it was observed that the values for the solubility coefficient determined at 2% RH decreased with the content of PLA in the blends, however, as observed in other materials, the solubility coefficient was higher than those for the TPS25 blends. The samples containing 10% PLA (M1025 and M1030) showed higher permeability to water vapor than the samples of the corresponding pure thermoplastic starch (TPS25 and TPS30). This behavior is due to the increase in the diffusion coefficient and the lower densities of the blends compared with the TPS samples. For example, the M1030 film has a permeability value 49% greater than that observed for TPS30. This increase in permeability is associated with the 2.8-fold increase in the diffusion coefficient, since the solubility coefficients at 75% and 2% RH decreased by 23.5% and 42% respectively.
Conclusions
The thermal analysis data indicated the immiscibility of the TPS/PLA blends, in agreement with the morphological characteristics. This blend immiscibility induces changes in the mechanical properties related with the domain dimension. For the blend production processes used in this study it was observed that the plasticizer affects the domain size, i.e., the materials prepared with TPS30
showed domains smaller than those prepared with TPS25. On the other hand, the presence of PLA reduced the water vapor permeability to 30% compared with the undiluted TPS specimens. The use of extrusion processes and thermopressing in the production of such materials, procedures which are well established in the commercial sector, together with the observed characteristics of the blends, makes them a good alternative for the preparation of biodegradable materials for use as packaging material.
Acknowledgments
The authors are grateful for the financial support of CAPES and CNPq.
References
2. Bilck, A. P.; Grossmann, M. V. E.; Yamashita, F.; Polym. Test. 2010, 29, 471.
3. Van de Velde, K.; Kiekens, P.; Polym. Test. 2002, 21, 433. 4. Jayasekara, R.; Harding, I.; Bowater, I.; Christie, G. B. Y.;
Lonergan, G. T.; Polym. Test. 2004, 23, 17.
5. Yu, L.; Dean, K.; Li, L.; Prog. Polym. Sci. 2006, 31, 576. 6. Huneault, M. A.; Li, H.; Polymer 2007, 48, 270. 7. Ke, T.; Sun, X.; J. Appl. Polym. Sci. 2001, 81, 3069. 8. Ke, T.; Sun, S. X.; Seib, P.; J. Appl. Polym. Sci. 2003, 89, 3639. 9. Park, J. W.; Im, S. S.; Kim, S. H.; Kim, Y. H.; Polym. Eng. Sci.
2000, 40, 2539.
10. ASTM - American Society for Testing and Materials; Method D 882-02: Standard Test Methods for Tensile Properties of
Thin Plastic Sheeting, Annual Book of ASTM Standards: Conshohocken, PA, 2002.
11. ASTM - American Society for Testing and Materials; Method E 96-00: Standard Test Methods for Water Vapor Transmission of
Materials, Annual Book of ASTM Standards: Conshohocken, PA, 2002.
12. Bell, L. N.; Labuza, T. P.; Moisture Sorption: Practical Aspects of Isotherm Measurement and Use, 2nd ed.; AACC Egan Press:
Egan, USA, 2000.
13. Chaudhary, A. L.; Torley, P. J.; Halley, P. J.; McCaffery, N.; Chaudhay, D. S.; Carbohydr. Polym. 2009, 78, 917.
14. Hulleman, S. H. D.; Kalisvaart, M. G.; Janssen, F. H. P.; Feil, H.; Vliegenthart, J. F. G.; Carbohydr. Polym. 1999, 39, 351. 15. Van Soest, J. J. G.; Hulleman, S. H. D; de Wir, D.; Vliegenthart,
J. F. G.; Ind. Crop. Prod. 1997, 5, 11.
16. Yew, G. H.; Yusof, A. M. M.; Ishak, Z. A. M.; Ishiaku, U. S.; Polym. Degrad. Stab. 2005, 90, 488.
17. Wang, N.; Yu, J.; Chang, P. R.; Ma, X.; Carbohydr. Polym. 2008, 71, 109.
18. Nin, G. W.; Xingxiang, Z.; Na, H.; Jianming, F.; J. Thermoplast. Compos. Mater. 2010, 23, 19.
19. Preechawong, D.; Peesan, M.; Supaphol, P.; Rujiravanit, R.; Carbohydr. Polym. 2005, 59, 329.
20. Mali, S.; Sakanaka, L. T.; Yamashita, F.; Grossmann, M. V. E.; Carbohydr. Polym. 2005, 60, 283.
21. Godbillot, L.; Dole, P.; Joly, C.; Rogé, B.; Mathlouthi, M.; Food Chem. 2006, 96, 380.
22. Müller, C. M. O.; Laurindo, J. B.; Yamashita, F.; Food Hydrocolloids 2009, 23, 1328.
23. Zeppa, C.; Gouanvé, F.; Espuche, E.; J. Appl. Polym. Sci. 2009, 112, 2044.
24. Diaz, A. B.; Müller, C. M. O.; Larotonda, F. D.; Laurindo, J. B.; J. Cereal Sci. 2010, 51, 213.
Submitted: August 17, 2011