Cop
yright
© ABE&M t
odos os dir
eit
os r
eser
vados
.
Butyrylcholinesterase and
diabetes mellitus
in the CHE2
C5- and CHE2 C5+ phenotypes
Butirilcolinesterase e diabetes melito nos fenótipos CHE2 C5- e CHE2 C5+
Mauro M. Cwiertnia1, Vânia M. Alcântara1, Rosângela R. Réa2, Ana Cristina R. A. Faria2, Geraldo Picheth1, Marileia Scartezini1, Lorena E. Graef1, Marciane Welter1
ABSTRACT
Objective: To investigate the relationship between butyrylcholinesterase (BChE) activities (total and band speciic) and diabetes mellitus. Subjects and methods: BChE activities (BChEA, AC4/5, ACOF and RC5) were analyzed in 101 type 1 (DM1) and in 145 type 2 (DM2) diabetic patients, in relation to phenotype, weight and incidence of metabolic syndrome (MS) in these patients. The C4/5 and C5 complex were separated from other molecular forms (COF) using an acid agar gel. Re-sults: The BChE activity (BChEA) and the absolute activities of C4/5 (AC4/5) and COF (ACOF) showed a high positive correlation coeficient to weight in the CHE2 C5- group, while the relative activity of C5 complex (RC5) showed a negative correlation to weight. Conclusions: The present study suggests that the positive correlation of the BChE activities to diabetes mellitus and to insulin resistance may depend on the CHE2 locus variability. High values of BChE activities were as-sociated with insulin resistance only in CHE2 C5- diabetic patients, while in CHE2 C5+ diabetic patients, the presence of C5 complex, especially in a relatively high proportion, leads to less fat storage and better protection against metabolic syndrome. Arq Bras Endocrinol Metab. 2010;54(1):60-7
Keywords
BCHE and CHE2 loci; C4/5 and C5 complexes; obesity, insulin resistance; metabolic syndrome; serum cholinesterase
RESUMO
Objetivo: Investigar a associação entre as atividades (total e banda especíica) da butirilcolines-terase (BChE) e diabetes melito. Sujeitos e métodos: As atividades da BChE (BChEA, AC4/5, ACOF e RC5) foram analisadas em 101 pacientes diabéticos do tipo 1 (DM1) e 145 do tipo 2 (DM2) em relação aos fenótipos, ao peso e à incidência da síndrome metabólica. Os complexos C4/5 e C5 foram separados das outras formas moleculares (COF), usando gel de ágar ácido. Resultados: A atividade da BChE (BChEA) e as atividades absolutas de C4/5 (AC4/5) e de COF (ACOF) mostraram altos coeicientes de correlações positivos com peso no grupo de CHE2 C5-, enquanto a ativi-dade relativa do complexo C5 (RC5) mostrou correlação negativa com o peso. Conclusões: O presente estudo sugere que as correlações positivas das atividades da BChE com diabetes me-lito e com a resistência à insulina podem depender da variabilidade do loco CHE2. Altos valores nas atividades da BChE estão associados com a resistência à insulina somente nos pacientes diabéticos CHE2 C5-, enquanto nos pacientes diabéticos CHE2 C5+ a presença do complexo C5, especialmente em alta proporção relativa, leva a um menor estoque de gordura e à maior proteção contra a síndrome metabólica. Arq Bras Endocrinol Metab. 2010;54(1):60-7
Descritores
Locos BCHE e CHE2; complexos C4/5 e C5; obesidade, resistência à insulina; síndrome metabólica; colinesterase do soro
1 Departamento de Patologia
Médica, Universidade Federal do Paraná (UFPR), Curitiba, PR, Brasil
2 Serviço de Endocrinologia
e Metabologia do Paraná, Departamento de Clínica Médica, UFPR, Curitiba, PR, Brasil
Correspondence to:
Rosângela R. Réa Serviço de Endocrinologia, Universidade Federal do Paraná Rua Agostinho Leão Junior, 285 80030-110 – Curitiba, PR, Brasil [email protected]
Received on Apr/22/2009 Accepted on Aug/1/2009
INTRODUCTION
H
uman butyrylcholinesterase (BChE) is codiied by the BCHE locus that presents a few alleles withCop
yright
© ABE&M t
odos os dir
eit
os r
eser
vados
.
most common ones. In serum, one of the several mo-lecular forms of BChE, the C5 complex, is formed by association of BChE molecules with a still-unidentiied protein, which is codiied by the CHE2 locus (1). The
presence of C5 (constituting about 10% of the Euro-Brazilian population) characterizes the CHE2 C5+ phenotype (2), and the absence of thiscomplex cha-racterizes the CHE2 C5- phenotype. Sera from CHE2 C5+ individuals showed an approximate 30% increase in mean BChE activity (BChEA) when compared with CHE2 C5- sera (3). CHE2 C5+ phenotype individuals showed lower mean body weight values (2) and lower mean body mass index (BMI) values (4) than noted in the CHE2 C5- phenotype.
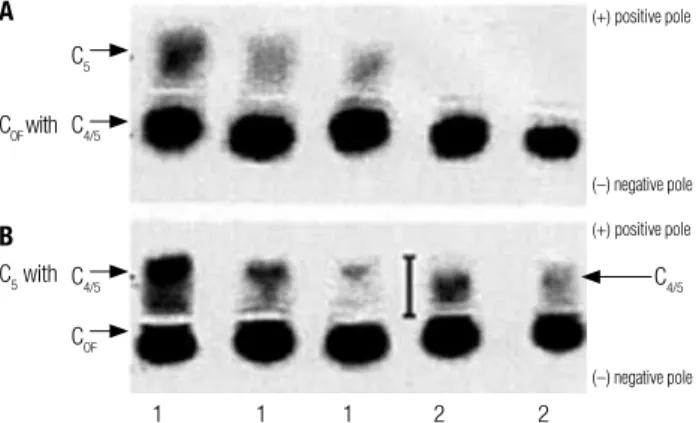
In acid agar gel electrophoresis (pH 6.2 to 6.7), the C5 complex migrates to the positive pole, while all other BChE molecular forms (COF) migrate toward the negati-ve pole. All individuals (5) hanegati-ve another BChE complex (C4/5) with the same mobility as COF in acid agar gel (pH 6.2 to 6.7) electrophoresis, and with the same migration to the positive pole as C5, when the pH of the agar gel is 5.3 (5).
The physiological function of BChE is still unk-nown, but positive correlations were found between BChEA and diabetes mellitus (DM) (6,7);
triglyceri-des (TG) (7-9); total cholesterol (TC) (7,10); apoli-poprotein B (ApoB) (7,9); adult body weight (2,11) and BMI (3,4). In light of some of these correlations, Kutty and cols. (12) proposed the use of BChEA as a complementary risk factor for coronary artery disease (CAD), and also suggested the relationship of BChEA to metabolic syndrome (MS) (13).
The term diabetes mellitus comprises a group of
me-tabolic disorders characterized by hyperglycemia due to defects in insulin secretion and/or in its action upon the organism. DM is classiied into two main groups: type 1 (DM1), characterized by pancreas β-cell destruc-tion due to autoimmune or idiopathic causes, resulting in insuficient insulin secretion; and type 2 (DM2), cha-racterized by a resistance to insulin action and an ina-dequate compensatory insulin secretory response (14). Coronary artery disease (CAD) is a known featu-re of complications in the prognosis of DM2 patients (15), and a high level of visceral fat is one of the main factors related to glucose intolerance and development of CAD (16), contributing to the sum of risk factors for DM onset (17) and to the deterioration of the lipid proile (18). Obesity in young adults has a positive cor-relation to development of DM (19). Other prognostic
features for diabetes include high blood pressure, hype-rinsulinemia and dislipidemia, with low serum levels of high density lipoprotein-cholesterol (HDL-C) and high levels of triglycerides (TG) (20).
Abbott and cols. (21), studying the relationship be-tween BChEA and hypertriglyceridemia in DM1 and DM2 patients and in patients with impaired glucose tolerance, found a positive correlation between BChEA and the logarithm of fasting TG serum levels, and that BChEA also positively correlates to insulin resistance in DM2 patients. They concluded that BChE may play a role in the development of hypertriglyceridemia in DM, associated with the resistance to or deiciency of insulin.
Typical dislipoproteinemia in DM2 patients is cha-racterized by the presence of high levels of very low density lipoprotein-cholesterol (VLDL-C), small and dense low density lipoprotein (LDL), and HDL-C be-low desirable levels (22). The small dense LDL is hi-ghly atherogenic due to its high susceptibility to mo-diications by oxidation (23). Frohlich and Dobiasova (24) demonstrated that the TG/HDL-C ratio, and especially its logarithm (logTG/HDL-C), have a high correlation to LDL particle size and can therefore be used as a risk predictor for CAD.
This is the irst study that separately analyzes the activity of C4/5 and C5 complexes of BChE in diabetic patients (DM1 and DM2), and the BChE activities in CHE2 C5+ and CHE2 C5- phenotypes.
SUBjECTS AND METHODS
Subjects
Plasma samples were collected with EDTA after at le-ast 12 hours of fle-asting. DM1 and DM2 patients were selected from the Diabetes Outpatient Clinic of Univer-sidade Federal do Paraná, in Curitiba (Southern Brazil). The DM group included 101 DM1 patients, aged 24.3 ± 7.3 years (61.0% female, 72% Euro-Brazilian and 28% Afro-Brazilian) and 145 DM2 patients, aged 55.0 ± 11.4 years (66.2% female, 64% Euro-Brazilian and 36% Afro-Brazilian). Controls were obtained from a Curiti-ba population sample (blood donors, university staff and students) consisting of 186 individuals, aged 37.8 ± 15.6 years (59.1% female, incomplete data on ethnic origin).
Cop
yright
© ABE&M t
odos os dir
eit
os r
eser
vados
.
medications (HM); 25 taking HM and Insulin (I), 22 taking HM and sulfa (S), 34 only insulin, 14 only sulfa, 10 both insulin and sulfa, and 1 taking HM with insulin and sulfa. According to Abbott and cols. (21), medica-tion type should not interfere with BChE activity.
This research was approved by the Ethics Commit-tee of the University Hospital, of the institution (pro-tocol no 327.037/2001-04).
Laboratory methods
Glucose (GLC) was quantiied by glucose-hexoquinase (Merck Mega method); TG and TC were quantiied by colorimetric enzymatic reactions (Merck, SMT); and HDL-C by homogeneous direct method (Roche). HbA1c and apolipoprotein B (Apo B) were determined by high performance liquid chromatography (BioRad) and by turbidimetry (Roche), respectively. Insulin (I) was determined by radioimmunoassay (Diagnostics Pro-ducts Corporation, Los Angeles, CA, USA). All these analyses were performed on the day of sample collection.
Non-hemolized serum samples were stored at -20°C. BChE activities and the phenotypes of the
BCHE and CHE2 loci were veriied within eight days
of storage. BChEA was measured by the colorimetric propionylthiocholine-DTNB reaction at 25oC, using the
method described by Dietz and cols. (25), as modiied by Evans and Wroe (26). The phenotypes of the CHE2
locus were identiied by acid agar gel electrophoresis (pH 6.5), followed by a staining process using alpha-naphthyl acetate as substrate and fast red TR salt, in a modiication of the Van Ros and Vervoort method (27). This methodology allows band-by-band separation of C5 from all the other BChE forms (COF). In the case of the
CHE2 C5- phenotype, the C4/5 band is separated from the COF band by a modiication of this methodology (5) using agar gel at pH 5.3, in a 2.5 hour run (Figure 1). Be-cause the intensities of these bands modify with storage, analysis was performed four months after sample collec-tion, the period required for their stabilization. The re-lative activities (%) of C4/5 and C5 bands (RC4/5 and RC5, respectively) were measured after gel scanning with the Kodak Digital (28) Corel Photo Paint 9 (1999), and the bands quantiied by the Kodak 1D (29) Image Analysis Software for Windows (1992-2000). The samples were examined in duplicate and whenever the results were not reproducible, new trials were performed until three results were in agreement. The absolute activity (AC4/5) of the C4/5 bands was then calculated [relative activity of these bands (RC4/5) multiplied by their total activity (BChEA)].
Figure 1. Fragments of two electrophoreses in agar gel of pH 6.5 (A) and pH 5.3 (B). Representative migration of CHE2 C5+ (lines 1) and of CHE2 C5- (lines 2).
The diagnosis of DM1 was assigned when the fas-ting glucose concentration exceeded 126 mg/dL (or was previously 140 mg/dL) and/or random plasma glucose levels exceeded 200 mg/dL on more than one occasion, with or without overt symptoms or signs of diabetes.
HOMA-IR (31) is a mathematical model that pre-dicts insulin resistance (IR) and/or secretion of insulin by pancreatic β-cells by measuring insulin and fasting blood glucose: HOMA-IR = Glucose (mMol) x Insulin (µU/mL)/22.5.
Statistical analyses
Data analyses were performed with the Statistica softwa-re (30) that calculated Student’s t-test for independent
means comparisons, χ2 tests, and stepwise multiple
re-gression analyses.
The analyzed variables in diabetic patients were: BChEA, sex, age, ethnic origin, systolic pressure (SP), diastolic pressure (DP), body mass index (BMI), glu-cose (GLC), HbA1, Apo B, TC, TG, logTG, HDL-C, I, phenotypes of the CHE2 locus (PCL) and diabetes
type (DT).
RESULTS AND DISCUSSION
Previous studies (4,32) have shown the inluence of
CHE2 locus in BChEA. This study has taken this inquiry
to the next level of isolating inluencing factors by sepa-rately analyzing the CHE2 C5- and CHE2 C5+ pheno-types in both diabetic and in non-diabetic controls.
The incidence of the CHE2 C5+ phenotype in DM1 (13.5% ± 3.4%) and in DM2 (13.6% ± 2.8%) did
C5
C4/5
C4/5 C4/5
1 1 1 2 2
(–) negative pole
(–) negative pole
(+) positive pole
(+) positive pole
A
B
COF COF with
Cop
yright
© ABE&M t
odos os dir
eit
os r
eser
vados
.
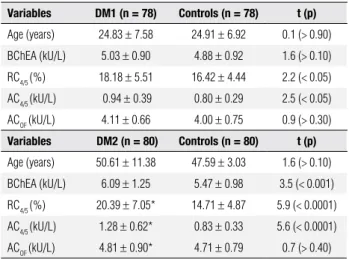
Table 2. BChE activity in diabetic patients (DM1 and DM2) with CHE2 C5- phenotype
Variables DM1 (n = 78) Controls (n = 78) t (p)
Age (years) 24.83 ± 7.58 24.91 ± 6.92 0.1 (> 0.90)
BChEA (kU/L) 5.03 ± 0.90 4.88 ± 0.92 1.6 (> 0.10)
RC4/5 (%) 18.18 ± 5.51 16.42 ± 4.44 2.2 (< 0.05)
AC4/5 (kU/L) 0.94 ± 0.39 0.80 ± 0.29 2.5 (< 0.05)
ACOF (kU/L) 4.11 ± 0.66 4.00 ± 0.75 0.9 (> 0.30)
Variables DM2 (n = 80) Controls (n = 80) t (p)
Age (years) 50.61 ± 11.38 47.59 ± 3.03 1.6 (> 0.10)
BChEA (kU/L) 6.09 ± 1.25 5.47 ± 0.98 3.5 (< 0.001)
RC4/5 (%) 20.39 ± 7.05* 14.71 ± 4.87 5.9 (< 0.0001)
AC4/5 (kU/L) 1.28 ± 0.62* 0.83 ± 0.33 5.6 (< 0.0001)
ACOF (kU/L) 4.81 ± 0.90* 4.71 ± 0.79 0.7 (> 0.40)
Mean ± standard deviation, t-test (t), p-value (p), sample size (n), * n = 77.
not differ signiicantly from the incidence found in a Curitiba blood donor sample in an earlier study (2): (N = 2,541; 10.50% ± 0.62%); (χ2 = 0.92, p > 0.30 and χ2
= 1.40, p > 0.20; respectively).
Table 1 shows mean comparisons found by t-test
between DM1 and DM2 patients with the CHE2 C5- phenotype. Most of the mean values are signiicantly higher in DM2 than in DM1, except for height, HbA1c, GLC, and HDL-C, all of which presented higher values in DM1. These indings seem to relect the metabolic alterations characteristic of DM2, with higher means for BMI, SP, DP, ApoB, TC, TG, logTG, logTG/HDL and BChE activities. The elevation of logTG/HDL in these patients indicates that they have a higher propor-tion of small and dense LDL particles (24) and, there-fore, a higher risk for coronary artery disease (CAD).
Table 2 shows the t-test results for the mean
va-lues of age and BChE activities in the DM1 and DM2 groups with the CHE2 C5- phenotype, compared to controls, and paired by sex and age. DM1 presented higher signiicant mean values for RC4/5 and AC4/5 but not for BChEA and ACOF. Analyses of other variables (not shown in the table) presented signiicant higher mean values for BMI, GLC, TC, Apo B, and HbA1 in DM1 when compared with the controls, but not for the values for TG, logTG, HDL-C and logTG/ HDL-C. However, the DM2 subjects presented higher values for a majority of the analyzed variables, except for height, HDL-C and ACOF. The pairing procedure was used because males and older individuals presented higher mean values for BChEA (4,7,9,33,34), AC4/5 (4,34) and ACOF (4), when compared to females and younger individuals with CHE2 C5- phenotype.
After logistic multiple-regression analysis (Table 3), BChEA and ACOF in the DM1 CHE2 C5- sample pre-sented statistically signiicant standardized regression coeficients with Apo B and logTG (or TG). AC4/5 correlated only with Apo B. In DM2, BChE activities showed signiicant correlation with Apo B, logTG and HOMA-IR. When the DM1 and DM2 groups were analyzed together, BChEA and ACOF presented positive and signiicant correlation with Apo B, logTG (or TG), HOMA-IR and DT, and AC4/5 only correlated signii-cantly with ApoB and logTG. The AC4/5 variability was better understood in DM2 (30%), while the BChEA and ACOF variances were better understood in DM1 (40% and 33%, respectively), notably in the DM1 and DM2 samples analyzed together (44%).
Table 1. Characteristics of DM1 and DM2 patients with CHE2 C5- phenotype
Variables DM1 (n) DM2 (n) t (p)
Age (years) 24.63 ± 7.52 (86) 54.44 ± 11.65 (125) 21.0 (< 0.0001)
Height (m) 1.63 ± 0.09 (86) 1.61 ± 0.09 (125) 2.0 (< 0.05)
BMI (kg/m2) 23.32 ± 3.39 (86) 30.04 ± 5.34 (125) 10.3 (< 0.0001)
SP (mmHg) 116.48 ± 13.18 (84) 141.27 ± 18.30 (122) 10.7 (< 0.0001)
DP (mmHg) 72.68 ± 9.23 (84) 87.77 ± 10.71 (122) 10.5 (< 0.0001)
HbA1c (%) 10.04 ± 2.38 (86) 8.61 ± 2.07 (124) 4.6 (< 0.0001)
GLC (mg/dL) 216.04 ± 116.22 (83) 182.78 ± 72.38 (125) 2.5 (< 0.05)
Apo B (mg/dL) 88.88 ± 26.33 (86) 116.84 ± 29.66 (125) 7.0 (< 0.0001)
TC (mg/dL) 187.80 ± 45.91 (85) 223.92 ± 50.26 (124) 5.3 (< 0.0001)
TG (mg/dL) 98.69 ± 72.04 (85) 184.56 ± 146.28 (124) 5.1 (< 0.0001)
logTG 1.92 ± 0.25 (85) 2.17 ± 0.27 (124) 7.1 (< 0.0001)
HDL-C (mg/dL) 50.03 ± 11.35 (86) 44.60 ± 12.10 (121) 3.3 (< 0.01)
I (µUI/mL) 25.68 ± 27.60 (84) 19.48 ± 17.71 (122) 2.0 (= 0.05)
logTG/HDL 0.04 ± 0.01 (85) 0.05 ± 0.02 (121) 5.6 (< 0.0001)
HOMA-IR 9.86 ± 7.48 (81) 8.63 ± 7.93 (122) 1.1 (> 0.20)
BChEA activities
BChEA (kU/L) 5.05 ± 0.92 (86) 6.10 ± 1.34 (125) 6.3 (< 0.0001)
RC4/5 (%) 17.85 ± 5.70 (86) 19.60 ± 7.07 (125) 1.9 (> 0.05)
AC4/5 (kU/L) 0.93 ± 0.39 (86) 1.23 ± 0.61 (125) 4.0 (< 0.0001)
ACOF (kU/L) 4.13 ± 0.71 (86) 4.87 ± 1.02 (125) 6.0 (< 0.0001)
Mean ± standard deviation, t-test( t), p-value (p); sample size (n).
BMI: body mass index, SP: systolic pressure, DP: diastolic pressure, GLC: glucose, TC: total cholesterol, TG: triglycerides, logTG: logarithm of TG, I: insulin.
Cop
yright
© ABE&M t
odos os dir
eit
os r
eser
vados
.
Table 3. Stepwise multiple regression analysis in DM1 and DM2 with CHE2 C5- phenotype considering BChE activities as a dependent variable
D.V.
DM1 (n) Apo B logTG HOMA-IR R2
BChEA (85) +0.45 (p < 0.001) +0.23 (p < 0.05)& NS 0.40
AC4/5 (86) +0.48 (p < 0.0001) NS NS 0.23
ACOF (85) +0.38 (p < 0.01) +0.24 (p < 0.05) NS 0.33
DM2 (n) R2
BChEA (121) +0.34 (p < 0.001) +0.23 (p < 0.01) +0.21 (p < 0.01) 0.30
AC4/5 (121) +0.33 (p < 0.001) +0.23 (p < 0.01) +0.21 (p < 0.01) 0.30
ACOF (124) +0.30 (p < 0.001) +0.20 (p < 0.05) +0.26 (p < 0.01) 0.28
DM1 and DM2 (n) DT R2
BChEA (201) +0.36 (p < 0.0001) +0.21 (p < 0.01) +0.20 (p < 0.001) +0.18 (p < 0.01) 0.44
AC4/5 (209) +0.36 (p < 0.0001) +0.16 (p < 0.05)& NS NS 0.21
ACOF (209) +0.33 (p < 0.0001) +0.20 (p < 0.01) +0.23 (p < 0.001) +0.17 (p < 0.01) 0.44
DV: dependent variable; n: sample size; logTG: logarithm of triglycerides; DT: diabetes type; NS: non-significant result; &: variable without logarithm.
The correlations of BChEA and ACOF with diabetes type (DT) indicate that these activity levels were greater in DM2 subjects than in DM1 subjects. An earlier study (21) showed that the mean values of BChEA in DM1 and DM2 were not signiicantly different. However, this result was not replicated in the present study. Of note, the previous study did not mention the proportion of women in its diabetic sample, nor how many women were taking oral contraceptives. One possible reason for the discrepancy in indings is that our DM1 sample had a greater number of women than men, and 25% of tho-se women utho-sed oral contraceptives. The negative cor-relation of BChEA with estradiol is supported by data showing a higher mean value for BChEA in men than in females during their fertile period, a difference that di-sappears after menopause (35). Decrease of total BChE activity was also reported during pregnancy, when an increased synthesis of estrogens occurs (36,37).
Age and sex, despite not showing a correlation with BChEA in the diabetic samples, may, however, inluence BChEA activity secondarily to the increase caused by disli-pidemia. Groups DM1 and DM2 were both divided into four groups, by age and sex. Group 1 = women with me-dian age under 23; Group 2 = men with meme-dian age un-der 23; Group 3 = women with median age over 23; and Group 4 = men with median age over 23. Group 1 showed lower mean values for BChEA (t = 3.6; p < 0.001), AC4/5 (t = 2.6; p < 0.01) and ACOF (t = 3.3; p < 0.001), when compared to Group 3. Group 1 also showed lower mean values for BChEA (t = 2.1; p < 0.05) and AC4/5 (t = 2.4; p < 0.05), when compared to Group 4.
It is known that DM2 has been positively correlated to obesity (38). Considering that obese CHE2 C5- subjects display similar metabolic alterations to CHE2 C5- DM2 subjects, the present data are in accordance with the stu-dies that show higher mean values for BChEA, AC4/5 and ACOF in obese subjects, when compared to a non-obese sample of the general population of Curitiba (4,32,34).
In DM2, the HOMA-IR shows strong correlation with BChE activities. In DM1 patients, the HOMA-IR frequency (greater than 2.71) did not differ from those of DM2 patients. Furthermore, the HOMA-IR mean values for DM1 did not differ from those of the DM2 group (Ta-ble 1), and did not show correlation with BChE activities in the DM1 group using logistic regression analyses. The HOMA-IR has been positively correlated to BMI (39).
Although obesity is a frequent feature of DM2, many DM1 patients are prone to high BMI. Recent studies suggest that HOMA-IR is a common inding among this diabetic type, (40,41) and that HOMA-IR correlates positively with BMI (42,43).
Positive correlations of BChEA with body weight (2,4,34), BMI (4,34) and metabolic syndrome (MS) (13) have already been observed in the CHE2 C5- phe-notype. Positive correlations of BMI (4,34) and MS (13) with BChEA, AC4/5 and ACOF have also been reported.
Cop
yright
© ABE&M t
odos os dir
eit
os r
eser
vados
.
Table 5. DM1 and DM2 patients with CHE2 C5+ phenotype
Variables DM1 (n) DM2 (n) t (p)
Age (years) 22.36 ± 5.21 (14) 58.35 ± 8.99 (20) 13.4 (< 0.0001)
Height (m) 1.63 ± 0.08 (13) 1.57 ± 0.10 (20) 1.7 (> 0.05)
BMI (kg/m2) 23.10 ± 3.74 (13) 30.75 ± 4.72 (20) 4.9 (< 0.0001)
SP (mmHg) 122.31 ± 16.91 (13) 144.00 ± 18.47 (20) 3.4 (< 0.01)
DP (mmHg) 77.69 ± 11.66 (13) 88.50 ± 12.26 (20) 2.5 (< 0.05)
HbA1c (%) 9.20 ± 2.37 (14) 8.75 ± 1.99 (20) 0.6 (> 0.50)
GLC (mg/dL) 203.93 ± 107.33 (14) 182.80 ± 58.63 (20) 0.7 (> 0.40)
Apo B (mg/dL) 83.64 ± 25.97 (14) 112.25 ± 31.48 (20) 2.8 (< 0.01)
TC (mg/dL) 169.14 ± 33.62 (14) 217.65 ± 57.01 (20) 2.8 (< 0.01)
TG (mg/dL) 75.64 ± 40.50 (14) 151.65 ± 71.13 (20) 3.6 (< 0.01)
logTG 1.83 ± 0.21 (14) 2.14 ± 0.20 (20) 4.4 (< 0.001)
HDL-C (mg/dL) 50.00 ± 16.11 (14) 46.40 ± 11.06 (20) 0.8 (> 0.40)
I (µUI/mL) 23.06 ± 23.45 (14) 19.42 ± 8.86 (20) 0.6 (> 0.50)
logTG/HDL 0.04 ± 0.02 (14) 0.05 ± 0.01 (20) 1.6 (> 0.10)
HOMA-IR 9.15 ± 6.84 (14) 8.75 ± 4.87 (20) 0.2 (> 0.80)
BChEA activities
BChEA (kU/L) 6.75 ± 1.01 6.95 ± 1.33 0.5 (> 0.60)
RC5 (%) 26.85 ± 7.93 18.71 ± 8.23 2.9 (< 0.01)
BMI: body mass index, WHR: waist-to-hip ratio, SP: systolic pressure, DP: diastolic pressure, GLC: glucose; TC: total cholesterol, TG: triglycerides, logTG: logarithm of TG.
Table 6. BChE activity in DM1 and DM2 patients with CHE2 C5+ phenotype
Control (n = 27)
DM1
(n = 14) t (p)
DM2
(n = 20) t (p)
Age (years)
41.52 ± 12.73 22.36 ± 5.21 5.4 (< 0.0001)
58.35 ± 8.99 5.0 (< 0.0001)
BChEA (kU/L)
6.61 ± 1.98 6.75 ± 1.01 0.2 (> 0.80)
6.95 ± 1.33 0.7 (> 0.50)
RC5
(%)
25.97 ± 14.89 26.86 ± 7.93 0.3 (> 0.60)
18.71 ± 8.23 1.9 (= 0.05)
Mean ± standard deviation, t-test, sample size (n).
Table 4. BChE activity in diabetic patients (DM1 and DM2) with CHE2 C5- phenotype according to the bone mass index (BMI)
Variables BMI < 25 (n = 88) BMI (n = 125)≥ 25 t (p)
Age (years) 32.66 ± 16.14 52.50 ± 15.75 7.4 (< 0.0001)
BChEA (kU/L) 5.20 ± 0.94 6.01 ± 1.41 4.7 (< 0.0001)
RC4/5 (%) 18.77 ± 6.22 18.97 ± 6.86 0.2 (> 0.80)
AC4/5 (kU/L) 1.00 ± 0.44 1.18 ± 0.61 2.3 (< 0.05)
ACOF (kU/L) 4.23 ± 0.75 4.83 ± 1.05 4.6 (< 0.0001)
Mean ± standard deviation, sample size (n), t-test (t), p-value (p).
It was suggested in a previous study (21) that BChEA may have a role in the altered lipoprotein metabolism in hypertriglyceridemia associated with insulin insensitivity or insulin deiciency in diabetes mellitus. However, the results
obtained in the present study support the indings of Iwa-sakiand cols. (45) which indicate that BChEA is associated with the parameters of adiposity, serum lipid proile and the degree of insulin resistance. This current study sug-gests that BCHEA activities were more frequently corre-lated to obesity and metabolic syndrome disorder than to just the β-cell dysfunction in the CHE2 C5- DM1 group.
In patients with the CHE2 C5+ phenotype, no diffe-rences in the mean values of BChEA were observed when DM1 and DM2 were compared (Table 5), other than the
Table 7. Bone mass index (BMI), triglycerides (TG) and in HDL-C according to the intensity of CHE2 C5+ activitiy
Faint RC5 (n) Intense RC5 (n) t (p)
BMI (kg/m2) 29.76 ± 6.52 (17) 25.58 ± 3.88 (16) 2.2 (< 0.05)
TG (mg/dL) 126.94 ± 66.32 (32) 98.21 ± 46.94 (29) 1.9 (= 0.05)
HDL-C (mg/dL) 45.87 ± 11.35 (30) 53.88 ± 17.65 (24) 2.0 (< 0.05)
BChEA activities
BChEA (kU/L) 6.19 ± 1.65 (32) 7.37 ± 1.26 (29) 3.1 (< 0.01)
RC5 (%) 14.08 ± 5.55 (32) 34.03 ± 7.52 (29) 11.9 (< 0.0001)
Mean ± standard deviation, t-test, sample size (n).
DM2 group presenting higher mean values in a majority of the analyzed variables (except for height, HbA1c, GLC, and HDL-C). However, RC5 presented a signiicantly lower mean value in DM2 when compared with DM1 subjects. When the mean values of the DM1 and DM2 BChE activities were compared with those of the con-trols (Table 6), statistically signiicant differences were shown only in the RC5 of the DM2 group, with lower mean values than in the controls. Control subjects were not paired by sex and age, because it has not been de-monstrated that the variables of sex and age alter BChEA in individuals with the CHE2 C5+phenotype (32).
Considering that the CHE2 C5+ obese group also displays similar metabolic alterations as the CHE2 C5+ DM2 group, the present data concur with the studies that did not show higher mean values for BChEA but presented lower mean values for RC5 in obese subjects, when compared with non-obese subjects in a sample of the general population of Curitiba (32).
Table 7 shows the t-test results obtained after
sam-ple division by the median value (22.9%) of RC5 (obtai-ned from the DM1 and control groups, whose averages did not differ signiicantly).
in-Cop
yright
© ABE&M t
odos os dir
eit
os r
eser
vados
.
tense CHE2 C5+ phenotype, and HDL-C presented a higher mean value in this phenotype. The correlation (r) of RC5 with BMI, HDL-C and TG are -0.5658, +0.32537 and -0,4098 respectively. The negative cor-relation between BMI and RC5 has already been descri-bed in an obese sample (32).
The present study suggests that the positive correla-tions of BChE activities with diabetes mellitus and with
in-sulin resistance may depend on the CHE2 locus variability.
Our observation is that the high values of BChE activities were associated with insulin resistance only in diabetic pa-tients with CHE2 C5- phenotype, yielding our hypothesis that the presence of C5 complex,and particularly in a rela-tively high proportion, contributes to less fat storage and more protection against Metabolic Syndrome.
Acknowledgements: Hoffmann-La Roche and Co., Rio de Ja-neiro, RJ, Brazil, donated the Ro2-0683 inhibitor. Produtos Ro-che Químicos e Farmacêuticos S.A. and Bio-Oxford Importação Ltda/Bio-Rad Latin America donated the Apo B and the HbA1c kits, respectively. Frischmann Ainsengart Laboratory performed these quantiications. This research was supported by fellowships from Conselho Nacional de Desenvolvimento Cientíico e Tec-nológico (CNPq) and by grants from CNPq and Fundação da Universidade Federal do Paraná (FUNPAR).
Disclosure: no potential conlict of interest relevant to this article was reported.
REFERENCES
1. Masson P, Chatonnet A, Lockridge O. Evidence for a single bu-tyrylcholinesterase gene in individuals carrying the C5 plasma cholinesterase variant (CHE2). FEBS Lett. 1990;262(1):115-8. 2. Chautard-Freire-Maia EA, Primo-Parmo SL, Picheth G,
Louren-ço MA, Vieira MM. The C5 isozyme of serum cholinesterase and adult weight. Hum Hered. 1991;41(5):330-9.
3. Harris H. The principles of human biochemical genetics. Amster-dam, Elsevier/North-Holland Biomedical; 1980.
4. Alcântara VM, Oliveira LC, Réa RR, Suplicy HL, Chautard-Freire-Maia EA. Butyrylcholinesterase and obesity in individuals with the CHE2 C5+ and CHE2 C5- phenotypes. Int J Obes Relat Metab Disor. 2003;27(12):1557-64.
5. Souza RL, Furtado L, Diniz AC, Silva AC, Kaiss J, Petzl-Erler ML, et al. Studies on a heterologous complex formed by human butyryl-cholinesterase. Biochem Genet. 2003;41(5-6):141-50.
6. Antopol W, Tuchman L, Schifrin A. Cholinesterase activity of hu-man sera with special reference to hyperthyroidism. Proc Soc Exp Biol Med. 1937;36:46-50.
7. Alcântara VM, Chautard-Freire-Maia EA, Scartezin M, Cerci MS, Braun-Prado K, Picheth G. Butyrylcholinesterase activity and risk factors for coronary artery disease. Scand J Clin Lab Invest. 2002;62(5):399-404.
8. Cucuianu M, Popescu TA, Opincaru A, Haragus S. Serum pseudo-cholinesterase and ceruloplasmin in various types of hyperlipo-proteinemia. Clin Chem Acta. 1975;59(1):19-27.
9. Crook M, Haq M, Tutt P. Serum lipids, acute phase proteins and serum cholinesterase in normal subjects. Scand J Clin Lab Invest. 1994;54(8):601-3.
10. Magarian EO, Dietz AJ. Correlation of cholinesterase with serum lipids and lipoproteins. J Clin Pharmacol. 1987;27(10):819-20. 11. Simpson NE. Factors inluencing cholinesterase activity in a
Bra-zilian population. Am J Hum Genet. 1966;18(3):243-52.
12. Kutty KM, Jain R, Huang S, Kean K. Serum pseudocholinesterase: high density lipoprotein cholesterol ratio as an index of risk for cardiovascular disease. Clin Chim Acta. 1981;115(1):55-61. 13. Alcântara VM, Oliveira LC, Réa RR, Suplicy HL,
Chautard-Freire-Maia EA. Butyrylcholinesterase activity and metabolic syndrome in obese patients. Clin Chem Lab Med. 2005;43(3):285-8. 14. Report of the Expert Committee on the Diagnosis and
Classiica-tion of Diabetes Mellitus. Diabetes Care. 2003;26:Suppl 1:S5-S20. 15. Bierman EL. George Lyman Duff Memorial Lecture.
Athe-rogenesis in diabetes. Arterioscler Thromb Vasc Biol. 1992;12:647-56.
16. Brochu M, Poehlman ET, Ades PA. Obesity, body fat distribution, and coronary artery disease. J Cardiopulm Rehabil. 2000;20(2):96-108. 17. Nagaretani H, Nakamura T, Funahashi T, Kotani K, Miyanaga M,
Tokunaga K, et al. Visceral fat is a major contributor for multiple risk factors clustering in Japanese men with impaired glucose tolerance. Diabetes Care. 2001;24(12):2127-33.
18. Pascot A, Despres JP, Lemieux I, Bergeron J, Nadeau A, Prud’homme D, et al. Contribution of visceral obesity to the de-terioration of the metabolic risk proile in men with impaired glu-cose intolerance. Diabetologia. 2000;43:1126-35.
19. Colditz GA, Willett WC, Stampfer MJ, Manson JE, Hennekens CH, Arky RA, et al. Weight as a risk factor for clinical diabetes in wo-men. Am J Epidemiol. 1990;132(3):501-13.
20. Maison P, Byrne CD, Hales CN, Day NE, Wareham NJ. Do different dimensions of the metabolic syndrome change together over time? Evidence supporting obesity as the central feature. Diabe-tes Care. 2001;24(10):1758-63.
21. Abbott CA, Mackness MI, Kumar S, Olukoga AO, Gordon C, Ar-rol S et al. Relationships between serum butyrylcholinesterase activity, hypertriglyceridaemia and insulin sensitivity in diabetes mellitus. Clin Sci. 1993;85:77-81.
22. Taskinen MR. Quantitative and qualitative lipoprotein abnormali-ties in diabetes mellitus. Diabetes. 1992;41: Suppl 2:12-7. 23. Steinberg D, Gotto AM Jr. Preventing coronary artery disease by
lowering cholesterol levels: ifty years from bench to bedside. JAMA. 1999;282(21):2043-50.
24. Frohlich J, Dobiasova M. Fractional esteriication rate of choleste-rol and ratio of triglycerides to HDL-cholestecholeste-rol are powerful pre-dictors of positive indings on coronary angiography. Clin Chem. 2003;49(11):1873-80.
25. Dietz AA, Rubinstein HM, Lubrano T. Colorimetric determination of serum cholinesterase and its genetic variants by the propionyl-thiocholine-dithiobis (nitrobenzoic acid) procedure. Clin Chem. 1973;19(11):1309-13.
26. Evans RT, Wroe J. Is serum cholinesterase activity a predictor of succinylcholine sensitivity? An assessment of four methods. Clin Chem. 1978;24(10):1762-66.
27. Van Ros G, Vervoort T. Frequencies of the atypical and C5 variants of serum cholinesterase in Zairians and Belgians. Detection of the C5 variant by agar gel electrophoresis with an acid buffer. Ann Soc Belg Med Trop. 1973;53:633-44.
28. Kodak Digital. Corel Photo Paint 9. New York, 1995-1997, 1 CD-ROM. 29. Kodak 1D. Image Analyses Software for Windows. New York, v.
3.5, 1994-2000, 1 CD-ROM.
30. Statsoft. Microsoft, Inc. Statistica for Windows. Tulsa, 1996. 1CD-ROM. 31. Matthews DR, Hosker JP, Rudenski AS, Naylor BA, Treacher DF,
Cop
yright
© ABE&M t
odos os dir
eit
os r
eser
vados
.
and beta-cell function from fasting plasma glucose and insulin concentrations in man. Diabetologia. 1985;28(7):412-9.
32. Alcântara VM, Rodrigues, LC, Oliveira, LC, Chautard-Freire-Maia EA. Association of the CHE2 locus with body mass index and bu-tyrylcholinesterase activity. Hum Biol. 2001;73:587-95.
33. Propert DN, Brackenridge CJ. The relation of sex, age, smoking status, birth rank and parental ages to pseudocholinesterase acti-vity and phenotypes in a sample of Australian Caucasian adults. Hum Genet. 1976;32(2):181-8.
34. Alcântara VM, Rodrigues LC, Oliveira LC, Chautard-Freire-Maia EA. The variable expression of the C4/5 complex of human butyryl-cholinesterase and body mass index. Hum Biol. 2003;75(1):47-55. 35. Sidell FR, Kaminskis A. Inluence of age, sex, and oral contra-ceptives on human blood cholinesterase activity. Clin Chem. 1975;21(10):1393-5.
36. Shnider SM. Serum cholinesterase activity during pregnancy, la-bor and the puerperium. Anesthesiology. 1965;26:335-9. 37. Robertson GS. Serum cholinesterase deiciency. II: pregnancy. Br
J Anaesth. 1966;38(5):361-9.
38. Kissebah AH, Vydelingum N, Murray R, Evans DJ, Hartz AJ, Kalkhoff RK, et al. Relation of body fat distribution to metabolic complica-tions of obesity. J Clin Endocrinol Metab. 1982;54(2):254-60.
39. Ghiringhello MT, Vieira JG, Tachibana TT, Ferrer C, Maciel RM, Amioka PH, et al. Distribution of HOMA-IR in Brazilian subjects with different body mass indexes. Arq Bras Endocrinol Metab. 2006;50(3):573-4.
40. Cakan N, Ellis DA, Templin T, Frey M, Naar-King S. The effects of weight status on treatment outcomes in a randomized clinical trial of multisystemic therapy for adolescents with type 1 dia-betes and chronically poor metabolic control. Pediatr Diadia-betes. 2007;8(4):206-13.
41. Xu P, Cuthbertson D, Greenbaum C, Palmer JP, Krischer JP. Role of insulin resistance in predicting progression to type 1 diabetes. Diabetes Care. 2007;30(9):2314-20.
42. Kissebah AH. Insulin resistance in visceral obesity. Int J Obes. 1991;15 Suppl 2:109-15.
43. Zavaroni I, Bonini L, Fantuzzi M, Dall’Aglio E, Passeri M, Reaven GM. Hyperinsulinaemia, obesity, and syndrome X. J Intern Med. 1994;235(5):51-6.
44. World Health Organization. BMI classiication. [Homepage on the internet] [cited 2009 sep 9]. Available from: http://www.who.int/ bmi/index.jsp?introPage=intro_3.html