Cop
yright
© ABE&M t
odos os dir
eit
os r
eser
vados
.
1 Departamento de Nutrição e Saúde da Universidade Federal de Viçosa (UFV), Viçosa, MG, Brasil
Correspondence to:
Rita de Cássia Gonçalves Alfenas Universidade Federal de Viçosa Departamento de Nutrição e Saúde Av. PH Rolfs, s/n
36570-000 – Viçosa, MG, Brasil [email protected]
Received on Mar/26/2009 Accepted on Oct/14/2009
Effects of protein quality on
appetite and energy metabolism
in normal weight subjects
Efeitos da qualidade proteica no apetite e metabolismo energético de indivíduos eutróicos
Rita de Cássia Gonçalves Alfenas1, Joseina Bressan1, Aline Cardoso de Paiva1
ABSTRACT
Objective: The purpose of this study was to compare the effects of consumption of different pro-tein sources on food intake and energy expenditure in normal weight subjects. Subjects and me-thods: Breakfast preparations (casein, soy protein, whey protein or control) were ingested during seven consecutive days. Appetite, food intake, and energy expenditure were assessed. Results: Casein consumption led to a lower energy intake than whey protein. There was lower energy in-take on day 7 than on day 1 of the casein session. Soy protein preparations resulted in higher diet induced thermogenesis (DIT) than in control preparations. The respiratory quotient (RQ) obtained in the whey protein session was lower than the control and soy protein sessions. Conclusion: These results suggest that the consumption of different protein types leads to distinct effects on satiety (casein), DIT (soy protein), and/or RQ (whey protein). Arq Bras Endocrinol Metab. 2010;54(1):45-51
Keywords
Appetite; food intake; energy expenditure; soy protein; whey protein; casein
RESUMO
Objetivo: O objetivo deste estudo foi comparar os efeitos do consumo de diferentes fontes pro-teicas na ingestão alimentar e gasto energético em indivíduos eutróicos. Sujeitos e métodos: Preparações (caseína, proteína da soja, proteína do soro de leite ou controle) foram ingeridas no desjejum, durante sete dias consecutivos. Resultados: A caseína resultou em menor inges-tão calórica do que o soro de leite. Houve uma menor ingesinges-tão calórica no último dia da sessão da caseína em relação ao primeiro dia. Preparações contendo proteína da soja resultaram em maior termogênese induzida pela dieta (TID) em comparação às preparações controle. O co-ciente respiratório (CR) obtido na sessão do soro de leite foi menor que na sessão controle e da proteína da soja. Conclusão: Esses resultados sugerem que o consumo de diferentes tipos de proteínas resulta em efeitos distintos na saciedade (caseína), TID (proteína da soja) e/ou CR (proteína do soro). Arq Bras Endocrinol Metab. 2010;54(1):45-51
Descritores
Apetite; ingestão alimentar; gasto energético; proteína da soja; caseína
INTRODUCTION
A
mong the macronutrients, protein has a higher sa-tiety power than carbohydrate and fat (1,2). This effect has been attributed to the higher thermogenic re-sponse of protein (2,3). Studies involving humans sug-gest that different protein sources may differ in their satiating capacity (4,5). However, Lang and cols. (6) did not observe any effect of protein quality on satiety.This discrepancy could be attributed to methodological problems, which can hamper the interpretation of the results reported in these studies.
Cop
yright
© ABE&M t
odos os dir
eit
os r
eser
vados
.
observed. However, besides the fact that the subjects could freely ingest tea and coffee with the test meal, the test foods differed in macronutrient and iber content. Considering that caffeine can stimulate both lypolysis and energy expenditure (7), the ingestion of caffein-ated drinks must be controlled in such studies. The dif-ferences in terms of macronutrients also compromise the interpretation of the results (8).
A higher satiety was observed after the ingestion of ish, compared to beef and chicken. However, 24-hour energy intake was not evaluated (9). It was shown that short-term evaluation of meal response may not predict its effect on satiety and, consequently, caloric ingestion in the following 24 hours (10). Such fact indicates the need to conduct long-term interventional studies to evaluate the effect of protein sources on energy balance. The results of some studies indicate that the higher thermogenic effect attributed to proteins can be medi-ated by the increase in protein synthesis and in ATP consumption for peptide bond synthesis, as well as by the increase in protein turnover associated with a high-er ingestion of this macronutrient (11,12). In a study involving 12 overweight men, it was observed that a pork diet ingestion resulted in greater energy expen-diture as compared to a soy diet ingestion (13). The result of this study suggests that the protein’s effect on thermogenesis might be related to the biological value of the ingested protein.
Considering the possible effects of protein qual-ity on obesqual-ity prevention, the present study aimed to evaluate the effect of consumption of different protein sources (casein, whey protein and soy protein) on ap-petite and energy metabolism.
SUBjECTS AND METHODS
Since protein satiating effect may vary according to ha-bitual protein intake (8), recruited individuals had an habitual protein intake ranging from 10% to 15% of their daily energy intake. The subjects presented mean fasting glycemia of 85.2 ± 18.26 mg/dL and mean triglyceride concentration of 108.6 ± 56.41 mg/dL, which were assessed by capillary inger-stick blood samples (Accu-trend GCT, Roche), after a 12-hour overnight fast.
The study consisted of four 7-day experimental ses-sions (control, whey protein, casein, and soy protein), separated by a washout period of at least 7 days. All 24 subjects participated in these irst three sessions, but only 10 participated in the soy protein session. In each
session, subjects randomly ingested breakfast prepara-tions with or without the test proteins. Each subject ingested a daily portion of the preparation containing 0.5 g of the test protein per kilogram of body weight.
On day 1 of the irst experimental session, after a 12-hour overnight fast, subjects reported to the labora-tory and had their weight, height and body composi-tion assessed. On days 1 and 7 of each experimental session, appetitive sensations were determined before, immediately after (0 minutes) and for 2 hours (60 and 120 minutes) following breakfast. On these same days, after a 12-hour overnight fast, resting energy expen-diture (REE), respiratory quotient (RQ) and diet-in-duced thermogenesis (DIT) were measured. Following that, they were allowed to conduct their usual daily ac-tivities, keeping a free-feeding dietary record of all the food ingested. The level of physical activity conducted by the participants and their appetitive sensations were assessed during the whole study. The study protocol was approved by the Human Subjects Review Commit-tee of the Federal University of Viçosa (MG), Brazil.
Physical activity assessment
From day 1 to 7 of each experimental session, partici-pants maintained 24-hour physical activity logs. Physi-cal activity data obtained were analyzed with the Nutri Quest program, version 2.1 (McGraw-Hill, Columbus, OH, USA).
Test preparations
Cop
yright
© ABE&M t
odos os dir
eit
os r
eser
vados
.
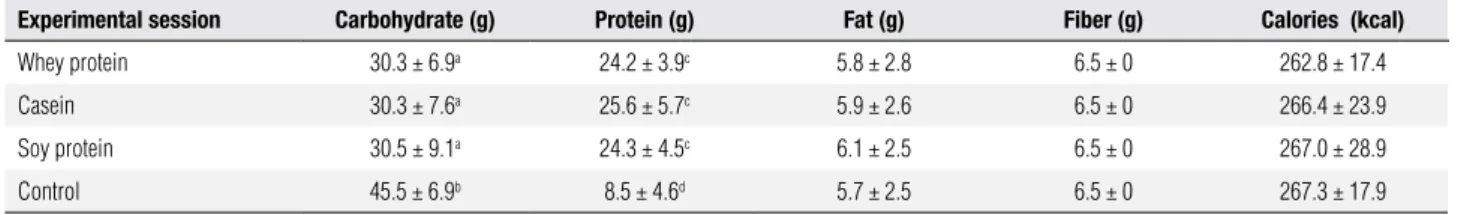
Table 1. Mean ± SD macronutrient composition, fiber content, and calories presented by the preparations served for breakfast in the four experimental sessions of the study
Experimental session Carbohydrate (g) Protein (g) Fat (g) Fiber (g) Calories (kcal)
Whey protein 30.3 ± 6.9a 24.2 ± 3.9c 5.8 ± 2.8 6.5 ± 0 262.8 ± 17.4
Casein 30.3 ± 7.6a 25.6 ± 5.7c 5.9 ± 2.6 6.5 ± 0 266.4 ± 23.9
Soy protein 30.5 ± 9.1a 24.3 ± 4.5c 6.1 ± 2.5 6.5 ± 0 267.0 ± 28.9
Control 45.5 ± 6.9b 8.5 ± 4.6d 5.7 ± 2.5 6.5 ± 0 267.3 ± 17.9
Values in each column followed by different letters are significantly different from each other (p = 0.05 (a, b), and p = 0.01 (c, d)) (Kruskal-Wallis test).
Rest energy expenditure and diet induced thermogenesis assessments
Participants were instructed to avoid alcohol consump-tion and to refrain from heavy physical activity on the day preceding the tests. On days 1 and 7 of each ex-perimental session, subjects reported to the laboratory after a 12-hour overnight fast. Following the anthro-pometric and body composition assessments, subjects rested in a quiet and dark room in supine position for 30 minutes before the test began. REE was assessed during the next 30 minutes. Following that, subjects ingested the test preparation within 15 minutes. DIT was measured for 60 minutes.
REE and DIT were assessed in the supine position through indirect calorimetry (Deltatrac II® Datex,
Fin-land). The respiratory quotient (RQ) was calculated as CO2 produced/O2 consumed. RQ was converted into kilocalo-ries of heat produced per body surface area per hour and extrapolated to total energy expenditure (TEE) (15,16).
Food intake and appetitive ratings assessments
In the irst visit to the laboratory, participants were oriented to keep free-feeding dietary records. Plastic food models were used for estimations of portion size. Three-day food records (two non-consecutive week-days and one weekend day) were recorded at baseline. Food intake on days 1 and 7 of each study session was evaluated through the analysis of dietary records containing all the foods ingested over 24-hours after test preparation consumption. Each dietary record was reviewed with the participant to ensure accuracy and completeness. Food records were evaluated using country speciic nutrient databases.
Subjective appetitive ratings of hunger, fullness, de-sire to eat, and prospective consumption were obtained using the Satiety Labeled Intensity Magnitude Scale test (17). Participants completed the appetitive rating questionnaire immediately before and at 0 (immediate-ly after the meal), 60 and 120 minutes after breakfast
(throughout the study), lunch and dinner (on days 1 and 7 of each study session) consumption.
Appetite ratings
Appetite was assessed by ratings of hunger, desire to eat, and fullness at stipulated times (18). Food pleas-antness was rated after initial tasting. All ratings were made on general labeled magnitude scales (5,8).
Statistical analyses
Statistical analyses were conducted using the SPSS soft-ware (SPSS Inc, Chicago, IL), version 11.5. Descriptive statistics are presented in mean ± standard error unless it was otherwise indicated. The statistical signiicance criterion adopted was p < 0.05. Analyses of the data ob-tained on days 1 and 7 of each session were performed by the Wilcoxon test, while comparisons among ses-sions were performed by the Mann-Whitney test. The data obtained daily at each session were evaluated by analysis of variance (ANOVA) for variables with a nor-mal distribution and the Kruskal-Wallis test for those not presenting a normal distribution.
RESULTS
Twenty-six subjects (13 men and 13 women), aged 23.5 ± 3.95 years, with a mean body mass index (BMI) of 20.5 ± 1.46 kg/m² (19), a mean body fat of 18.41 ± 8.02% (measured by tetra polar bioelectrical impedance analysis, model TBF-300, Tanita), and dietary restraint ≤ 14 (20) were recruited for the study.
Cop
yright
© ABE&M t
odos os dir
eit
os r
eser
vados
.
Table 2. Mean ± SD macronutrient and energy intake during the 7 days of the study at baseline and on each experimental session Baseline
(n = 24)
Control (n = 24)
Whey protein (n = 24)
Casein (n = 24)
Soy protein (n = 10)
Carbohydrate (g) 322.1 ± 92.1 379.3 ± 129.2 350.3 ± 106.3 366.3 ± 92.4 353.0 ± 78.6
Protein (g) 81.8 ± 16.3a 91.2 ± 29.3ab 108.9 ± 24.4b 115.5 ± 24.4b 108.7 ± 24.4b
Fat (g) 69.8 ± 19.1 68.9 ± 17.9 63.5 ± 15.2 75.0 ± 34.5 79.8 ± 26.1
Energy (kcal) 2193.6 ± 563.8 2369.6 ± 620.9 2557.1 ± 588.3 2471.3 ± 803.4 2572.9 ± 576.3
Kruskal-Wallis test.
Lines followed by the same letter are not significantly (p > 0.33) different from each other. Lines followed by different letters are significantly different (p < 0.001) from each other.
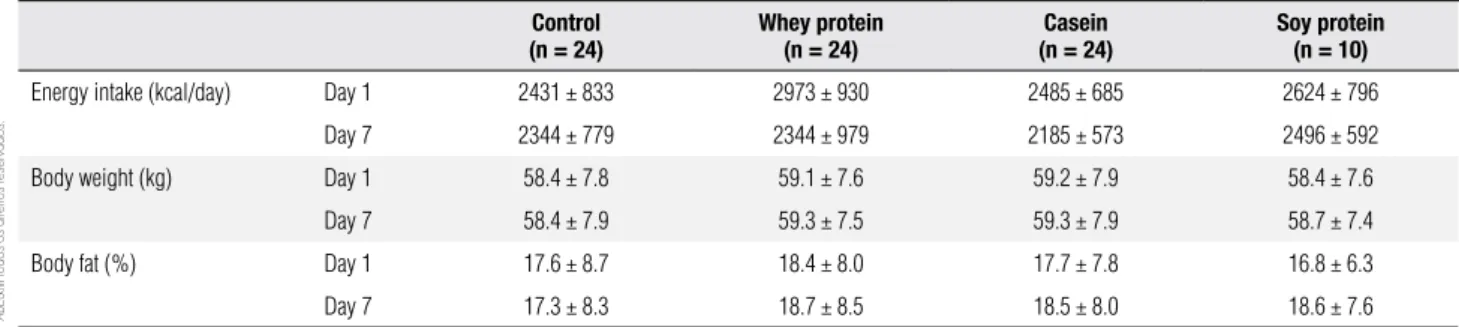
Table 3. Mean ± SD energy intake, body weight and body fat presented by the subjects on day 1 and day 7 of each experimental session Control
(n = 24)
Whey protein (n = 24)
Casein (n = 24)
Soy protein (n = 10)
Energy intake (kcal/day) Day 1 2431 ± 833 2973 ± 930 2485 ± 685 2624 ± 796
Day 7 2344 ± 779 2344 ± 979 2185 ± 573 2496 ± 592
Body weight (kg) Day 1 58.4 ± 7.8 59.1 ± 7.6 59.2 ± 7.9 58.4 ± 7.6
Day 7 58.4 ± 7.9 59.3 ± 7.5 59.3 ± 7.9 58.7 ± 7.4
Body fat (%) Day 1 17.6 ± 8.7 18.4 ± 8.0 17.7 ± 7.8 16.8 ± 6.3
Day 7 17.3 ± 8.3 18.7 ± 8.5 18.5 ± 8.0 18.6 ± 7.6
Values obtained on day 1 and day 7 are not significantly different (p ≥ 0.234) from each other (Wilcoxon test).
Body composition was not affected among the ex-perimental sessions. The increase in protein ingestion during the study did not reduce energy intake compared to baseline (Table 3). Participants maintained their level of physical activities constant during the study.
A reduction in fullness (soy protein session) and in prospective consumption (control session) ratings was observed between days 1 and 7 of the study. However, food intake was not affected during these two sessions. The consumption of casein-based preparation led to a lower (p = 0.021) daily energy intake than whey pro-tein-based preparations (Figure 1A). Moreover, there was a reduction (p = 0.022) in energy intake on day 7 compared to day 1 of the casein session (Figure 1B).
There was a higher (p ≤ 0.035) DIT for the soy pro-tein session than for the control session on days 1 and 7. The DIT achieved for the soy protein session was high-er (p = 0.024) than the whey protein session on day 7 (Figure 2). The RQ veriied for the whey protein ses-sion was lower than that observed for the control (p ≤ 0.030) (Figure 3A) and soy protein (p ≤ 0.027) sessions (Figure 3B) on days 1 and 7. The consumption of whey protein led to a lower (p = 0.015) RQ than the one observed on day 7 of the control session (Figure 3A).
DISCUSSION
In the present study, the mean protein ingestion in-creased from approximately 1.4 g of protein per kilo-gram of body weight or 14.9% of kcal/day (at baseline) to 1.9 g/kg or 18.3% of kcal/day (during the study). However, this protein intake increase was not suficient to cause a reduction in energy intake. Nevertheless, It should be noted that the protein intake in this study was lower than that observed in another study (18,21-23) in which a reduction in food intake was observed.
A reduction in fullness and in prospective consump-tion ratings was observed in the soy protein and con-trol sessions, respectively. However, daily energy in-take was not affected in those sessions. These results indicate that subjective appetitive ratings may not be a good proxy measure of food intake (24-26). Thus, a subjective evaluation of appetite may be considered as a method less precise than a direct evaluation of food intake to determine energy balance.
Cop
yright
© ABE&M t
odos os dir
eit
os r
eser
vados
.
Figure 1. Mean energy intake (kcal/day) (n = 26) ± SE associated with the consumption of preparations containing one of the test proteins (whey protein, casein, soy protein) or without any of the test proteins (control session) for breakfast, during 7 consecutive days (A) (Mann-Whitney test), and on day 1 and day 7 of each study session (B) (Wilcoxon test). Values indicated above differ significantly from each other (a p = 0.021; b p = 0.022).
Figure 2. Mean diet induced thermogenesis (DIT) ± SE (n = 10) obtained on days 1 and 7 of the study sessions (Wilcoxon test). Test preparations containing one of the test proteins (whey protein, casein, soy protein sessions) or without any of the test proteins (control session) were ingested for 7 consecutive days. Values indicated above differ significantly from each other (a p = 0.015; b p = 0.035; c p = 0.024).
Figure 3. Mean respiratory quotient (RQ) ± SE presented by the subjects who participated in 3 (n = 26) (A) or 4 (n = 10) (B) study sessions. Test preparations containing one of the test proteins (whey protein, casein, soy protein sessions) or without any of the test proteins (control session) were ingested for 7 consecutive days. The values indicated above differed significantly from each other (a p = 0.030; b p = 0.000; c p = 0.015; d p = 0.031; e p = 0.008; f p = 0.027).
and GLP-1), our study used questionnaires to evalu-ate appetitive sensations. Alterations in hormone levels might be more sensitive to detect changes in appetite sensations than the questionnaires applied in the pres-ent study.
In the present study, the consumption of casein for 7 consecutive days led to a lower daily energy intake than whey protein. Moreover, there was a reduction in caloric intake on day 7 as compared to day 1 of the casein session. The stronger reduction in food intake of casein may be attributed to its slower gastric empty-ing rate in comparison to whey protein (28). Accord-ing to some authors (27,29), a delay in gastric emp-tying can favor increased satiety. However, in another study (4) there was a lower energy intake 90 minutes after the consumption of whey protein compared to ca-sein. Some authors point out that a short-term food
3500
3000
2500
2000
1500
1000
500
0
Energy intake (kcal/day)
Control
a
Whey protein Casein
3000
2500
2000
1500
1000
500
0
Energy intake (kcal/day)
Control Whey protein
b
Day 1 Day 7
Casein
400
350
300
250
200 150
100 50
0
DIT (kcal/day)
Control Whey protein a
c b
Day 1 Day 7
Casein Soy protein
0.90
0.89
0.88
0.87
0.86
0.85
0.84
0.83
0.82
RQ (VCO2/VO2)
a b
c
Control Whey protein Casein
0.92
0.90
0.88
0.86 0.84
0.82
0.80
RQ (VCO2/VO2)
Control Whey protein f
e d
Day 1 Day 7
Casein Soy protein
A A
B
Cop
yright
© ABE&M t
odos os dir
eit
os r
eser
vados
.
response evaluation may not predict satiety effects and consequently, energy intake in the following 24 hours (10). Therefore, the difference in the results of these two studies might be due to the period of time in which this type of response was assessed.
A higher DIT was observed during the soy protein session as compared to the control session (higher car-bohydrate content) in this study. In another study (30) it was also observed that consumption of soy protein hydrolysate induced a higher DIT than that observed after consumption of a high carbohydrate load. Such result was attributed to higher glucagon secretion in re-sponse to a soy protein hydrolysate load, which causes an increase in post-prandial thermogenesis. The higher content of branched amino acids in soy protein com-pared to whey protein may also have affected DIT in this study. Higher levels of branched amino acids are good predictors of glucagon secretion (30).
The consumption of whey protein-based prepara-tions led to lower RQ than the control and soy protein preparations. This result suggests that the consumption of whey protein might favor a higher increase in fat lipid oxidation (31) and a lower risk of weight gain (32). Despite the changes detected in DIT and RQ, no dif-ference in total energy expenditure was detected in the four treatments applied in this study. Further studies are necessary to evaluate long-term effects of protein qual-ity on body weight and body composition in humans.
CONCLUSIONS
A daily consumption of approximately 2 g of protein per kilogram of body weight for seven consecutive days was not suficient to cause a reduction in energy intake as compared to the consumption of 1.4 g/kg. How-ever, besides leading to a reduction in energy intake on the last day in relation to the irst day of casein session, casein consumption led to a lower daily energy intake than whey protein. Thus, casein presented a stronger satiety power than whey protein. Due to its higher TID, soy protein may have an important effect on post-prandial energy expenditure compared to whey protein and control preparations. The lower RQ obtained in response to the whey protein consumption compared to the soy protein and the control preparations suggests that whey protein consumption may favor body weight and body fat control.
Acknowledgments: this study was supported by grants from the Brazilian government organization CNPq (Conselho Nacional
de Desenvolvimento Cientíico e Tecnológico). Thanks to Jeffrey Ryan Oar from Oregon State University for the English revision of this article.
Disclosure: no potential conlict of interest relevant to this article was reported.
REFERENCES
1. Jequier E. Pathways to obesity. Int J Obes Relat Metab Disord. 2002;26(2):S12-7.
2. Paddon-Jones D, Westman E, Mattes RD, Wolfe RR, Astrup A, Westerterp-Plantenga M. Protein, weight management, and sa-tiety. Am J Clin Nutr. 2008;87(5):1558S-1561S.
3. Westerterp-Plantenga MS. Protein intake and energy balance. Re-gul Pept. 2008;149(1-3):67-9.
4. Hall WL, Millward SJL, Morgan LM. Casein and whey exert diffe-rent effects on plasma amino acid proiles, gastrointestinal hor-mone secretion and appetite. Br J Nutr. 2003;89:239-48. 5. Luhovyy BL, Akhavan T, Anderson GH. Whey proteins in the
regula-tion of food intake and satiety. J Am Coll Nutr. 2007;26(6):704S-12S. 6. Lang V, Bellisle F, Oppert JM, Craplet C, Bornet FRJ Slama G.
Sa-tiating effect of proteins in healthy subjects: a comparison of egg albumin, casein, gelatin, soy protein, pea protein, and wheat glu-ten. Am J Clin Nutr. 1998;67:1197-204.
7. Acheson KJ, Gremaud G, Meirim I, Montigon F, Krebs Y, Fay LB, et al. Metabolic effects of caffeine in humans: lipid oxidation or futile cycling? Am J Clin Nutr. 2004;79(1):40-6.
8. Long SJ, Jeffcoat AR, Millward DJ. Effect of habitual dietary-pro-tein intake on appetite and satiety. Appetite. 2000;35:79-88. 9. Uhe AM, Collier GR, O’Dea K. A comparison of the effects of beef,
chicken and ish protein on satiety and amino acid proiles in lean male subjects. J Nutr. 1992;122:467-72.
10. Holt SHA, Miller BJ. Increased insulin response to ingested foods are associated with lessened satiety. Appetite. 1995;24:43-54. 11. Garlick PJ, Mcnurlan MA, Ballmer PE. Inluence of dietary protein
intake on whole-body protein turnover in humans. Diabetes Care. 1991;14:1189-98.
12. Giordano M, Castellino P. Correlation between amino acid indu-ced changes in energy expenditure and protein metabolism in humans. Nutrition. 1997;13:309-12.
13. Mikkelsen PB, Toubro S, Astrup A. Effect of fat-reduced on 24-h energy expenditure: comparisons between animal protein, vege-table protein and carbohydrate. Am J Clin Nutr. 2000;72:1135-41. 14. Merril EP, Kramer FM, Cardello A, Schutz H. A comparison of
sa-tiety measures. Appetite. 2002;39:181-3.
15. Buscemi S, Caimi G, Verga S. Resting metabolic rate and posta-bsorptive substrate oxidation in morbidly obese subjects before and after massive weight loss. Int J Obes. 1996;20(1):41-6. 16. Valtueña S, Salas-Salvadó J, Lorda PG. The respiratory
quo-tient as a prognostic factor in weight-loss rebound. Int J Obes. 1997;21(9):811-7.
17. Cardello AV, Schutz HG, Lesher Ll, Merrill E. Development and testing of a labeled magnitude scale of satiety. Appetite. 2005;44:1-13.
18. Lejeune MP, Kovacs EM, Westerterp-Plantenga MS. Additional protein intake limits weight regain after weight loss in humans. Br J Nutr. 2005;93:281-9.
Cop
yright
© ABE&M t
odos os dir
eit
os r
eser
vados
.
20. Strunkard AJ, Messick S. The three factor eating questionnaire to measure dietary restraint, desinhibition, and hunger. J Psycho-som Res. 1985;29:71-83.
21. Farnsworth E, Luscombe ND, Noakes M, Wittert, Argyiou E, Clif-ton PM. Effect of high-protein, energy-restricted control, and lipid concentration in overweight and hyperinsulinemic men and wo-men. Am J Clin Nutr. 2003;78;31-9.
22. Skov AR, Toubro S, Ronn B, Holm L, Astrup A. Randomized trial on protein vs carbohydrate in ad libitum fat reduced diet for tre-atment of obesity. Int J Obes Relat Metab Disord. 1999;23:528-36. 23. Weigle DS, Breen PA, Matthys CC, Callahan HS, Meeuws KE, Bur-den VR, et al. A high-protein diet induces sustained reductions in appetite, ad libitum caloric intake, and body weight despite compensatory changes in diurnal plasma leptin and ghrelin con-centrations. Am J Clin Nutr. 2005;82:41-8.
24. Ball SD, Keller KR, Moyer-Mileur LH, Ding Y, Donaldson D, Ja-ckson D. Prolongation of satiety after low versus moderately high glycemic index meals in obese adolescents. Pediatrics. 2003;111:488-94.
25. Bartoshuk LM, Duffy VB, Green BC, Hoffman HJ, KO CW, Lucchi-na LA. Valid across-group comparisons with labeled scales: the gLMS versus magnitude matching. Physiol Behav. 2004;82:109-11. 26. Stubbs RJ, Hughes DA, Johnstone AM, Rowley E, Reid C, Elia M,
et al. The use of visual analogue scales to assess motivation to eat
in human subjects: a review of their reliability and validity with an evaluation of new hand-held computerized systems for temporal tracking of appetite ratings. Br J Nutr. 2000;84(4):405-15. 27. Capasso R, Izzo AA. Gastrointestinal regulation of food intake:
ge-neral aspects and focus on anandamide and oleoylethanolamide. J Neuroendocrinol. 2008;20 Suppl 1:39-46.
28. Fox M, Georgi G, Boehm G, Menne D, Fried M, Thumshirn M. Die-tary protein precipitation properties have effects on gastric emp-tying in healthy volunteers. Clin Nutr. 2004;23(4):641-6. 29. Gallagher TK, Geoghegan JG, Baird AW, Winter DC.
Implica-tions of altered gastrointestinal motility in obesity. Obes Surg. 2007;17(10):1399-407.
30. Claessens M, Calame W, Siemensma AD, Saris WH, van Baak MA. The thermogenic and metabolic effects of protein hydrolysa-te with or without a carbohydrahydrolysa-te load in healthy male subjects. Metabolism. 2007;56(8):1051-9.
31. Melanson EL, Donahoo WT, Grunwald GK, Schwartz R. Changes in 24-h substrate oxidation in older and younger men in response to exercise. J Appl Physiol. 2007;103(5):1576-82.