Effect of the inclusion of mobile phone
interviews to Vigitel
Regina Tomie Ivata BernalI, Deborah Carvalho MaltaII, Rafael Moreira ClaroII, Carlos Augusto MonteiroI
I Núcleo de Pesquisas Epidemiológicas em Nutrição e Saúde. Faculdade de Saúde Pública. Universidade de São Paulo. São Paulo, SP, Brasil
II Departamento de Enfermagem Materno Infantil e Saúde Pública. Escola de Enfermagem. Universidade Federal de Minas Gerais. Belo Horizonte, MG, Brasil
ABSTRACT
OBJECTIVE: To evaluate the impact on the prevalence changes of risk factors for chronic diseases, published in the Surveillance System of Risk and Protection Factors for Chronic Diseases by Telephone Survey (Vigitel), after the inclusion of data from the population only with mobile phone. METHODS: Our study used data from the 26 State capitals and Federal District of Brazil obtained by the National Survey on Health (PNS) and Vigitel, both held in 2013. In each capital, we added a subsample of 200 adults living in households with only mobile phones, extracted from PNS, to the Vigitel 2013 database, with approximately 1,900 households, named Vigitel dual frame. RESULTS: Vigitel results showed absolute relative biases between 0.18% and 14.85%. he system underestimated the frequency of adult smokers (10.77%), whole milk consumption (52.82%), and soft drink consumption (22.22%). Additionally, it overestimated the prevalence of hypertension (25.46%). In the simulations using Vigitel dual frame, with inclusion of the sample of adults living in households with only mobile phones, the bias of estimates was reduced in ive out of eight analyzed indicators, with greater efects in regions with lower rates of landline coverage. In comparing regions, we observed negative correlation (ρ = −0.91) between the percentage of indicators with presence of bias and the percentage of households with only mobile phone. CONCLUSIONS: he results of this study indicate the beneits of including a subsample of 200 adults with only mobile phone on the Vigitel sample, especially in the capitals of the North and Northeast regions.
DESCRIPTORS: Interviews as Topic. Cell Phones, utilization. Frames. Data Collection. Health Surveys. Chronic Disease, epidemiology.
Correspondence: Regina Tomie Ivata Bernal
Núcleo de Pesquisas Epidemiológicas em Nutrição e Saúde,
Faculdade de Saúde Pública – USP Av. Dr. Arnaldo, 715
01246-904 São Paulo, SP, Brasil E-mail: [email protected] Received: 1 Aug 2016 Approved: 5 Jan 2017
How to cite: Bernal RTI, Malta DC, Claro RM, Monteiro CA. Effect of the inclusion of mobile phone interviews to Vigitel. Rev Saude Publica. 2017;51 Suppl 1:15s.
Copyright: This is an open-access article distributed under the terms of the Creative Commons Attribution License, which permits unrestricted use, distribution, and reproduction in any medium, provided that the original author and source are credited.
2s Vigitel dual frame Bernal RTI et al.
https://doi.org/10.1590/S1518-8787.2017051000171
INTRODUCTION
In 2015, the population-based Surveillance System of Risk and Protection Factors for Chronic Diseases by Telephone Survey (Vigitel), conducted in the 26 capitals and Federal District of Brazil, completed 10 years1. he advantages of adopting a surveillance system by telephone are numerous: practicality; agility to detect changes in trends; lower cost; quickness in collecting information; besides the opportunity to continually support the planning of public policies and guidelines of programs for health promotion and prevention of risk and chronic noncommunicable diseases (CNCD)2.
Vigitel uses, since its origin, post-stratiication weights to correct the bias resulting from the exclusion of the population segment without landline. his strategy aims to equate the sample studied by Vigitel (population with landline) with that of the cities studied (with and without landline) according to predeined features1. From 2006 to 2011, the system used population data from Census 2000, by the Brazilian Institute of Geography and Statistics (IBGE)a, to construct post-stratiication weights by the cell weighting method3. During this period, several studies evaluated the presence of biases in estimates published by Vigitel, by comparing results obtained in household surveys and Vigitel. he results presented biases in some indicators released by Vigitel, in cities with high4-7, average4,8, and low4,9,10 landline coverage. In Rio Branco, because of the exclusion of 60% of households without access to landline, Bernal et al.9 showed that the post-stratiication weights of Vigitel did not ix potential biases of the prevalence of practice of physical activity in free time, hypertension, asthma, asthmatic bronchitis, chronic bronchitis, or emphysema in the city.
In 2012, Vigitel changed the methodology of constructing post-stratiication weights from cell to rake11. he rakemethod allows the use of diferent sources of population data, even in the intercensal period, for estimating the post-stratiication weights. For each capital, annual population estimates were obtained by age group (six categories) and by education level stratiied by sex (eight categories). his method works one variable at a time, equating the total distribution of the variable in the sample, weighted by the sample weights, and in the population, by iteration procedures. his process is then repeated in each variable used in the construction of weights, causing the sample distribution to be identical to that of the population for these variables. he new post-stratiication weights of Vigitel, for each capital, were estimated in the SAS statistical package using the rakinge.sas macro12. hus, Vigitel results follow the demographic transition of the population13.
However, these adjustments are not suicient to eliminate biases arising from the insuicient landline coverage. Data from Census 2010b show that 61% of private households located in the 26 capitals and Federal District have landline, with heterogeneous distribution in the Country. he North and Northeast regions present 38% and 44% coverage, respectively, while the Midwest, South, and Southeast regions have 56%, 70%, and 74% coverage, respectively. hese data show that the frame of landline subscribers in the North region excludes at least 62% of the study population. he Northeast and Midwest regions have exclusion of at least 56% and 44%, respectively. his scenario of low landline coverage can lead to biased estimates, being especially relevant in the capitals of North, Northeast, and Midwest regions. In the South and Southeast, with higher coverage rates, we expect the introduced biases to be negligible.
However, because of the technological changes that have occurred in recent years, the monitoring of the coverage of landline and mobile telephony in the capitals is essential to Vigitel. In 2013, the Annual Report of Anatelc showed exponential increase of the access to personal mobile service since the early 2000s, with slowing growth since 2012.
Also, data from the National Survey on Health 2013d indicate that the Southeast, South, and Midwest regions present the largest landline coverage, ranging between 61% and 75%, while the North and Northeast present coverage of 34% and 44%, respectively. However, these regions with low landline coverage have a high coverage of households with only mobile phones (63% in the North and 54% in the Northeast)d.
a Instituto Brasileiro de Geografia e Estatística. Censo demográfico 2000: downloads: estatísticas. Rio de Janeiro: IBGE; s.d. [cited 2013 Dec 12]. Available from: http://downloads.ibge.gov.br/ downloads_estatisticas.htm b Instituto Brasileiro de Geografia e Estatística. Microdados do Censo 2010: downloads: estatísticas. Rio de Janeiro: IBGE; s.d. [cited 2013 May 14]. Available from: http://downloads. ibge.gov.br/downloads_ estatisticas.htm c Agência Nacional de Telecomunicações. Relatório anual 2013. Brasília (DF): ANATEL; 2013 [cited 2016 May 13]. Available from: http:// www.anatel.gov.br/Portal/ verificaDocumentos/documento. asp?numeroPublicacao=312603 &pub=original&filtro=1&docum entoPath=312603.pdf
his study aimed to assess the impact of including data from the population with only mobile phones in the Vigitel estimates.
METHODS
Our study used data from the National Survey on Health (PNS)d and Vigitel14, both held in 2013.
PNS is population-based household survey conducted by IBGE in partnership with the Brazilian Ministry of Health, with 62,986 households interviewed across the Country. he sampling procedure was composed of simple random sampling, by conglomerates, divided into three stages: census tracts (primary units); households (secondary units); and an adult dweller – 18 years or older – (tertiary unit), selected from the list of residents built at the moment of interview to respond to the speciic questionnaire. Were deined sample weights for primary sampling units, households and all their residents, and the weight for the selected dweller. he minimum size of the sample was 1,800 households per Federative Unit15. his study used a sample of adults aged 18 years or older living in residence without landline, in the urban areas of the 26 State capitals and Federal District, totaling 28,493 interviews.
Vigitel, in turn, is a telephone survey conducted by the Brazilian Ministry of Health in partnership with the Center for Epidemiological Research in Nutrition and Health of USP (NUPENS/USP) since 2006. he target population are adults (≥ 18 years) living in the 26 capitals of Brazil and in the Federal District. he system uses the electronic registers of landlines to randomly select probabilistic samples of residential lines. Initially, they randomly select 5,000 landlines in each city. hese samples are divided into 25 replicas with size equal to 200 in each one, using the same process of random selection of the initial sample. From the identiication of landlines eligible to the study (residential and active lines), one adult living in the house is randomly selected to be interviewed. In 2013, year of the Vigitel edition used in this study, the interviews were conducted from February to December, with minimum sample size of 1,900 interviews per city, reaching a total sample of 52,929 respondents. Post-stratiication weights are used to adjust the sample distribution (with landline), according to age, sex, and education level, for the total population (with and without landline)14.
More information about the sampling process of both surveys can be obtained in the original publication of their results14,15.
Landline and Mobile Phone Coverage
PNS surveyed the ownership, by households, of landline and mobile phone. hese data were used in the irst step to describe landline coverage by region and, also, the sociodemographic proile of the population according to age, education level, and sex, stratiied by telephone ownership proile (according to three categories: landline, mobile phone only, and no phone) and by region.
Estimate of Bias in Vigitel Estimates
he second stage of the study consisted of estimating the Vigitel bias by comparing the frequencies obtained in Vigitel and PNS. In this stage, we selected the indicators considered comparable ( from the questions and response options that are similar between both surveys). hey are: frequency of adult smokers; consumption of red meat or chicken with excess fat; whole milk consumption; regular (≥ 5 days/week) soft drink, candy, and bean consumption; and self-reported medical diagnosis of hypertension and diabetes. We adopted the frequency estimated in PNS as gold standard in estimating the absolute relative bias expressed by: (1) |%Vigitel – %PNS|
4s Vigitel dual frame Bernal RTI et al.
https://doi.org/10.1590/S1518-8787.2017051000171
Estimate of the Impact of Including Interviews by Mobile Phone to Vigitel
he third step of the study consisted in the simulation of dual frame, composed of landline and mobile phone samples in Vigitel 2013. Following Kish’s15 proposal, in each capital, we added a subsample of 200 adults living in households only with mobile phones to the Vigitel 2013 sample, with approximately 1,900 households, named Vigitel dual frame. his subsample was extracted from the PNS by systematic sampling, with age, education level, and sex as control variables, maintaining the distribution of the population living with only mobile phones in each capital. We adopted the frequency estimated in PNS as gold standard in estimating the absolute relative bias expressed by: (2) |%Vigitel dual frame – %PNS|
%PNS . For analyzing
Vigitel dual frame data – landline and mobile phone –, we used the rake method to build post-stratiication weights in each capital, considering the sample weight (adults/number of phones) of Vigitel and V0029 (weight of selected resident with non-interview correction without calibration by the projection of population for selected resident) of the mobile phone subsample of PNS as their respective design weights, and the population estimated by PNS as external source for estimating the post-stratiication weights of the dual frame.
he impact of including the subsample of adults living in households with only mobile phone on the Vigitel sample was deined by the expression: (3) Bias ([(Vigitel dual frame) – Bias(Vigitel)])
Bias(Vigitel) x100.
PNS was approved by the National Research Ethics Committee (Process: 328,159, June 26, 2013). Vigitel was approved by the National Human Subject Research Ethics Committee (Processes 13081/2008 and 355,590/2013). All individuals were consulted, the surveys were clariied to them, and they agreed to participate.
RESULTS
Telephone Coverage and Population Profile
he Southeast, South, and Midwest regions presented the largest landline coverage, ranging between 61% and 75%, while the North and Northeast presented coverage of 34% and 44%, respectively. he highest frequencies of households with only mobile phone were observed in the capitals of the North and Northeast regions, with 62.9% and 53.8%, respectively, with low landline coverage. he Midwest, South, and Southeast presented 38.0%, 28.0%, and 23.2%, respectively. he proportion of households without any telephone tended to be small, ranging from 1.4% in all the capitals of the Midwest to 3.1% in the capitals of the North (Figure 1).
he sociodemographic proile of the population living in household with only mobile phone difers from the population with landline in all regions, the main diference being the higher frequency of individuals in lower age groups, with less than 34 years old, and with education level up to some high school (Figure 2). In all regions, the proportion of men or women living in households with only mobile phone is similar to the proportion of men or women living in households with landline.
Bias Estimates
meat or chicken with fat and the prevalence of hypertension. In the Southeast, Vigitel underestimates the whole milk and candy consumption and overestimates the prevalence of hypertension. In the South and Midwest, Vigitel underestimates the whole milk, soft drink, and candy consumption and overestimates the prevalence of hypertension (Table 2).
* Interviews held with adults aged 18 years or older in the urban areas of the 26 State capitals and in the Federal District (n = 28,493). For more information, see Methods.
Figure 1. Distribution of residential landline coverage, according to set of capitals of each macro-region of the Country. PNS, 2013*.
Midwest South
Southeast Northeast
North
Region
%
34.1 62.9
3.1
44.1 53.8
2.1
74.6 23.2
2.2
69.9 28.3
1.9
60.6 38.0
1.4
No landline and mobile phone Mobile phone
Landline+Mobile phone
Figure 2. Distribution by age and educational level (%) according to type of access to telephony stratified by geographic region. Adult population living in the capitals, 2013.
Access to telephony
Access to telephony
Landline+Mobile phone Mobile phone
Landline+Mobile phone Mobile phone
%%
≥ 65
55−64
45−54
35−44
25−34
18−24 5.1
7.7
15.3
22.5
29.7
19.7
16.7
16.0
18.0
18.4
18.0
13.0
8.0
42.9
21.5
27.7 26.3
43.1
11.6
19.0
Higher education degree
High school/
Some higher education
Elementary or middle school/Some high school
No education/ Some middle or elementary school (a) Age
6s
V
igitel dual fr
ame
Bernal R
TI et al.
https://doi.org/10.1590/S1518-8787.2017051000171
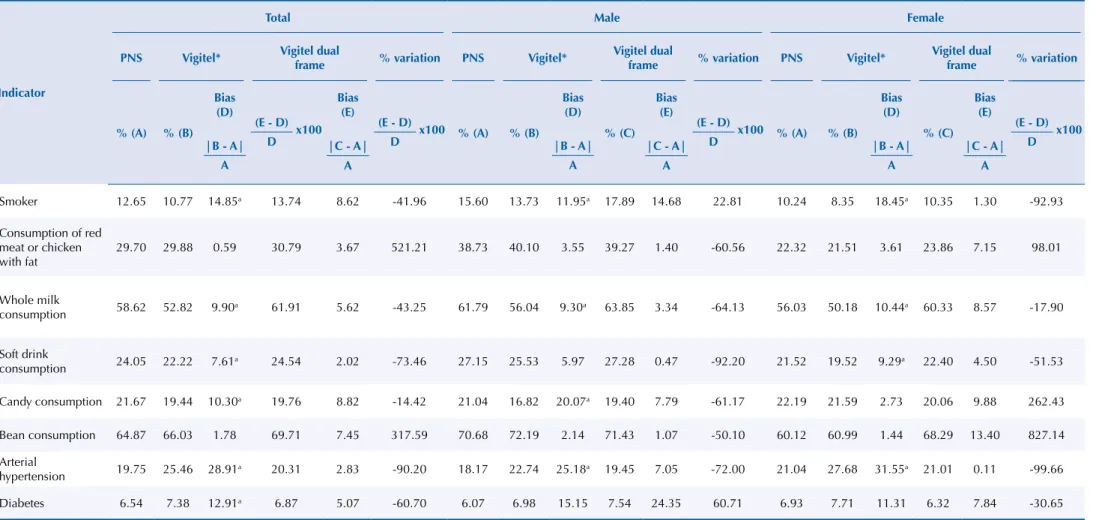
Table 1. Estimates of Vigitel 2013 biases according to indicators by sex. Population of adults living in the capitals, 2013.
Indicator
Total Male Female
PNS Vigitel* Vigitel dual
frame % variation PNS Vigitel*
Vigitel dual
frame % variation PNS Vigitel*
Vigitel dual
frame % variation
% (A) % (B)
Bias (D)
(E - D)
D x100
Bias (E)
(E - D)
D
x100 % (A) % (B)
Bias (D)
% (C) Bias
(E)
(E - D)
D
x100 % (A) % (B)
Bias (D)
% (C) Bias
(E)
(E - D)
D x100
|B - A| A
|C - A| A
|B - A| A
|C - A| A
|B - A| A
|C - A| A
Smoker 12.65 10.77 14.85a 13.74 8.62 -41.96 15.60 13.73 11.95a 17.89 14.68 22.81 10.24 8.35 18.45a 10.35 1.30 -92.93
Consumption of red meat or chicken with fat
29.70 29.88 0.59 30.79 3.67 521.21 38.73 40.10 3.55 39.27 1.40 -60.56 22.32 21.51 3.61 23.86 7.15 98.01
Whole milk
consumption 58.62 52.82 9.90a 61.91 5.62 -43.25 61.79 56.04 9.30a 63.85 3.34 -64.13 56.03 50.18 10.44a 60.33 8.57 -17.90
Soft drink
consumption 24.05 22.22 7.61a 24.54 2.02 -73.46 27.15 25.53 5.97 27.28 0.47 -92.20 21.52 19.52 9.29a 22.40 4.50 -51.53
Candy consumption 21.67 19.44 10.30a 19.76 8.82 -14.42 21.04 16.82 20.07a 19.40 7.79 -61.17 22.19 21.59 2.73 20.06 9.88 262.43
Bean consumption 64.87 66.03 1.78 69.71 7.45 317.59 70.68 72.19 2.14 71.43 1.07 -50.10 60.12 60.99 1.44 68.29 13.40 827.14
Arterial
hypertension 19.75 25.46 28.91
a 20.31 2.83 -90.20 18.17 22.74 25.18a 19.45 7.05 -72.00 21.04 27.68 31.55a 21.01 0.11 -99.66
Diabetes 6.54 7.38 12.91a 6.87 5.07 -60.70 6.07 6.98 15.15 7.54 24.35 60.71 6.93 7.71 11.31 6.32 7.84 -30.65
Note: * Weighted percentage to adjust the sociodemographic distribution of the Vigitel sample to the distribution of the adult population of the city estimated by PNS, 2013. Vigitel: Surveillance System of Risk and Protection Factors for Chronic Diseases by Telephone Survey.
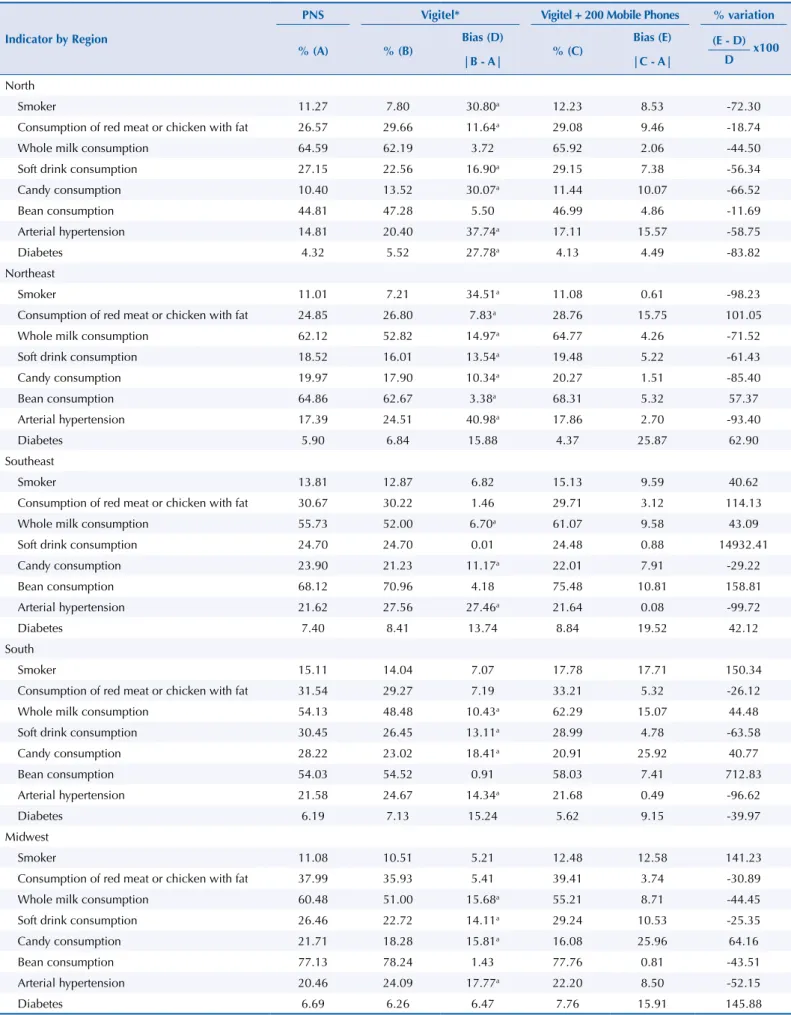
Table 2. Estimates of Vigitel 2013 biases according to indicators by region and sex. Population of adults living in the capitals, 2013.
Indicator by Region
PNS Vigitel* Vigitel + 200 Mobile Phones % variation
% (A) % (B)
Bias (D)
% (C)
Bias (E) (E - D)
D x100
|B - A| |C - A|
North
Smoker 11.27 7.80 30.80a 12.23 8.53 -72.30
Consumption of red meat or chicken with fat 26.57 29.66 11.64a 29.08 9.46 -18.74
Whole milk consumption 64.59 62.19 3.72 65.92 2.06 -44.50
Soft drink consumption 27.15 22.56 16.90a 29.15 7.38 -56.34
Candy consumption 10.40 13.52 30.07a 11.44 10.07 -66.52
Bean consumption 44.81 47.28 5.50 46.99 4.86 -11.69
Arterial hypertension 14.81 20.40 37.74a 17.11 15.57 -58.75
Diabetes 4.32 5.52 27.78a 4.13 4.49 -83.82
Northeast
Smoker 11.01 7.21 34.51a 11.08 0.61 -98.23
Consumption of red meat or chicken with fat 24.85 26.80 7.83a 28.76 15.75 101.05
Whole milk consumption 62.12 52.82 14.97a 64.77 4.26 -71.52
Soft drink consumption 18.52 16.01 13.54a 19.48 5.22 -61.43
Candy consumption 19.97 17.90 10.34a 20.27 1.51 -85.40
Bean consumption 64.86 62.67 3.38a 68.31 5.32 57.37
Arterial hypertension 17.39 24.51 40.98a 17.86 2.70 -93.40
Diabetes 5.90 6.84 15.88 4.37 25.87 62.90
Southeast
Smoker 13.81 12.87 6.82 15.13 9.59 40.62
Consumption of red meat or chicken with fat 30.67 30.22 1.46 29.71 3.12 114.13
Whole milk consumption 55.73 52.00 6.70a 61.07 9.58 43.09
Soft drink consumption 24.70 24.70 0.01 24.48 0.88 14932.41
Candy consumption 23.90 21.23 11.17a 22.01 7.91 -29.22
Bean consumption 68.12 70.96 4.18 75.48 10.81 158.81
Arterial hypertension 21.62 27.56 27.46a 21.64 0.08 -99.72
Diabetes 7.40 8.41 13.74 8.84 19.52 42.12
South
Smoker 15.11 14.04 7.07 17.78 17.71 150.34
Consumption of red meat or chicken with fat 31.54 29.27 7.19 33.21 5.32 -26.12
Whole milk consumption 54.13 48.48 10.43a 62.29 15.07 44.48
Soft drink consumption 30.45 26.45 13.11a 28.99 4.78 -63.58
Candy consumption 28.22 23.02 18.41a 20.91 25.92 40.77
Bean consumption 54.03 54.52 0.91 58.03 7.41 712.83
Arterial hypertension 21.58 24.67 14.34a 21.68 0.49 -96.62
Diabetes 6.19 7.13 15.24 5.62 9.15 -39.97
Midwest
Smoker 11.08 10.51 5.21 12.48 12.58 141.23
Consumption of red meat or chicken with fat 37.99 35.93 5.41 39.41 3.74 -30.89
Whole milk consumption 60.48 51.00 15.68a 55.21 8.71 -44.45
Soft drink consumption 26.46 22.72 14.11a 29.24 10.53 -25.35
Candy consumption 21.71 18.28 15.81a 16.08 25.96 64.16
Bean consumption 77.13 78.24 1.43 77.76 0.81 -43.51
Arterial hypertension 20.46 24.09 17.77a 22.20 8.50 -52.15
Diabetes 6.69 6.26 6.47 7.76 15.91 145.88
Note: * Weighted percentage to adjust the sociodemographic distribution of the Vigitel sample to the distribution of the adult population of the city estimated by PNS, 2013.
8s Vigitel dual frame Bernal RTI et al.
https://doi.org/10.1590/S1518-8787.2017051000171
he use of dual frame intensely reduced the biased estimates of Vigitel, especially in the capitals of regions with lower landline coverage. In the North, we observed bias reduction in the eight indicators studied, ranging from -11.7% in the case of regular consumption of beans to -83.8% in the case of medical diagnosis of diabetes. We observed a similar scenario in the Northeast and Midwest, where bias was reduced in ive out of eight indicators studied. On the other hand, in the South and Southeast, bias was reduced in three and two of the indicators, respectively, and increased in other indicators (Table 2).
In comparing regions, we observed negative correlation (ρ = -0.91) between the percentage of indicators with presence of bias and the percentage of households with only mobile phone, i.e., increased bias as the percentage of houses with only mobile phone decreases.
DISCUSSION
PNS 2013 provided an important evaluation regarding methodological changes required for the efective continuity of Vigitel. Data from PNS 2013 indicate that the capitals of the Southeast, South, and Midwest have the higher landline coverage, ranging between 61% and 75%, while the North and Northeast present coverage of 34% and 44%, respectively. Places with low landline coverage present the highest proportions of households with only mobile phone, and this was the modal condition in all the capitals of North (63%) and Northeast (54%).
In the evaluation of the estimates of relative absolute biases of Vigitel, the results show biases with the current methodology of the system. he system underestimates the percentage of adult smokers (10.77%), whole milk consumption (52.82%), soft drink consumption (22.22%), and candy consumption (19.44%) and overestimates the prevalence of hypertension (25.46%). he biggest biases were observed in the capitals of the regions with lower landline coverage: North, Northeast, and Midwest.
To completely eliminate the biases of the estimates disclosed in the telephone survey, Groves et al.16 and Brick and Lepkowski17 recommend the use of alternative methods, such as dual-frame and multiple mode and frame surveys. hese methods take more than one register for random selection and present advantages regarding the current telephone survey. However, the major challenge consists of the statistical processing to obtain valid estimates for the data from multiple frames. Currently, several telephone surveys use weighting methods to obtain estimates of dual frame18,19. With the advancement of technology, recently, algorithms for this type of approach are already available in several statistical packages. In the R program, the frames20 package, for example, ofers eight functions, with diferent estimators, for estimating mean and total, and also ofers the compare function, which describes the summary measures of the results to help choosing the best estimator for obtaining valid estimates.
A similar scenario to that observed in Brazil, of increased frequency of households with only mobile phone, has already been observed in developed countries, such as USA21 and Australia22, requiring the inclusion of new frame (or modes of data collection) in health surveys traditionally conducted by telephone interviews19,21,22.
It is worth mentioning that the process of change in the BRFSS methodology began in 2009 with pilot studies using samples of landlines and mobile phones24,25. During this period, several specialists have recommended weighting method, by the dissemination of studies that evaluated the dual frame and the diferent variables used in the construction of post-stratiication weights, to reduce bias due to low response rate26,27.
As well as BRFSS, the New South Wales Population Health Survey, conducted in Australia, added the mobile phone to the telephone survey in 2012, after several pilot studies28. In 2012, the survey used 1,224 (36.1%) mobile phones and 2,171 (63.9%) landlines, at a cost of $74.42 and $31.13 per interview, respectively. he results show that the inclusion of mobile phone did not afect the response rates nor the disclosed estimates; however, it included the young population and the indigenous people living in Torres Strait Islands, Australia, thus expanding the register coverage28.
Brazil follows this trend. In 2008, the Health Surveillance Secretariat carried out the irst pilot study of Vigitel using mobile phone survey in Belo Horizonte, with high landline coverage, and in Maceio, with low landline coverage. At the time, both individuals who had only mobile phone and those who lived in houses with landline were interviewed. In the comparison between estimates obtained in the population with landline and mobile phone, the results did not indicate the need for inclusion of mobile phone interviews to the traditional operation of Vigitel (the results showed no diference between estimates)29.
However, the increase in number of households with only mobile phone required the inclusion of this strategy to be still considered. he simulations performed in this experiment (Vigitel dual frame) propose a new approach for including individuals interviewed exclusively by mobile phone to Vigitel (inclusion of about 200 individuals living in households without a landline in the regular sample of Vigitel) and its results attest its efectiveness by showing the intense bias reduction in the frequency of the indicators analyzed, especially in the capitals of regions with lower residential landline coverage. However, the inclusion of this sample in the capitals with high landline coverage has increased bias in six indicators in the Southeast region and four in the South. In the Midwest, with average landline coverage, the bias increased in three out of eight indicators.
Between regions, the results of the Vigitel dual frame simulation show bias reduction in all indicators of the North region, which has coverage of houses with only mobile phone of about 63%. In the Northeast, with 54% coverage of houses with only mobile phones, a bias reduction can be observed in ive out of eight indicators. he Midwest, with 38% coverage, presented bias reduction in ive of the eight indicators (63%). he South, with 28% coverage, presented reduction in three out of eight indicators (38%) and the Southeast, with 23% coverage, reduction in two out of eight indicators (25%). hus, in the Southeast, South, and Midwest, the current Vigitel ofers better performance when compared to Vigitel dual frame. he main limitation of this study is connecting data obtained in the household and telephone surveys, with diferences that can be subjected to interference from the methodological efect of the survey, sampling type, questions, means of data collection, interview time, and duration of the survey.
he proposal of including mobile phones in Vigitel using random digit dialing method requires great efort, with many calls to identify the adult population living in the capital, which increases the research cost. In the irst pilot study of Vigitel, held in 2008 using the mobile phone survey in Belo Horizonte, with high landline coverage, and in Maceio, with lower landline coverage, the cost was 6.6 times greater than the cost of the interview conducted by landline, value much higher than that found in the United States (2.4 times) (including inancial incentive to the respondent)29.
10s Vigitel dual frame Bernal RTI et al.
https://doi.org/10.1590/S1518-8787.2017051000171
to be controlled by age, education level, and sex, i.e., this is a quota sampling. hus, there will be inclusion of the population excluded by Vigitel, mostly composed by young people with elementary and high school.
his proposal difers from BRFSS and New South Wales Population Health Survey, with mobile phone samples corresponding to almost half the size of the landline samples. his strategy is useful because it does not need to use quota sampling, but, on the other hand, the survey cost increases.
CONCLUSION
In the simulation of Vigitel dual frame, the results show bias reduction in ive out of eight indicators analyzed. In comparing regions, we observed negative correlation (ρ = -0.91) between the percentage of indicators with presence of bias and the percentage of households with only mobile phone, i.e., the bias increases as the percentage of houses with only mobile phone decreases. In the North and Northeast, Vigitel dual frame presents good performance in reducing Vigitel bias, while in the Southeast, South, and Midwest, the current Vigitel ofers better performance when compared to Vigitel dual frame.
herefore, the inclusion in Vigitel of a subsample of 200 adults with only mobile phone reduced, in the North and Northeast, the bias of samples of landlines registers in Brazil. We recommend further Vigitel pilot studies, interviewing users who have only mobile phones, to compare with the indings presented here.
REFERENCES
1. Monteiro CA, Moura EC, Jaime PC, Lucca A, Florindo AA, Figueiredo ICR, et al. Monitoramento de fatores de risco para doenças crônicas por entrevistas telefônicas. Rev Saude Publica. 2005;39(1):47-57. https://doi.org/10.1590/S0034-89102005000100007
2. Ministério da Saúde (BR), Secretaria de Vigilância em Saúde, Departamento de Análise de Situação de Saúde. Plano de ações estratégicas para o enfrentamento das doenças crônicas não transmissíveis (DCNT) no Brasil 2011-2022. Brasília (DF); 2011 [cited 2014 May 14]. (Série B. Textos Básicos de Saúde). Available from: http://bvsms.saude.gov.br/bvs/publicacoes/plano_ acoes_enfrent_dcnt_2011.pdf
3. Kalton G. Compensating for missing survey data. An Arbor: Institute for Social Research, Center for Social Research of The University of Michigan; 1983 [cited 2017 Feb 7]. (Research Report Series). Available from: http://www.psc.isr.umich.edu/dis/infoserv/isrpub/pdf/
CompensatingforMissingSurveyData_OCR.PDF
4. Viacava F, Souza-Junior PRB, Moreira RS. Estimativas da cobertura de mamografia segundo inquéritos de saúde no Brasil. Rev Saude Publica. 2009;43 Supl 2:117-25. https://doi.org/10.1590/S0034-89102009000900015
5. Segri NJ, Cesar CLG, Barros MBA, Carandina L, Goldbaum M. Inquérito de saúde: comparação dos entrevistados segundo posse de linha telefônica residencial. Rev Saude Publica.
2010;44(3):503-12. https://doi.org/10.1590/S0034-89102010005000012
6. Segri NJ, Francisco PMSB, Alves MCGP, Barros MBA, Cesar CLG, Goldbaum M, et al. Práticas preventivas de detecção de câncer em mulheres: comparação das estimativas dos inquéritos de saúde (ISA - Capital) e vigilância de fatores de risco e proteção para doenças crônicas por inquérito telefônico (VIGITEL - São Paulo). Rev Bras Epidemiol. 2011;14 Supl 1:31-43. https://doi.org/10.1590/S1415-790X2011000500004
7. Ferreira AD, César CC, Malta DC, Andrade ACS, Ramos CGC, Proietti FA, et al. Validade de estimativas obtidas por inquérito telefônico: comparação entre VIGITEL 2008 e Inquérito Saúde em Beagá. Rev Bras Epidemiol. 2011;14 Supl 1:16-30. https://doi.org/10.1590/S1415-790X2011000500003
9. Bernal RTI, Malta DC, Araujo TS, Silva NN. Inquérito por telefone: pesos de pos-estratificação para corrigir vícios de baixa cobertura em Rio Branco, AC. Rev Saude Publica.
2013;47(2):316-25. https://doi.org/10.1590/S0034-8910.2013047003798
10. Bernal RTI, Malta DC, Morais Neto OL, Claro RM, Mendonça BCA, Oliveira ACC, et al. Vigitel - Aracaju, Sergipe, 2008: efeitos da pós-estratificação na correção de vícios decorrentes da baixa cobertura de domicílios com telefone fixo. Rev Bras Epidemiol. 2014;17(1):163-74. https://doi.org/10.1590/1415-790X201400010013ENG
11. Kalton G, Flores-Cervantes I. Weighting methods. J Off Stat. 2003 [cited 2017 Feb 9];19(2):81-97. Available from: http://www.jos.nu/articles/abstract.asp?article=192081
12. Izrael D, Hoaglin DC, Battaglia MP. A SAS macro for balancing a weighted sample.
In: Proceedings of the Twenty-Fifth Annual SAS Users Group International Conference; 2000 Apr 9-12; Indianapolis, USA. Paper 275. [cited 2010 Dec 1]. Available from: http://www2.sas.com/ proceedings/sugi29/207-29.pdf
13. Ministério da Saúde (BR), Secretaria de Vigilância em Saúde, Departamento de Vigilância de Doenças e Agravos não Transmissíveis e Promoção de Saúde. Vigitel Brasil 2012: vigilância de fatores de risco e proteção para doenças crônicas por inquérito telefônico. Brasília (DF); 2013 [cited 2017 Feb 7]. Available from: http://bvsms.saude.gov.br/bvs/publicacoes/vigitel_ brasil_2012_vigilancia_risco.pdf
14. Ministério da Saúde (BR), Secretaria de Vigilância em Saúde, Departamento de Vigilância de Doenças e Agravos não Transmissíveis e Promoção da Saúde. Vigitel Brasil 2013: vigilância de fatores de risco e proteção para doenças crônicas por inquérito telefônico. Brasília (DF); 2014 [cited 2017 Feb 7]. Available from: http://bvsms.saude.gov.br/bvs/publicacoes/vigitel_ brasil_2013.pdf
15. Szwarcwald CL, Malta DC, Pereira CA, Vieira MLFP, Conde WL, Souza Júnior PRB, et al. Pesquisa Nacional de Saúde no Brasil: concepção e metodologia de aplicação. Cienc Saude Coletiva. 2014;19(2):333-42. https://doi.org/10.1590/1413-81232014192.14072012
16. Kish L. Survey sampling. New York: John Wiley & Sons; 1965.
17. Groves RM, Lepkowsky JM. Dual frame, mixed mode survey designs. J Off Stat. 1985 [cited 2016 May 11];1(3):263-86. Available from: http://www.jos.nu/Articles/abstract. asp?article=13263
18. Brick JM, LeprowskyJM. Multiple mode and frame telephone survey. In: Lepkowsky JM, Tucker C, Brick JM, De Leew ED, Japec l, Lavrakas PJ, et al, editors. Advances in telephone survey methodology. New York: John Wiley & Sons; 2008. p.149-69.
19. Greby SM, Knighton CL, Singleton JA, Black CL, Yankey D, Copeland KR, et al. Adding households with cell phone service to the National Immunization Survey (NIS), 2011. Atlanta: Centers for Disease Control and Prevention; 2011 [cited 2016 Jun 29]. Available from: https:// www.cdc.gov/vaccines/imz-managers/coverage/nis/child/dual-frame-sampling.html
20. Arcos A, Molina D, Ranalli MG, Rueda MM. Frames2: a package for estimation in dual frame surveys. The R J. 2015 [cited 2016 Jun 28];7(1):52-72. Available from: https://journal.r-project. org/archive/2015-1/arcos-molina-ranalli-etal.pdf
21. Blumberg JS, Luke JV. Wireless substitution: early release of estimates from the National Health Interview Survey, January–June 2011. Atlanta: CDC, National Center for Health Statistics; 2011 [cited 2016 Jun 29]. Available from: https://www.cdc.gov/nchs/data/nhis/earlyrelease/ wireless201112.pdf
22. Dal Grande E, Taylor AW. Sampling and coverage issues of telephone surveys used for collecting health information in Australia: results from a face-to-face survey from 1999 to 2008. BMC Med Res Methodol. 2010;10:77. https://doi.org/10.1186/1471-2288-10-77
23. Centers for Disease Control and Prevention. About the Behavioral Risk Factor Surveillance System (BRFSS). Atlanta: CDC; 2014 [cited 2016 Jun 29]. Available from: https://www.cdc.gov/ brfss/about/about_brfss.htm
24. Centers for Disease Control and Prevention. Methodologic changes in the Behavioral Risk Factor Surveillance System in 2011 and potential effects on prevalence estimates. MMWR Morb Mortal Wkly Rep. 2012 [cited 2016 May 11];61(22):410-3. Available from: https://www.cdc.gov/mmwr/ preview/mmwrhtml/mm6122a3.htm
12s Vigitel dual frame Bernal RTI et al.
https://doi.org/10.1590/S1518-8787.2017051000171 26. Battaglia MP, Frankel MR, Link MW. Improving standard poststratification techniques
for random-digit-dialing telephone surveys. Surv Res Methods. 2008;2(1):11-9. https://doi.org/10.18148/srm/2008.v2i1.597
27. Link MW, Battaglia MP, Frankel MR, Osborn L, Mokdad AH. Reaching the U.S. cell phone generation comparison of cell phone survey results with an ongoing landline telephone survey. Public Opin Q. 2007;71(5):814-39. https://doi.org/10.1093/poq/nfm051
28. Barr ML, Ritten JJ, Steel DG, Thackway SV. Inclusion of mobile phone numbers into an ongoing population health survey in New South Wales, Australia: design, methods, call outcomes, costs and sample representativeness. BMC Med Res Methodol. 2012;12:177. https://doi.org/10.1186/1471-2288-12-177
29. Moura EC, Claro RM, Bernal R, Ribeiro J, Malta DC, Morais Neto O. A feasibility study of cell phone and landline phone interviews for monitoring of risk and protection factors for chronic diseases in Brazil. Cad Saude Publica. 2011;27(2):277-86. https://doi.org/10.1590/S0102-311X2011000200009
Authors’ Contribution: Conception and planning of the study; critical review of the manuscript: CAM, DCM. Data collection, analysis, and interpretation; preparation and writing of the manuscript: RTIB, RMC. Critical
review of the manuscript; inal approval: RTIB.