Assessment of Aortic Valve Area Combining Echocardiography and
Magnetic Resonance Imaging
Werner Nickl
1, Reiner Füth
2, Jan Smettan
2, Till Köhler
2, Mark Lankisch
2, Frank Kramer
3, Thomas Krahn
3, Michael
Coll Barroso
1, Rolf Michael Klein
4, Wilfried Dinh
1,2CoroVital, Institute for Sports Medicine, Wuppertal1; Department of Cardiology, Witten/Herdecke University, HELIOS Klinikum Wuppertal2;
Global Biomarker Research, Bayer Schering Pharma, Wuppertal3; Augusta Hospital Düsseldorf, Department of Cardiology, Düsseldorf, Germany4
Abstract
Background: Transthoracic echocardiography (TTE) is routinely used to calculate aortic valve area (AVA) by continuity equation (CE). However, accurate measurement of the left ventricular outflow tract (LVOT) can be difficult and flow acceleration in the LVOT may lead to miscalculation of the AVA.
Objective: The aim of our study was to compare AVA measurements by standard TTE, cardiac magnetic resonance imaging (MRI) and a hybrid approach combining both techniques.
Methods: AVA was calculated in 38 patients (age 73±9 years) with standard TTE, cine-MRI planimetry and a hybrid
approach: Hybrid Method 1: TTE-derived LVOT measurement in the CE numerator was replaced by the MRI assessment of the LVOT and AVA was calculated: (LVOTMRI/*LVOT-VTITTE)/transaortic-VTITTE. Method 2: We replaced the SV in the numerator by the MRI-derived SV and calculated AVA = SVMRI/ transaortic-VTITTE.
Results: Mean AVA derived by TTE was 0.86 cm2±0.23 cm2 and 0.83 cm2±0.3 cm2 by MRI- planimetry, respectively. The mean absolute difference in AVA was 0.03cm2 for TTE vs. MRI planimetry. AVA calculated with method 1 and method 2 was 1.23 cm2±0.4cm2 and 0.92cm2±0.32cm2, respectively. The mean absolute difference between TTE and method 1 and method 2 was 0.37cm2 and 0.06cm2, respectively (p<0.001).
Conclusion: MRI-planimetry of AVA and hybrid method 2 are accurate and showed a good agreement with standard
TTE measurements. Therefore, hybrid method 2 is a reasonable alternative if poor acoustic windows or LVOT flow accelerations limit the accuracy of TTE, particularly in patients at high risk for an invasive hemodynamic study. (Arq Bras Cardiol 2012;98(3):234-242)
Keywords: Aortic valve stenosis; echocardiography; magnetic resonance spectroscopy.
Mailing Address: Wilfried Dinh •
Arrenberger Street, 20 – 42113 – Wuppertal, Germany E-mail: [email protected], [email protected]
Manuscript received June 24, 2011, revised manuscript received September 05, 2011; accepted September 28, 2011.
Nevertheless, doppler-derived calculation of AVA using the continuity equation (CE) can be difficult, due to poor echocardiographic conditions such as a limited acoustic window, heavy calcifications of the aortic valve or flow acceleration in the LVOT due to a septal bulge, a common finding in AS. When these factors question a proper orifice area quantification, we have to rely on alternative methods including transesophageal planimetry of the AVA, replacing the Doppler-derived stroke volume (SV) in the CE by SV measured Swan-Ganz Catheter or invasive quantification by cardiac catheterization and applying the Gorlin formula3. However, the invasive nature and the increased stroke risk4 with retrograde catheterisation of the aortic valve (AV) limits its clinical use. Hence, there is still a need for an alternative approach to the standard CE and invasive procedures in selected patients. Cardiovascular magnetic resonance imaging (MRI) is an important non-invasive tool for the diagnosis and treatment evaluations of patients with cardiovascular disease. Measurements of both blood flow and flow volume qualify MRI as an ideal technique for the evaluation of cardiac function and volumes. Therefore, the purpose of our study was to compare AVA measurements by standard TTE, cardiac magnetic resonance imaging (MRI) and a hybrid approach combining both techniques.
Introduction
Therapeutic decisions in aortic stenosis (AS) are based on disease-specific symptoms and on hemodynamic severity, measured by using the aortic valve area (AVA). Thus, an accurate evaluation of these two issues is mandatory. Transthoracic echocardiogram (TTE) with Doppler interrogation of the aortic valve serves as the mainstay of diagnosis1,2. The parameters referred to in current guidelines1 for grading the severity of AS are the
AVA ≤ 1cm2, mean pressure gradient ≥ 40mmHg (Pmean)
and peak flow velocity ≥ 400cm/s (Vmax). In patients
Methods
Patients
A cohort of 38 consecutive patients referred to the Department of Cardiology with a diagnosis of moderate to severe AS was recruited into the study. The study protocol was approved by the regional ethics committee. Exclusion criteria were concomitant mitral valve disease, severe low gradient AS, EF < 35%, hypertrophic obstructive cardiomyopathy, uncontrolled hypertension, severe arrhythmias, and general exclusion criteria for MRI.
Transthoracic Echocardiography
All patients underwent transthoracic echocardiography
using standard 2-D, CW-, PW-and colour Doppler techniques
(Vingmed Vivid 7, General Electric, Milwaukee, Wisconsin). LV EF was quantified according to the Simpson method. LV dimensions and left ventricular muscle mass (LVM) were measured in the parasternal long axis view according to the American Society of Echocardiography guidelines2 and indexed for body surface area (BSA). Doppler assessment
of AS included measurement of Pmean, Pmax and
Vmax. AVA was calculated by means of the CE (AVA = ([LVOTdiameter/2])
2*π*[LVOT-VTI/transaortic-VTI) and indexed for body surface area. The pressure recovery adjusted aortic valve area (i.e. energy loss index (ELI)) was calculated by a previously validated formula5. Severe AS was defined as AVA < 1 cm2 with a Pmean ≥ 40mmHg. Tissue Doppler velocity imaging and 2D strain analysis were performed as previously described6.
Magnetic resonance imaging
A 1.5-T Achieva MRI scanner (Philips Medical Systems,
Netherlands) equipped with a 5-element cardiac synergy coil was used. Cine-Images were acquired in breath hold
SSFP sequences (TE 3.43, TR 1.72). Images were evaluated
with the cmr42 research edition toolkit (circle cardiovascular imaging, Calgary, Canada) combining long and short axis views. Non-myocardial structures and papillary muscles were carefully excluded and endocardial as well as epicardial borders were outlined manually. Endsystolic and enddiastolic volumes were calculated by the program software. AVA planimetry was performed in the cardiac phase where the maximal opening area of the leaflets was observed. A three-chamber view and LVOT view were performed with cine imaging using fast-field echo sequence. The planimetric area of the LVOT cross sectional area (LVOTCSA) was measured mid-systolic. Additionally, the diameter of the LVOT was measured in the three-chamber view (as normally done with TTE), and the LVOT area was calculated according to LVOTCSA = (LVOTdiameter /2)2*π. MRI velocity measurements in phase contrast technique of the aortic valve and the LVOT were performed as described before7.
Hybrid approach
Method 1: The LVOTCSA value determined by 2D echocardiography in the CE numerator was replaced by the
MRI planimetry of LVOT and calculated AVA = (LVOTCSA
MRI*LVOT-VTI Echo)/transaortic-VTI Echo.
Method 2: The CE numerator (stroke volume, SV) was determined by MRI and the denominator (velocity time integral through the aortic valve) was measured by
echocardiography. We calculated AVA = SV MRI/
transaortic-VTI (echocardiography).
Statistics
All analyses were performed using SPSS statistical software (SPSS 17.0, Chicago, IL). The data are presented as mean ± SD
unless otherwise specified. A p value < 0.05 was considered statistically significant and adjusted for multiple comparisons using Bonferroni adjustment. Comparison between two or more groups was assessed by one-way analysis of variance (ANOVA) or t- Test when appropriate.
When normality and/or equal variance testing conditions were not met, the Kruskal-Wallis rank test was used. Pearson’s
linear correlation coefficients were calculated for continuous variables. Stepwise multiple variable regression models including variable most predictive for the dependent variables were built.
Results
Study Population
A total number of 38 patients with moderate to severe AS
(16 women, 22 men, mean age 73±9 years) were included in
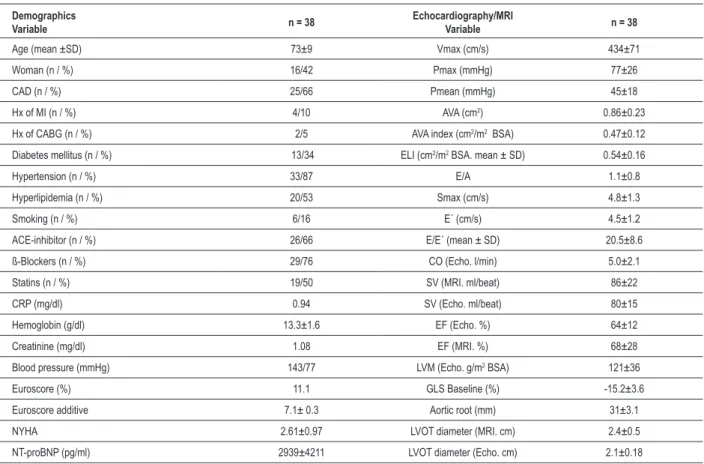
the study. Baseline demographics, clinical characteristics and key echocardiographic and MRI measurements are highlighted in table 1a. Concomitant coronary artery disease (CAD) was present in 66% of patients.
Echocardiography
According to the AVA, 26 (68%) patients were classified as having severe aortic stenosis (AVAindex < 1.0 cm2) and 12 individuals (32%) were classified as moderate AS, respectively. The AVA ranged 0.43-1.35 cm2 (mean 0.86±0.23 cm2, mean
AVAindex 0.47±0.12cm2/m2, table 1b). The mean pressure
gradient was 45±18mmHg, and Vmax was 434±71cm/s. Mean left ventricular ejection fraction (EF) was 64±12%. The
LVOTCSA ranged from 3.1-4.9cm2 (mean 3.62±0.62cm2) and
the LVOT diameter from 2.0-2.5cm (mean 2.14±0.1818cm2).
The mean stroke volume (SV) was 80±15ml/beat, respectively.
Magnetic resonance imaging
All examinations were diagnostic and well-tolerated by the patients. No complications occurred during any of the investigations. MRI allowed the planimetry of the AVA and LVOTCSA as well as measuring the diameter of LVOT in 35
individuals. Mean heart rate was 65±14 beats/min. Mean AVA measured by planimetry was 0.82±0.3cm2 (AVAindex
0.46±0.16cm/m2), while the planimetry of the LVOT CSA ranged from 3.0-7.5cm2 (mean 5.01±1.08 cm2). Mean LVOT diameter measured in the three-chamber view was
diameter was 4.45±1.63cm2, respectively. Mean SV was
86±22ml/beat.
Table 2 shows a comparison between echocardiographic and MRI measurement. The LVOTCSA calculated from the LVOT diameter with MRI techniques was significantly different compared to the standard echocardiographic d e t e r m i n a t i o n o f t h e LV OTC S A ( m e a n d i f f e r e n c e
0.94cm2±1.54cm2, CI 0.43-1.45, p=0,001). Likewise, the results from LVOT diameter measurement with MRI or TTE techniques were significantly different (mean difference
0.22±0.45cm, CI 0.07-0.37, p=0.04). In addition, the
planimetry of the LVOTCSA using MRI reveals significantly larger LVOTCSA in comparison to TTE determination (mean
difference 1.39±0.88cm2, CI 1.09-1.67, p<0.001). Stroke volume measurements based on MRI and TTE showed a moderate correlation (r=0.56, p<0.001, mean difference
6.8±18.6ml/b, CI 0.7-12.9, p = 0.03).
Comparing the hybrid approach with standard continuity equation
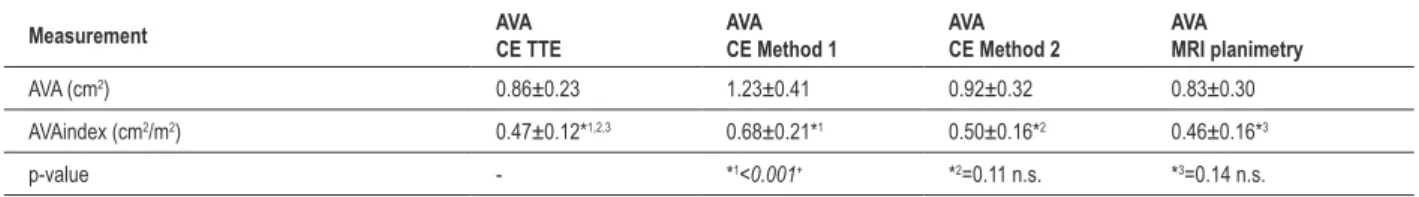
Results for calculation of AVA are summarized in Table 3. There was no statistically significant difference for mean Table 1 - a) Demographics and clinical data b) Echocardiographic and MRI measurements in individuals with aortic valve stenosis summarized
Demographics
Variable n = 38
Echocardiography/MRI
Variable n = 38
Age (mean ±SD) 73±9 Vmax (cm/s) 434±71
Woman (n / %) 16/42 Pmax (mmHg) 77±26
CAD (n / %) 25/66 Pmean (mmHg) 45±18
Hx of MI (n / %) 4/10 AVA (cm2) 0.86±0.23
Hx of CABG (n / %) 2/5 AVA index (cm2/m2 BSA) 0.47±0.12
Diabetes mellitus (n / %) 13/34 ELI (cm2/m2 BSA. mean ± SD) 0.54±0.16
Hypertension (n / %) 33/87 E/A 1.1±0.8
Hyperlipidemia (n / %) 20/53 Smax (cm/s) 4.8±1.3
Smoking (n / %) 6/16 E´ (cm/s) 4.5±1.2
ACE-inhibitor (n / %) 26/66 E/E´ (mean ± SD) 20.5±8.6
ß-Blockers (n / %) 29/76 CO (Echo. l/min) 5.0±2.1
Statins (n / %) 19/50 SV (MRI. ml/beat) 86±22
CRP (mg/dl) 0.94 SV (Echo. ml/beat) 80±15
Hemoglobin (g/dl) 13.3±1.6 EF (Echo. %) 64±12
Creatinine (mg/dl) 1.08 EF (MRI. %) 68±28
Blood pressure (mmHg) 143/77 LVM (Echo. g/m2 BSA) 121±36
Euroscore (%) 11.1 GLS Baseline (%) -15.2±3.6
Euroscore additive 7.1± 0.3 Aortic root (mm) 31±3.1
NYHA 2.61±0.97 LVOT diameter (MRI. cm) 2.4±0.5
NT-proBNP (pg/ml) 2939±4211 LVOT diameter (Echo. cm) 2.1±0.18
CAD - coronary artery disease; Hx - history of; LVM - left ventricular muscle mass index; MI - myocardial infarction; SD - standard deviation; AVA - aortic valve area; AVR - aortic valve replacement; BSA - body surface area; CO - cardiac output; ELI - energy loss index; EF - ejection fraction; GLS - global longitudinal strain; LVOT - left ventricular outlow tract; LVM - left ventricular mass index; MRI - magnetic resonance imaging; Smax - peak systolic tissue doppler velocity at the septal mitral annulus; SV - stroke volume; Continues variables are presented as mean ± SD.
Table 2 - Comparison of LVOT measurement with TTE and MRI
Measurement diameter (cm)LVOT LVOTCSA
calculated (cm2)
LVOTCSA
Planimetry (cm2)
TTE (mean ± SD. cm) 2.14 ± 0.18* 3.62 ± 0.62#.+
-MRI (mean ± SD. cm2) 2.36 ± 0.47* 4.45 ± 1.63# 5.01 ± 1.08+
p-value *0.004 #0.001 +<0.001
indexed AVA between standard CE and hybrid method 2
(mean difference 0.03±0.11cm2/m2, CI = -0.007-0.069, p = 0.11) and between standard CE and MRI planimetry
of the AVA (mean difference 0.04±0.15cm2/m2, CI -0.09-0.012, p = 0.14). On the contrary, AVA measurements by hybrid approach 1 and standard CE revealed a significant
difference (mean difference 0.21±0.14cm2/m2, CI -0.17-0.25, p < 0.001, Fig. 1). Correlation between standard CE and the hybrid techniques were significant (indexed AVA) for the hybrid method 1, 2 and AVA planimetry (p<0,001, figure. 2a-c), respectively. Bland-Altman plots are shown in Figure 3 a-c. Table 4 illustrates the frequency of the severity of AS by the different techniques categorized into mild, moderate and severe.
The correlation between standard CE and hybrid techniques for the non-indexed AVA was also significant for the hybrid method 1, 2 and AVA planimetry (r = 0.556, r = 0.800 and r = 0.710 respectively, all p < 0.001).
Discussion
In individuals with severe aortic stenosis, a modified continuity equation combining MRI and echocardiography revealed a very good agreement compared to standard continuity equation. The comparison of both hybrid method 2 and MRI planimetry of the AVA to standard TTE by Bland Altman analysis showed a mean difference near zero, a spread within two standard deviations (SD) and very similar limits of agreement. Furthermore, the vast Table 3 - Results for calculation of AVA based on standard CE (TTE) and the hybrid approach
Measurement AVA
CE TTE
AVA CE Method 1
AVA CE Method 2
AVA MRI planimetry
AVA (cm2) 0.86±0.23 1.23±0.41 0.92±0.32 0.83±0.30
AVAindex (cm2/m2) 0.47±0.12*1,2,3 0.68±0.21*1 0.50±0.16*2 0.46±0.16*3
p-value - *1<0.001+ *2=0.11 n.s. *3=0.14 n.s.
AVA - Aortic valve area; CE - continuity equation; MRI - magnetic resonance imaging; n.s. - not signiicant; TTE - transthoracic echocardiography. + = signiicant p<0.05.
95
% C
I
AVA index standard CE AVA index hybrid 2 AVA index hybrid 1 AVAindex planimetry
majority of patients (92%) were classified as having severe
AS with standard CE, hybrid method 2 and AVA planimetry. Since the ability to identify individuals with definite severe AS may have therapeutic implications; these findings are of great importance.
Calculation of AVA by means of Doppler echocardiography is a widely used standard for evaluation of aortic valve stenosis in clinical practice. Transthoracic echocardiography (TTE) plays an important role in management decisions including indications for surgery and scheduling follow-ups in individuals with AS. TTE is non invasive, easily to perform, readily available and inexpensive and offers an acceptable intraobserver and interobserver reproducibility. Therefore, a full hemodynamic study with retrograde catheterisation of the AV is no longer recommended if non invasive assessment of the severity of AS is adequate to assess valve hemodynamics.
Echocardiographic valve area calculation is based on the CE, which assumes that the flow (F) on both sides of the aortic valve orifice is equal3. Flow is defined as cross sectional area (CSA) multiplied by flow velocity (V). Across
the aortic valve (AV), the flow is equal to stroke volume (SV). Because SV is the product of the CSA and time velocity integral (VTI), the CE can be arranged to yield: AVA = (LVOTVTI x LVOTCSA)/AVVTI), in which LVOTVTI is the velocity time integral at the level of the stenotic valve and CSA is the cross sectional area of the LVOT.
In most echocardiographic studies, reproducibility of LVOT measurement is sufficient. Nevertheless, significant variability can occur8. Potential factors that may contribute to measurement errors include image quality, annular calcifications, a noncircular annulus and general failure in measuring the actual area. LVOT diameter measurement is squared; therefore any significant LVOT diameter measurement error will also be squared, producing a potentially unacceptable error in the AVA calculation. Accordingly, accurate measurement of the
LVOT is critical. Previous studies have shown that the mean
interobserver und intraobserver measurement variability is 5% to 8%, resulting in a variability of calculated valve area of about 0.15cm2 for a borderline AS with an AVA of 1cm2. Furthermore, flow acceleration in the LVOT may lead to overestimation of the Doppler-derived SV and therefore misrepresentation of
A
V
A
m
ethod 1 (c
m
2/m 2)
AVA Echocardiography (cm2/m2) AVA Echocardiography (cm2/m2)
Figure 2 - Correlation of standard AVA index measurement and hybrid approach 1(a), 2(b) and MRI planimetry (c)
Figure 2a - Linear regression analysis demonstrates a signiicant correlation between AVA-index (cm2/m2 BSA) derived by standard CE (TTE) and hybrid method 1.
Figure 2b - Linear regression analysis demonstrates a signiicant correlation between AVA-index (cm2/m2 BSA) derived by standard CE (TTE) and hybrid method 2.
Figure 2c - Linear regression analysis demonstrates a signiicant correlation between AVA-index (cm2/m2 BSA) derived by standard CE (TTE) and MRI planimetry. AVA - Aortic valve area; BSA - Body surface area; CE - continuity equation; TTE - transthoracic echocardiography.
r2 = 0,67
r = 0,81 p < 0,001
r2 = 0,43
r = 0,65 p < 0,001
r2 = 0,667
r = 0,719 p < 0,001
Fig. 2a
Fig. 2b
Fig. 2c
A
V
A
hy
bri
d m
ethod 2 (c
m
2/m 2)
A
V
A
P
lani
m
etry
(c
m
2/m 2)
the AVA. Hence, assessing the severity of AS is not always straightly apparent.
W h e n e c h o c a r d i o g r a p h i c m e a s u r e m e n t s a r e inconsistent, invasive hemodynamic remain the gold standard. However, aortic atheroma is a common
finding in individuals with AS and is a potential source of ischaemic stroke, especially during cardiac catheterisation or surgery4. Therefore, a non-invasive alternative particularly in patients at high risk of procedure-associated complications is needed.
Table 4 - Frequency of the severity of AS by 4 different imaging techniques
Classiication TTE Hybrid Method 1 Hybrid Method 2 AVA
MRI planimetry
Mild (> 1.5cm2) - 26% 3%
-moderate (1.0-1.5cm2) 34% 40% 34% 32%
Severe (< 1.0cm2) 66% 34% 63% 68%
Values are presented as percent. Aortic stenosis is categorized as mild, moderate and severe based on aortic valve area (cm2); AVA - Aortic valve area; TTE - transthoracic echocardiography; MRI - magnetic resonance imaging.
H
ybri
d 1 –
TTE
AVA index (hybrid 1 – TTE)/2 AVA index (hybrid 2 – TTE)/2
P
lani
m
etry
–
TTE
AVA index (planimetry – TTE)/2
Figure 3 - Bland-Altman analyses illustrating the agreement between standard AVA-assessment and hybrid-approach 1(a), 2(b) and MRI planimetry(c).
Figure 3a - Agreement between AVA measured by standard CE (TTE) indexed for BSA (cm2/m2) and hybrid method 1. The continuous line represents the mean difference, and the dashed lines represent limits of agreement.
Figure 3b - Agreement between AVA measured by standard CE (TTE) indexed for BSA (cm2/m2) and hybrid method 2. The continueous line represents the mean difference, and the dashed lines represent limits of agreement.
Figure 3c - Agreement between AVA measured by standard CE (TTE) indexed for BSA (cm2/m2) and MRI planimetry of the AVE. The continuous line represents the mean difference, and the dashed lines represent limits of agreement.
AVA - Aortic valve area; BSA - Body surface area; CE - continuity equation; TTE - transthoracic echocardiography.
Fig. 3a
Fig. 3b
Fig. 3c
H
ybri
d 2 –
Our results demonstrate that the standard CE can be modified when necessary: the modification is simple and merely consists of replacing the Doppler-derived stroke volume by a MRI determination of stroke volume (hybrid method 2).
Previous studies have demonstrated MRI as a very useful tool for
evaluation of ventricular flow as it is independent of geometric assumptions, as well as accurate and reproducible9. On the
contrary, the echocardiographic simplified Bernoulli equation ignores the flow acceleration proximal to the stenosis, which is an acceptable assumption as long as the transvalvular flow velocity is significantly greater than the proximal flow velocity. However, in the presence of accelerated flow or less significant stenosis, the simplified Bernoulli equation is less accurate.
Flow acceleration in the LVOT can affect AVA calculation by overestimating the actual AVA10. By contrast, SV calculation by MRI is not affected by flow acceleration in the LVOT. Therefore, replacing the SV in the CE by MRI derived SV measurement may be more accurate in situations where significant flow acceleration is present in the LVOT. On the other hand, Doppler-derived gradients correlate well with invasively measured pressure gradients as it has been demonstrated in the experimental and in the clinical setting11,12. Therefore, combining measurements of SV by MRI with measurements of VTI across the aortic valve by echocardiography in hybrid approach 2 takes advantages of both methods. It yields results with very small differences compared to standard CE and accurately identifies the vast majority of severe AS. Using a hybrid approach bypasses the need for accurate measurement of the LVOT diameter and LVOT flow and therefore may be an acceptable alternative when measuring the LVOT is not possible.
Furthermore, planimetric-derived AVA by MRI is accurate and correlates well with the one obtained by echocardiography. These findings are congruent with the literature published concerning this matter13. Although attractive, direct planimetry of the AVA by MRI is nonetheless a technically demanding method. It requires precise measurement at the valve tips during their maximal opening. This can be challenging as there may be heavy calcifications of the tips leading to image artefacts, and a precise view of the aortic valve leaflets, since partial volume effects may be difficult. In addition, MRI planimetry represents a single time point measurement of AVA at maximal systole, while CE is measured as average over the whole ejection period. The AVA, however, may vary substantially during the ejection period14.
In contrast to planimetry and hybrid method 2, hybrid method 1 failed to demonstrate a good agreement compared to standard CE. The MRI images in our study reveal that the LVOT geometry resembles a more elliptical rather than a circular shape and therefore a larger LVOTCSA was determined. Replacing the LVOTCSA measurement in the standard CE with MRI planimetry of the LVOT, it remains doubtful whether the standard CE permits an accurate calculation of the AVA, because standard CE assumes a circular shape of the LVOTCSA. Accordingly, whether LVOT is obtained with echocardiography or MRI, these two approaches cannot be used interchangeably.
In general, despite the fact that MRI overcomes some of the methodological limitations of echocardiography mentioned above, it seems unlikely for MRI to replace TTE as the image modality of first choice in evaluating individuals
with aortic stenosis. However, our data are consistent with previously published studies, suggesting that a hybrid approach combining TTE and MRI as a promising alternative diagnostic tool for evaluating the severity of AS noninvasively when echocardiography is inconclusive.
Limitations
The cohort of 38 individuals included in this pilot study is relatively small and does not allow performing a subgroup analysis. Therefore, we must remain cautious in the interpretation of these data considering the relatively small number of patients. However, these preliminary results encouraged us to investigate this issue in a larger study group.
Furthermore, only a small proportion of patients had invasive measurement of AVA by cardiac catheterization. Therefore, the results comparing standard CE and the hybrid approach should be analysed with caution because the “gold standard” in determining the severity of AS is not available, therefore new methods should be judged. Nevertheless, invasive measurement of AS is based on the “Gorlin formula” which has many well-recognized limitations15, whereas the continuity equation method for calculation of AVA has the advantage of being non-invasive and of not containing an empirical constant16.
Another limitation of our study was a well preserved EF in
most patients included in the study (64 ± 12%). However,
especially in patients with severely impaired EF (low flow, low gradient aortic stenosis), the accurate assessment of AVA using Doppler TTE is challenged by the limitations of Doppler flow parameters17.
Conclusions
The calculation of AVA by a non-invasive hybrid approach between echocardiography and MRI is a good alternative to standard CE and correlates well with the standard method. The hybrid approach is more time consuming, not widely available and more cost intensive than standard CE and will certainly not replace TTE in clinical routine. However, this method could be used as a non-invasive alternative in patients in whom echocardiographic results are inconclusive or in whom conflicting results require further clarifications, particularly in patients with a high risk for an invasive hemodynamic study.
Potential Conflict of Interest
No potential conflict of interest relevant to this article was reported.
Sources of Funding
There were no external funding sources for this study.
Study Association
References
1. Bonow RO, Carabello BA, Chatterjee K, de Leon AC Jr, Faxon DP, Freed MD, et al. 2008 Focused update incorporated into the ACC/AHA 2006 guidelines for the management of patients with valvular heart disease: a report of the American College of Cardiology/American Heart Association Task Force on Practice Guidelines (Writing Committee to Revise the 1998 Guidelines for the Management of Patients With Valvular Heart Disease): endorsed by the Society of Cardiovascular Anesthesiologists, Society for Cardiovascular Angiography and Interventions, and Society of Thoracic Surgeons. Circulation. 2008;118(15):e523-661.
2. Lang RM, Bierig M, Devereux RB, Flachskampf FA, Foster E, Pellikka PA, et al. Recommendations for chamber quantification: a report from the American Society of Echocardiography’s Guidelines and Standards Committee and the Chamber Quantification Writing Group, developed in conjunction with the European Association of Echocardiography, a branch of the European Society of Cardiology. J Am Soc Echocardiogr. 2005;18(12):1440-63.
3. Taylor R. Evolution of the continuity equation in the Doppler echocardiographic assessment of the severity of valvular aortic stenosis. J Am Soc Echocardiogr. 1990;3(4):326-30.
4. Omran H, Schmidt H, Hackenbroch M, Illien S, Bernhardt P, von der Recke G, et al. Silent and apparent cerebral embolism after retrograde catheterisation of the aortic valve in valvular stenosis: a prospective, randomised study. Lancet. 2003;361(9365):1241-6.
5. Garcia D, Pibarot P, Dumesnil JG, Sakr F, Durand LG. Assessment of aortic valve stenosis severity: a new index based on the energy loss concept. Circulation. 2000;101(7):765-71.
6. Bottini PB, Carr AA, Prisant LM, Flickinger FW, Allison JD, Gottdiener JS. Magnetic resonance imaging compared to echocardiography to assess left ventricular mass in the hypertensive patient. Am J Hypertens. 1995;8(3):221-8.
7. Caruthers SD, Lin SJ, Brown P, Watkins MP, Williams TA, Lehr KA, et al. Practical value of cardiac magnetic resonance imaging for clinical quantification of aortic valve stenosis: comparison with echocardiography. Circulation. 2003;108(18):2236-43.
8. Myreng Y, Molstad P, Endresen K, Ihlen H. Reproducibility of echocardiographic estimates of the area of stenosed aortic valves using the continuity equation. Int J Cardiol. 1990;26(3):349-54.
9. Pennell DJ. Ventricular volume and mass by CMR. J Cardiovasc Magn Reson. 2002;4(4):507-13.
10. Zhou YQ, Faerestrand S, Birkeland S, Matre K, Koller ME, Husby P. The velocity distribution in the aortic annulus at different times during systole is mainly determined by the pattern of flow convergence in the left ventricular outflow tract--an experimental study using Doppler colour flow mapping. Clin Physiol. 1995;15(6):597-610.
11. Callahan MJ, Tajik AJ, Su-Fan Q, Bove AA. Validation of instantaneous pressure gradients measured by continuous-wave Doppler in experimentally induced aortic stenosis. Am J Cardiol. 1985;56(15):989-93.
12. Currie PJ, Seward JB, Reeder GS, Vlietstra RE, Bresnahan DR, Bresnahan JF, et al. Continuous-wave Doppler echocardiographic assessment of severity of calcific aortic stenosis: a simultaneous Doppler-catheter correlative study in 100 adult patients. Circulation. 1985;71(6):1162-9.
13. John AS, Dill T, Brandt RR, Rau M, Ricken W, Bachmann G, et al. Magnetic resonance to assess the aortic valve area in aortic stenosis: how does it compare to current diagnostic standards? J Am Coll Cardiol. 2003;42(3):519-26.
14. Arsenault M, Masani N, Magni G, Yao J, Deras L, Pandian N. Variation of anatomic valve area during ejection in patients with valvular aortic stenosis evaluated by two-dimensional echocardiographic planimetry: comparison with traditional Doppler data. J Am Coll Cardiol. 1998;32(7):1931-7.
15. Segal J, Lerner DJ, Miller DC, Mitchell RS, Alderman EA, Popp RL. When should Doppler-determined valve area be better than the Gorlin formula?: variation in hydraulic constants in low flow states. J Am Coll Cardiol. 1987;9(6):1294-305.
16. Grayburn PA, Smith MD, Harrison MR, Gurley JC, DeMaria AN. Pivotal role of aortic valve area calculation by the continuity equation for Doppler assessment of aortic stenosis in patients with combined aortic stenosis and regurgitation. Am J Cardiol. 1988;61(4):376-81.