Nuno Barraca
a,⁎
, Miguel Almeida
b, Humberto Varum
c, Fernando Almeida
d, Manuel Senos Matias
da
Morph, Lda., Coimbra, Portugal
bDryas Arqueologia, Lda., Coimbra, Portugal c
CONSTRUCT-LESE, Faculty of Engineering, University of Oporto, Portugal
d
GeoBioTec, Department of Geosciences, University of Aveiro, Portugal
a b s t r a c t
a r t i c l e i n f o
Article history: Received 14 May 2015
Received in revised form 6 November 2015 Accepted 10 February 2016
Available online 11 February 2016
Ancient buildings in historical town centers can be protected by Cultural Heritage legislation, thus implying that any rehabilitation must respect their main architectural features. These concerns also apply to Modern and Con-temporary buildings, in particular if they are important examples of architectural styles from those periods. These extra problems, or motivations, add to the inherent structural delicacy of ancient building restoration that requires detailed knowledge of the building foundations, characteristics and materials, modification history, in-frastructure mapping, current pathologies, etc., all relevant information for an informed rehabilitation project. Such knowledge is seldom available before the actual rehabilitation works begin, and the usual invasive prelim-inary surveys are frequently expensive, time-consuming and likely significantly alter/damage the building's main features or structural integrity. Hence, the current demand for indirect, non-invasive, reliable and high resolution imagery techniques able to produce relevant information at the early stages of a rehabilitation project. The present work demonstrates that Ground Penetrating Radar (GPR or Georadar) surveys can provide a priori knowledge on the structure, construction techniques, materials, history and pathologies in a classified Modern Age building. It is also shown that the use of GPR on these projects requires carefully designed surveys, taking into account the known information, spatial constraints, environmental noise, nature and dimensions of the ex-pected targets and suitable data processing sequences.
Thus, if properly applied, GPR produces high-resolution results crucial for sound engineering/architectural inter-ventions aiming to restore and renovate Modern and Contemporary buildings, with (1) focus on the overall qual-ity of the end-result, (2) no damage inflicted to the existing structure, (3) respect of the building's historical coherence and architectural elements and characteristics, that is, its Cultural Heritage value.
Most of thefindings and applications discussed in this work can be seen as an approximation to model studies, so that, relevant information can be drawn from the different investigated situations. Therefore, owing to the nature and the range of the problems encountered in this case study, it is also expected that the presented GPR data and interpretation will provide important clues and guidance in the planning and investigation of similar projects and problems.
© 2016 Elsevier B.V. All rights reserved.
Keywords: GPR Building characterization Restoration High resolution Pathologies Construction materials 1. Introduction
Nowadays the use of Geophysics in Civil Engineering is a well-established practice. In particular, the application of Geophysical methods to geological mapping, underground characterization for building foundations, construction material characterization and integ-rity of structures has already been developed (Nazarian et al., 2007;
Coutinho and Mayne, 2012).
Recently there is an increasing interest in the restoration, renovation and rehabilitation of ancient buildings and monuments, relevant for
Cultural Heritage, which are often protected as local, national or world heritage. In these cases, building rehabilitation must conform to strict regulations aiming to preserve their features. This interest is now being extended to Modern and Contemporary buildings, landmarks of important architectural styles from those periods.
Rehabilitation projects are an increasing activity in urban renewal and can pose new problems and challenges to engineers and architects, demanding as much information as possible on the buildings about to be intervened. This includes detailed knowledge of construction tech-niques, phases and modifications, materials, infrastructures, patholo-gies, foundations and nature of the underlying ground, among other problems. However, this information is seldom available at the begin-ning of the project, as records are frequently missing or very difficult
⁎ Corresponding author.
E-mail address:nuno.barraca@morph.pt(N. Barraca).
http://dx.doi.org/10.1016/j.jappgeo.2016.02.002 0926-9851/© 2016 Elsevier B.V. All rights reserved.
Microgeophysics (Cosentino et al., 2011). Microgeophysics uses geo-physical techniques modified and adapted to diagnose, monitor and provide information relevant for the solution of problems concerning Cultural Heritage studies, such as, characterization of construction ma-terials, identification of pathologies, infrastructure location, continuity and type of construction elements, etc., in monuments, historical build-ings and artworks.
The most popular Geophysical methods to investigate historical buildings and monuments (sculptures, stone engravings and panels, artworks in general, etc.) consist on 2D and 3D seismic tomography, GPR, electrical resistivity tomography, ultrasonic waves and infrared emission (Cosentino et al., 2011). Other methods have also been intro-duced, such as, microgravimetry (Panisova et al., 2013), seismic ambi-ent noise (Castellaro et al., 2008) and nuclear magnetic resonance (Capitani et al., 2012).
The investigation of those problems often requires a multimethod approach as different techniques provide complementary information. Furthermore, their use must be considered in accordance with the aims of the study and integrated studies are preferred (Cataldo et al., 2005;Faella et al., 2012;Martinho and Dionisio, 2014).
Hence fracture detection has been investigated using GPR (Leucci et al., 2007), cracks and joint geometry by GPR and microwave tomogra-phy (Bavusi et al., 2010); 2D resistivity was proposed to investigate mois-ture in masonry walls (Sass and Villes, 2006 and 2010); masonry studies used GPR and sonic tests (Anzani et al., 2006); electrical resistivity tomog-raphy (ERT) was applied in the investigation of vulnerable hidden sur-faces, such as mosaics (Fiandaca et al., 2009 and 2010), 3D resistivity for foundation studies under buildings (Chavez et al., 2015) and combined surveys using ERT and GPR were also proposed to investigate different construction phases, roman and medieval (Grangeia et al., 2011).
Most examples of the use of Geophysics in Cultural Heritage refer to ancient monuments and artworks but, herein, it is proposed to investi-gate a 20th century building representative of the Art Deco style. This building, protected by the town council, has suffered many internal al-terations during its lifetime, leading to adaptations and modifications that have not been recorded. These adaptations were done with differ-ent materials and techniques, structural elemdiffer-ents and nowadays some pathologies, such as cracks and moisture, are clearly identified by simple visual inspection.
Bearing in mind logistics, available space, the nature of the walls and floors it was decided to use GPR to investigate those problems. In fact GPR is a nondestructive and cost effective method with an impressive record of applications and success in Civil Engineering, in general, and in building assessment in particular (Benedetto and Pajewski, 2015). There are several examples in the literature of the use of GPR in the as-sessment and analysis of buildings (Pérez-Gracia and Solla, 2015). Thus,
Binda et al. (2000)tested the use of GPR in the investigation of masonry building damage and defects, rebar detection and reinforcement were addressed byBarrili and Pucinotti (2005) and Pérez-Gracia et al. (2008). An experimental work of fracture detection on a wall, later ce-ment injection on the fractures and masonry characterization is de-scribed inHermozilha et al. (2009).
In the present case, other methods, such as resistivity, were tested but not considered because of the nature of the walls (covered with
terpretation can be replicated in similar projects.
At last, the ongoing renovation of the building is taking into account the results herein discussed, confirmed the findings and further similar projects are already considered for other buildings of architectural value.
2. The“InovaDomus house” case study (Ílhavo, Portugal)
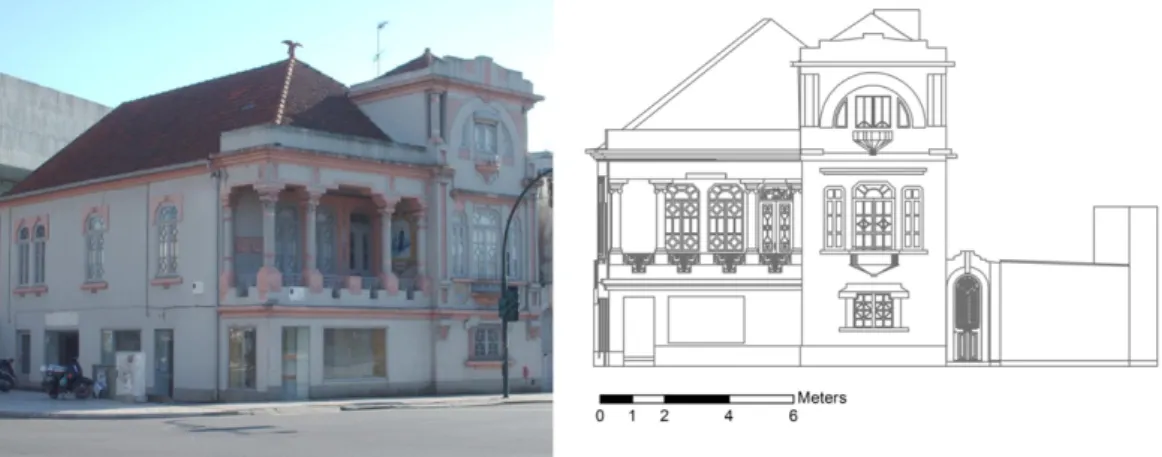
Herein are presented and discussed the results of a GPR survey planned and executed as part of the project for the rehabilitation of an early 20th century Art Deco house protected by its Cultural Heritage rel-evance (Fig. 1;Barraca et al., 2014).
The building currently demands maintenance and restoration works but its Cultural Heritage value implies that any engineering or architec-tural intervention must respect its characteristics and integrity. Howev-er, the restoration team had scarce information, as records and documents about the house do not exist. In order to overcome this lack of information, a GPR survey was planned in accordance with all the available engineering and architectural knowledge, aiming to inves-tigate the general structure of the building.
The history of this building suggests that there is a wide variety of problems to be encountered. These problems range from foundation and local geology investigations, modifications and continuity of con-struction elements, different concon-struction materials and phases, pathol-ogies (fractures, moisture) to infrastructure location. Hence it is a unique opportunity to study a whole range of problems, test techniques and propose interpretations in a real situation.
A previous experimental model and controlled project,Hermozilha et al. (2009)tested the use of GPR in the location of individual bricks, fractures and cement injection to repair fractures on a damaged wall and provided the necessary guidance to carry out the present work. Therefore the survey main goals included:
• To investigate the local geological conditions, that is, layering, water table, anthropic layers and any other information relevant for the characterization of the building's foundations and structure. • To map all existent infrastructures, such as, power cables, plumbing,
etc., as the original electrical and water networks might have suffered considerable modifications during the building complex history. • To locate any traces of removed, altered walls or other original
con-struction elements, as throughout the building lifetime, modifications included removal and opening of several walls, doors, windows and stairs modifications. A detailed knowledge of these alterations will in-fluence the evaluation of the building structural stability and on the overall quality of the rehabilitation.
• To locate modifications and changes in the construction materials (original building materials were adobe, masonry), rebar structure whilst later modifications included bricks and different structure rebar.
• To investigate pathologies and fracturing. During the building lifetime a complex system of fracturing occurred and several fractures and reparation attempts are visible. It was particularly important to locate fracturing in association with wall removal and internal changes of
the building. One of the objectives of this work is to investigate if GPR could be used to detect open fractures and repaired ones.
To explore whether thefindings of this case study can be used in a more general way, as this situation is a very good approximation to de-tailed model work, and to project further dede-tailed and dedicated analog controlled work.
3. Data collection and processing
A GPR equipment with constant separation shielded antennas was used, acquiring data with three different central frequencies antennas (500 MHz, 800 MHz, and 1.6 GHz):
• The 500 MHz antenna was used in ground surveys outside the build-ing to investigate the underlybuild-ing geology and any previous anthropic interventions. This antenna was chosen given its acquisition depth to resolution compromise and the objectives of the survey as some pre-liminary tests indicated;
• The 800 MHz antenna was used on the ground floor, inside the build-ing, to identify and map infrastructures and removed constructive el-ements. This choice was justified by previous tests, portability and maneuverability in indoor use, good resolution at shallow depths, as the predicted anomalies were expected for maximum depths up to 1.5 m;
• The 1.6 GHz antenna was used on the walls to locate electrical and water networks, to investigate construction materials, current pathol-ogies (moisture and fractures) and alterations to the initial layout of the building. Tests with different antennas favored the use this anten-na. Furthermore, the maximum thickness of the inspected wall/floors was less than 0.5 m and maximum resolution at this depth is demanded. In addition, the dimensions of other antennas made them impracticable for the envisaged purposes.
Owing to the nature, dimensions and characteristics of the targets to be surveyed there is a demand for accurate location of measurements, if correct and precise information is given to engineers and architects. Thus, precise location of measurements was achieved using a topo-graphic total station in conjunction with the GPR system self-odometer and plain measuring tapes. These data enable an accurate an-tenna location later added to a CAD model of the building derived from a laser scanning survey (Figs. 1and5). A comprehensive dataset was thus acquired with all the three antennas, that is:
Data from the 500 MHz antenna were obtained with parallel lines spaced 0.2 m, 0.04 m trace increment and a time window of 80 ns for a total of 24 profiles in 2 acquisition areas. This survey was not intended to provide a 3D block of the area. Thus it consisted on a set of parallel
GPR profiles to investigate local geology and hydrogeology. Herein only one profile representative of the whole set will be discussed.
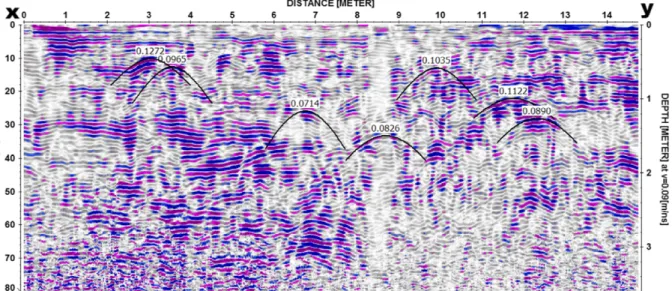
The 800 MHz and 1.6 GHz surveys were preceded by some prelimi-nary tests to estimate velocities and dielectric constants. Velocity esti-mates range from 0.09 m/ns to 0.14 m/ns (Figs. 2 and 3). The highest values correspond to measurements over concrete slabs and corre-sponding hyperbola adjustment is shown inFig 3. Estimates for dielec-tric constants vary from 4.6 to 11.1. The distance between profiles to construct the 3D images discussed in this work considers these values and also takes into account that the distance between profiles must be less than the maximum horizontal resolution at the largest depth (Benedetto and Pajewski, 2015;Annan and Cosway, 1991).
The 800 MHz data were acquired with 0.1 m spacing between lines, 0.02 m trace increment and a time window of 40 ns for a total of 737 profiles in 9 acquisition areas.
Finally, the 1.6 GHz antenna was intended to provide the denser and highest resolution data. Therefore, parallel acquisition lines on the walls had a separation of 0.05 m (single direction), trace increment of 0.004 m, time window 10 ns. When acquisition was done in a grid mode, separation was 0.01 m or 0.02 m between lines, trace increment 0.004 or 0.005 m, time window 10 ns for a total of 1330 profiles in 36 acquisition areas.
Data were processed with standard commercial software (Sandmeier ReflexWin, v7.1) using a processing sequence consisting of (Jol, 2009):
• Dewow filter for DC bias removal, using time windows of 2 ns for the 500 MHz data,1.25 ns for the 800 MHz data, 0.625 ns for the 1.6 GHz data;
• Time zero adjustment for setting of the zero time position relative to the surface using a parameter derived of the visual inspection of the traces (−3 ns for the 500 MHz data, −2.5 ns for the 800 MHz data, −1.5 ns for the 1.6 GHz data);
• Band pass Butterworth filter: at first this filter was designed consider-ing a bandwidth equal to 1.5 times the value of peak frequency of each antenna, however, adjustment in the bandwidth were carried out whenever the frequency spectrum of the data suggested it;
• Median filter t-x, when undesirable noise was found;
• FK Stolt migration, using wave propagation velocity estimated by hy-perbolafitting (Figs. 2 and 3); constant velocity values were used for each area.
The parameters for each of these steps were adjusted case by case in accordance with data quality, antenna frequency and the objectives of the acquisition. The visualization of 2D data was sharpened by applying a gain factor to the processed image. However, this gain does not change data quality and characteristics.
Time slice construction was carried out using 2D data. Interpolation between profiles was done using processed information in accordance with the acquisition geometry, line spacing and trace increment. Acqui-sition velocity was constant and no blank traces were recorded during the acquisition process in thefield. Therefore, raster increment is equal to the trace increment in the 2D profiles, whilst the interpolation distance is equal to the distance between profiles. Owing to the dense acquisition network, as defined previously, there was no need for other interpolation methods such asSafont et al. (2014). The time slices are presented in envelope mode, a measure of the reflectivity strength proportional to the square root of the complete energy of the signal at an instant time. To enhance the visualization, further steps were also implemented, that is gain, trace and profile normalization. Time slices visualization used a gray scale, where the darker areas correspond to higher reflectivity zones, whereas lighter areas correspond to lower re-flectivity zones.
Special attention was applied to identify and expunge all possible undesirable reflections, noise and migration. The antenna shielding proved to be very efficient, thus allowing an effective removal of un-wanted noise following preliminary signal analysis. Migration was an important step in the data processing sequence. In fact, data from out-side of the building and from the construction areas depicted many hy-perbolae. These features could conceal relevant information, hence demanding the migration of the data to collapse the hyperbolae to a sin-gle point. This procedure required accurate velocity estimation and such estimation was achieved byfitting theoretical hyperbolae to the ones depicted in the radargrams (seeFigs. 2 and 3).
Previous works proposed to use a steel bar on the opposite face of an adobe block to obtain hyperbolic reflections, thus estimating velocities and checking the accuracy of the adobe thickness estimates from GPR results (Hermozilha et al., 2009). In the InovaDomus case survey, it was used a metallic rod on the opposite face of the surveyed walls (e.g.Fig. 4). This simple procedure enables to delimit the radargram area corresponding to events in the wall, as well as to estimate local ve-locities and wall thicknesses.
4. Interpretation and discussion of the InovaDomus GPR imagery The InovaDomus GPR survey aimed at several different objectives, each one demanding a particularfield strategy, as explained earlier. Data interpretation was based on 2D radargrams, time slices and sets of time slices to obtain the best information possible on the different questions addressed by the GPR survey. The following presentation of results and discussion will address each of these objectives individually. 4.1. Geology and hydrogeology
One of the objectives of this study was to investigate local geological conditions, that is, layering, water table, anthropic layers and any other information of relevance for the characterization of the building founda-tions and infrastructures. The building is constructed on recent sedi-ments, near an old riverside. The water table was expected to be close to the surface and the ground should have suffered considerable human intervention.
The 500 MHz antenna was used to carry out these studies outside the building in areas E1 and E2 (Fig. 5).
The GPR survey performed on the concrete pavement outside the building shows hyperbola with different velocities (Fig. 2). Hyperbola adjustment produced velocity estimations ranging from 0.0714 to
Fig. 2. Radargram acquired outside the building (500 MHz): the radargramfitted hyperbolae give velocity values ranging from 0.0714 m/ns to 0.1272 m/ns. This variation is due to the heterogeneity of the area that suffered extensive anthropic intervention.
Fig. 3. Radargram section obtained over a concrete slab in the building: the estimated velocity is 0.14 m/ns.
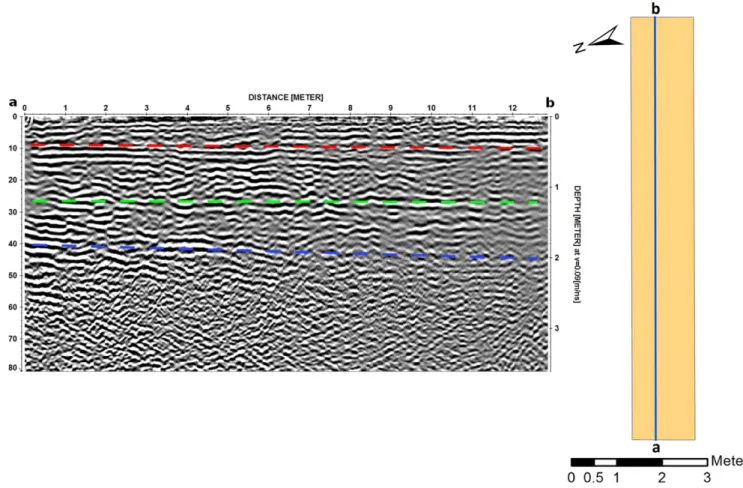
0.1272 m/ns, thus revealing the heterogeneity of the ground, which makes data migration more difficult. Nevertheless data were migrated using a mean velocity value of 0.09 m/ns, hence introducing a relative, yet controlled, marginal error in the migrated radargrams. The data depicted inFig. 6show three clear horizons (thus four“layers”): • The first layer, above the dashed red line, could be interpreted as the
concrete pavement.
• Immediately below, between the red and the green lines, the radargram shows cross bedding signatures likely to correspond to an-thropicfillings.
• Between the dashed green and blue lines the cross bedding is less vis-ible but still present.
• The dashed blue line must correspond to the phreatic level, as interpreted depths are coherent with local phreatic measurements.
• Below the dashed blue line, the signal is uncharacteristic and depicts visible attenuation. Local geology indicates the presence of clayey layers.
Hence, the area has beenfilled with material and the present pave-ment must be above the levels existing when the building was con-structed, as indicated by the second and third“layers” inFig.6.
The materials between the red and blues dashed lines (Fig. 6), depict a crossbedding deposition pattern that could be interpreted as a unique layer. However, the added green dashed line corresponds to a reflector visible on the radargram (event parallel to the surface with a two way time of 26 ns). Hence two different stages of deposition can also be interpreted.
4.2. Infrastructure location
Infrastructures, power cables, sewage and plumbing are thought to have suffered modifications and their present location was unknown, which represented a considerable problem and risk, as any renovation project depends on the knowledge of these infrastructure locations in order to prevent accidents and decide on their eventual removal.
Thus the groundfloor of the building (Fig. 5, areas A1 and A2) was surveyed with a 800 MHz antenna, using a 0.1 m spacing between lines in orthogonal directions.
The time slice inFig. 7depicts the data from area A1. The yellow lines mark the position of the power cables, later verified by direct inspection, whilst the red line was interpreted as a water pipe, according to its ori-entation towards a groundfloor bathroom.
Similar data were obtained for the other areas of the house, as shown inFig. 8.
On the left ofFig. 8, a red rectangle on the time slice shows a signa-ture that should correspond to a sewage pipe. This interpretation is based on the dimensions and orientation of the anomaly that is in accor-dance with the bathrooms and kitchen locations (groundfloor and first floor).
The top right side ofFig. 8shows a radargram, carried out along the red line (XY) on the layout presented below the radargram. The yellow rectangle shows a clear hyperbola and some ringing of the signal, thus indicating the presence of a structure, probably metallic. This event cor-responds to the red alignment on the time slice, shown on the left of
Fig. 8.
The radargram, top right side ofFig. 8, also depicts two reflectors (marked in dashed red) that correspond to the two bottom layers (green and blue) revealed in the radargrams ofFig. 6. The interpreted interfaces positioning inFig. 6(data acquired with a 500 MHz antenna)
Fig. 4. Radargram showing the hyperbola and ringing effect (red) originated from the metallic rod on the opposite face of a wall. In this case, it was possible to estimate a velocity value of 0.14 m/ns (from hyperbolafitting) and a wall thickness of 0.34 m. Furthermore, the area of interest of the radargram corresponds to two way time values less than 4.945 ns.
Fig. 5. Surveyed areas on the exterior (“E” areas) and on the interior ground floor (“A” areas) of the InovaDomus building.
andFig.8(data acquired with an 800 MHz antenna) is in close agree-ment, as it is proved by the time scale in bothfigures.
Finally, the green line on the radargram ofFig. 8, corresponds to the foundations of a wall.
4.3. Walls structural and material characterization
Since some inner walls are covered with ceramic tiles of architectur-al/heritage value that cannot be destroyed, a GPR survey was also used to investigate the presence or absence of hidden structures within the walls.Fig. 9shows the interior of a wall behind these ceramic tiles. Mea-surements were taken every 0.02 m and data profiles were also 0.02 m apart, with a frequency of 1.6 GHz.
The time slice inFig. 9is an example of this survey and as it can be seen, on the right ofFig. 9, no infrastructures were registered. The time slice clearly shows the bricks, moreover with enough resolution to perform accurate measurements.
There are no depth estimates in the time slice ofFig. 9, as no hy-perbola events were found on the 2D profiles. The composition of the materials is unknown and thus the dielectric constant could not be determined either. It was decided not to use estimate values from other measurements because, in this case, wall materials are different, as it is discussed later in the interpretation of the GPR data.
4.4. Alterations to the initial layout of the house and construction materials Since its construction, the house underwent transformations planned to accommodate new functionalities. Therefore, walls, doors and windows have been altered, removed or constructed. Besides some imprecise oral information, there was no other knowledge of these alterations or their exact location. Furthermore no information about the initial layout of the building was available. However, the cor-rect evaluation of the structural stability and characteristics of the build-ing demanded the knowledge of these features.
Fig. 6. On left: GPR image, on the right: location of the GPR image on the corresponding acquisition area (E1).
Fig. 7. Time Slice 3026 ns (−0,17 m) in area A1 (electrical cabling in dashed yellow; plumbing in dashed red).
Hence, one of the objectives of the survey was to locate removed or altered walls and initial construction elements.
The inner walls were surveyed with a 1.6 GHz antenna, using 0.05 m spacing in a single direction, to identify removed openings or added walls, doors and windows. Whenever necessary, the survey area was covered with 0.02 cm spacing and two perpendicular directions for more detailed results. Data processing was carried out as previously ex-plained, with no additional procedures.
The time slice onFig. 10shows the location of a blocked passage. This time slice (1.038 ns) shows the original adobe bricks to the left of the red line. As a spacing of 0.05 m was used it is not possible to obtain from the data the accurate dimensions of the adobe bricks. Neverthe-less, their signature is clearly distinct from that to the right of the red
line. In this region the signature corresponds to brick units with dimen-sions close to those of modern bricks (0.2 × 0.3 m).
Ancient adobe bricks were made from sandy materials with very low iron content. On the other modern bricks are made from clay with a higher iron content and, furthermore, modern bricks also have voids. These features and differences can contribute to the higher contrast de-livered by the modern construction materials to the right of the red line inFig. 10.
Velocity estimates were determined by hyperbolafitting in 2D radargrams and velocity values of 0.11 m/ns were assigned for the an-cient abode area, and dielectric constant values (ε) of 9.0 were obtained in this region. On the right part of the time slice, velocity estimates for the modern brick area are higher, in the range of 0.15 m/ns to
Fig. 8. GPR time slice 11.63 ns (−0.64 m), GPR image and grid of measurements in Area A2: bottom right, grid GPR measurements grid in Area A2; top right, radargram corresponding to the YX acquisition line; left, 11.63 ns time slice for the whole A2 Area.
0.18 m/s, and the corresponding dielectric constant values range from 4.0 to 2.8. This higher values can be justified as modern bricks are hol-low (airfilled) and, thus, larger average velocities are to be expected.
Data inFig. 11, correspond to a time slice at 1.828 ns in the same wall. This time slice shows data from a deeper section, when compared with
Fig. 10. The features revealed inFig 11also show the difference between old adobe bricks (to the left) and modern bricks (to the right). However, two important regions are now evident, evidenced by the blue and the red rectangles: the blue rectangle corresponds to thefitting of another wall (perpendicular to that being investigated); on the other hand, the red rectangle corresponds to an original column. In its center, the signa-ture of the apex of a hyperbola is clearly displayed. The source of this hy-perbola must be the metal used in the structure of the original building.
Different materials were used to close sections of the walls. Thus,
Fig. 12, shows two time slices from outer walls. Interpretation ofFig. 12
was done in accordance with the previous discussion. Thus on the left ofFig. 12, the wall section shows modern bricks (region between the red lines) whilst, on the right, the previous opening was closed with old adobe bricks (between the red lines). Consequently, the intervention on the left is likely to be more recent than the intervention on the right.
Analysis of 2D radargrams in this case provides hyperbolafitting and a velocity estimate of 0.09 m/ns corresponding to a constant dielectric value of 11.1.
As expected, construction materials have changed through time dur-ing the builddur-ing lifetime and GPR successfully identified primitive adobe bricks and modern bricks.
The GPR signature of modern bricks and primitive adobe bricks is depicted inFigs. 9, 10 and 12, showing significant diversity in the brick dimensions and reflectivity.
Brick dimensions can be estimated directly from time slices inFigs. 9, 10 and 12. Hence, fromFig. 9, brick dimensions are 0.30 × 0.12 m whilst
fromFigs. 10 and 12adobe bricks have approximate dimensions of
0.30 × 0.9 m and modern bricks dimensions are about 0.28 × 0.20 m.
As the used color scale is the same in all thefigures it is clear inFig. 9
that bricks reflectivity shows lighter color, therefore a lower relative re-flectivity, when compared with that of the cement and that the opposite occurs inFigs 10 and 12. Furthermore it is observed that reflectivity varies from brick to brick.
These observations imply that the bricks used in the construction of the walls inFigs. 9, 10 and 12are different, as inferred from their dimensions. Data fromFig. 9corresponds to an inner wall that en-dured high temperatures as it is a wall from afireplace. So, either these bricks originally had a different composition (refractory bricks?) or the heating they have suffered has changed their electro-magnetic properties.
On the other hand, the apparent individual signature of each brick inFigs. 10 and 12has also been previously observed in laboratory ex-periments (Hermozilha et al., 2009). This phenomenon can be ex-plained as adobe bricks are made individually and it is not possible to obtain a set of adobe bricks with exactly the same composition. Consequently, properties are likely to vary from adobe brick to adobe brick. Regarding the behavior of modern bricks, it has also been observed that a set of bricks does not show two identical spec-imens. They vary in color and in texture as production was almost ar-tisanal decades ago.
Another factor that must be considered in the above analysis is the cement composition. The relative reflectivity of the cement and the bricks varies fromFig. 9toFigs 10 and 12. Thus, it is also possible that the cement can be different, in particular the one used in the construc-tion of thefireplace wall (Fig. 9).
Additionally, the variable thickness of the plaster, that is not expect-ed to be uniform, could also contribute to this diverse bricks reflectivity behavior.
The present data do not allow a more definite interpretation and clarification of these subjects and clearly there is more work to be done in these subjects.
Fig. 10. Time slice 1038 ns (−0,06 m) in Area P3. (Two types of masonry separated by the red line; on the right a pillar).
Regarding the rebar structure, it is possible that alterations have oc-curred during building lifetime, when modifications were made and supplements added.
In fact, the 1stfloor corner balcony in the building facade appeared incoherent with the characteristics of the architectural type of the InovaDomus house, repeated in several coeval houses in the region. Such incoherence was indicative of probable alterations to the original plan of the house, thus justifying an effort to understand this part of
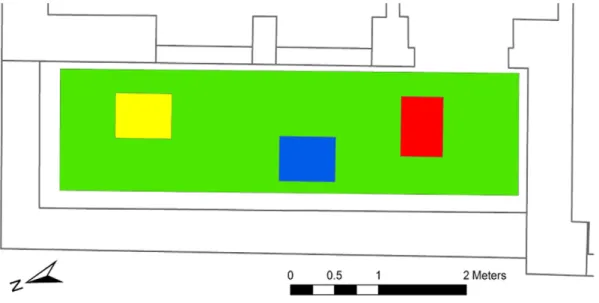
the building's evolution in detail. Several GPR profiles were then ac-quired on this balcony with an 800 MHz antenna, 0.1 m spacing be-tween profiles and 0.02 m tracing increment in two orthogonal profiles (Fig. 14). The top ofFig.13shows two rows of time slices: the top row corresponds to the longitudinal 800 MHz acquisition and the bottom row shows the data from the 800 MHz transversal acquisition with relation to the main direction of the balcony. Velocity estimates were done using the hyperbolafitting ofFig. 3(0.14 m/ns).
• the left area (yellow), clearly reveals a rebar structure of approximate-ly 0.2 × 0.2 m, corresponding to the more recent construction; • the right area (red) seems somewhat blurred, showing a rebar with
approximate spacing of 0.1 m;
• finally, the central area (blue), shows a combination of the other two, which indicates an overlapping during the alteration of the original (partial) balcony.
4.5. Pathologies, moisture and fracturing investigation
During the building lifetime damp and fracturing occurred and pa-thologies emerged. It is particularly important to locate fracturing in as-sociation with wall removal and internal changes of the building, as opposed to fracturing associated with the structure natural settlement. There is intense fracturing derived from successive building modi fica-tions, some having been previously repaired. It was proposed to inves-tigate if GPR could be used to detect open and repaired fractures, as well as to inform on the depth of these fractures.
4.5.1. Moisture detection
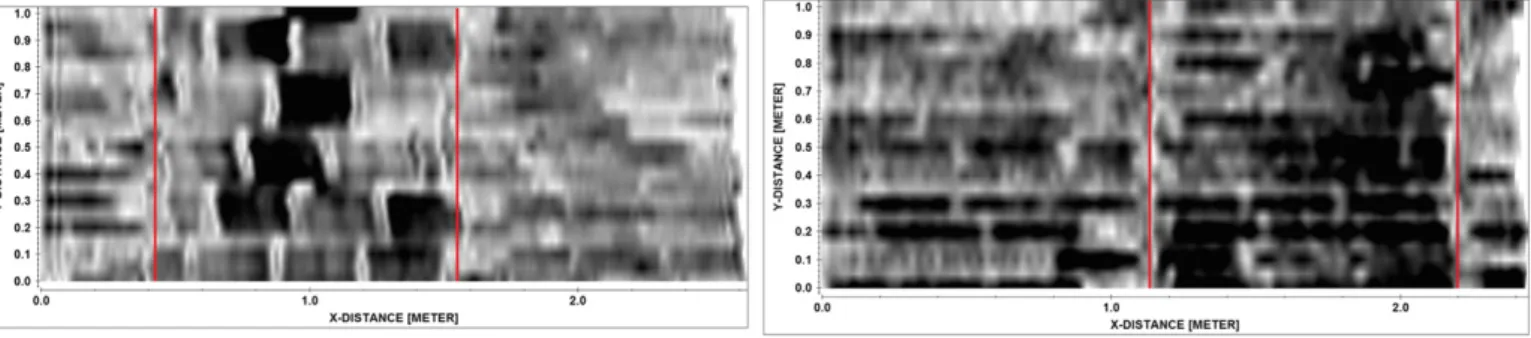
During GPR vertical data acquisition on a wall a darker area, that is more reflective zone, was recorded, as seen on the time slice sequence, left side ofFig. 15: this feature develops inside the wall and seems to oc-cupy larger areas at greater depths, as depicted by the dashed red line. At the time no explanation was available for this signature. However a similar anomaly was later registered on a wall showing a surface damp stain (right side ofFig. 15). On the upper right time slice of
Fig. 15the red dashed line delimits the area where the superficial damp stain was observed. The deeper time slices also shown a widening
antenna. Data were acquired with 0.02 m distance between profiles and 0.002 m spacing between readings (Figs. 16 and 17). The time slices inFig. 16show high reflectivity alignments, marked by the red and blue dashed lines. The signature corresponding to the repaired fracture is not continuous, which must reflect the imperfect and coarse filling as it can be seen locally.
Thus the repairing plaster must have left open voids, evidenced by the highest contrast areas on the picture. This higher contrast is shown by the black, non-continuous anomalies along the dashed blue line. On the other hand, the open fracture shows a continuous higher re-flectivity behavior represented by the dashed red line.
Thesefindings are in agreement with the results obtained in previ-ous model experiments byHermozilha et al. (2009).
5. Conclusions
The experimental work in InovaDomus house proved the suitability and potential of GPR techniques in projects for the rehabilitation of her-itage buildings. GPR techniques are non-destructive, non-invasive and produce a wide range of information crucial (but otherwise unavail-able) to engineers and architects, thus leading to adequate engineering interventions, able to guarantee the building structural integrity and the preservation of architectural features.
As discussed, GPR can be used to investigate local geological condi-tions, map infrastructure networks, locate removed or altered elements, understand modifications and changes in the construction materials and characterize pathologies and fracturing.
The problems encountered and the survey conditions approach a model investigation situation and thus the previous discussion and find-ings, such as antenna choice, data processing particularities, survey de-sign and measurements density network, de-signatures of different
materials, among others, can be extended to other cases and used as a guidance for other works.
However, the complete interpretation of data on different brick types still demands for more experiments with controlled brick walls
(with known geometry and electromagnetic properties). In order to re-spond to this need, a set of laboratory experiments should be planned, aiming to design a procedure able to provide more comprehensive dis-crimination of the material types and physical characteristics.
Fig. 15. Time slices revealing the effect of damp in two different walls: on the left, in a wall showing no surface evidence of the damp infiltration; on the right, in a wall showing superficial damp accumulation. The time slices on the right also reveal the extension of the damp inside the wall (red dashed line). (From top to bottom, time slices of: 0.5929 ns, 0.9387 ns, 1.334 ns, 1.729 ns and 2.125 ns).
Pathology characterization requires further and dedicated research that should include model experiments and extension to other patholo-gies, such as rebar corrosion.
Finally, in spite of the proven advantages of GPR studies, these type of studies can benefit by the systematic combination with other geophysical techniques, such as high-resolution resistivity, high-resolution seismic tomography, ultrasonic surveying, thermal and multispectral imaging, reinforcing the individual merits of each technique and overcoming the limitations of each method.
Acknowledgments
The authors would like to thank the InovaDomus Association and Mr. Luís Café from the Geosciences Department of the University of Aveiro, for their support, and the Portuguese Foundation for Science and Technology for thefinancing throughout the project with reference GeoBioTec PEst-OE/CTE/UI4035/2014.
References
Annan, A.P., Cosway, S.W., 1991.Ground penetrating radar survey design. 53rd Annual Meeting of the European Association Of Exploration Geophysicists, Florence, Italy. Anzani, A., Binda, L., Lualdi, M., Tedeschi, C., Zanzi, L., 2006.Use of sonic and GPR tests to
control the effectiveness of grout injections of stone masonry. ECNDT 2006 (Th.2.4.3). Barraca, N., Almeida, M., Varum, H., Matias, M., 2014. The use of GPR in the rehabilitation of built heritage. Near Surface Geoscience 2014 - 20th European Meeting of Environ-mental and Engineering Geophysics, Athenshttp://dx.doi.org/10.3997/2214–4609. 20141998(5 pp.).
Barrili, V., Pucinotti, R., 2005.Application of radar technology to reinforced concrete struc-tures: a case study. NDT E Int 38, 596–604.
Bavusi, M., Soldovieri, F., Piscitelli, S., Loperte, A., Vallianatos, F., Soupios, P., 2010. Ground-penetrating radar and microwave tomography to evaluate the crack and joint geom-etry in historical buildings: some examples from Chania, Crete, Greece. Near Surf. Geophys. 8 (5), 377–387.
Benedetto, A., Pajewski, L. (Eds.), 2015. Civil Engineering Applications of Ground Pene-trating Radar, Springer Transactions in Civil Engineering and Environment. Springer http://dx.doi.org/10.1007/978-3-319-04813-0(373 pp,ISBN 978-3-319-04812-3). Binda, L., Saisi, A., Tiraboschi, C., 2000.Investigation procedures for the diagnosis of
histor-ic masonries. Constr. Build. Mater. 14, 199–233.
Cataldo, R., Donno, A., Nunzio, G., Leucci, G., Nuzzo, L., Siviero, S., 2005.Integrated methods for analysis of deterioration of cultural heritage: the crypt of cattedrale di otranto. J. Cult. Herit. 6, 29–38.
Fig. 16. Time slices showing the effects of two fractures: on the left the original time slices, on the right the interpretation: red dashed line depicts an open fracture; the blue dashed line depicts a repaired fracture. (Top left: time slice 0.1246 ns (−0.006 m), top right: time slice 0.3738 ns (−0.019 m), bottom left: time slice 0.6230 ns (−0.031 m) and bottom right time slice 1.121 ns (−0.056 m)).
cient wall covered by precious mosaics,. Proceedings of the Near Surface 15th European Meeting of Environmental and Engineering Geophysics, Dublin, Ireland. Fiandaca, G., Martorana, R., Messina, P., Cosentino, P., 2010.The MYG methodology to
carry out 3D electrical resistivity tomography on media covered by vulnerable sur-faces of artistic value. Il Nuovo Cimento B 125 (5–6), 711–718.
Grangeia, C., Matias, M., Figueiredo, F., Hermozilha, H., Carvalho, P., Silva, R., 2011. A multi-method high-resolution geophysical survey in the Machado de Castro Muse-um, central Portugal. J. Geophys. Eng. 8, 351–365. http://dx.doi.org/10.1088/1742-2132/8/2/020.
Hermozilha, H., Grangeia, C., Varum, H., Matias, M., 2009.A High Resolution GPR Experi-ment to Characterize the Internal Structure of a Damaged Adobe Wall, First Break Volume 27, August 2009. pp. 79–84.
Jol, H., 2009.Ground Penetrating Radar Theory and Applications. Elsevier Publications, Amsterdam, The Netherlands (524 pp.).
ian geophysicists. First Break 33, 43–54.
Safont, G., Salazar, A., Rodriguez, A., Vergara, L., 2014. On recovering missing ground pen-etrating radar traces by statistical interpolation methods. Remote Sens. 6, 7546–7565. http://dx.doi.org/10.3390/rs6087546.
Sass, O., Viles, H.A., 2006.How wet are these walls? testing a novel technique for measur-ing moisture in ruined walls. J. Cult. Herit. 7, 257–263.
Sass, O., Viles, H.A., 2010.Wetting and drying of masonry walls: 2-D resistivity monitoring of driving rain experiments on historic stonework in Oxford, UK J. Appl. Geophys. 70, 72–83.
Sandmeier Scientific Software ReflexWin, vs 7.1,http://www.sandmeier-geo.de/reflexw. html(9Feb2015).