UNIVERSIDADE DA BEIRA INTERIOR
Ciências Sociais e Humanas
Energy consumption and investments for
economic growth in Southern Africa Development
Community (SADC)
Cleidy Nádia Abrão Waite
Dissertação para obtenção do Grau de Mestre em
Economia
(2º ciclo de estudos)
Orientador: Prof. Doutor António Manuel Cardoso Marques
iii
Dedication
iv
Acknowledgments
Firstly I would like to thank God, for all the blessings and lessons that lead to accomplish everything I did until this day.
Secondly I thank my parents for the motivation, emotional and financial support they gave me, as without it I would not have get this far. Also to my family for kindness, patience, time and attention that they dedicated to me.
Thirdly I would like to thank my supervisor Doctor Professor António Marques for the guidance, support and encouragement that allowed my work to reach the quality it did and that allowed me to growth in many different ways. I also thank Doutor Professor José Fuinhas, Doutora Professora Ana Paula Gama, Doutor Professor Pedro Guedes de Carvalho, Doutor Professor António Matos, Doutora Professora Zélia Serrasqueiro and Doutor Professor Alcino Couto for the support given throughout the whole master degree experience.
Fourthly I would like to thank all my friends, for the encouragement, unconditional support and advices given to me that gave me strength to carry on and get this far.
Fifthly I would like to thank my classmate for the help and time they dedicated to me.
Sixthly I would like to thank Diogo Pereira for the patience, time, and knowledge transmitted. Last but not least, I would like to thank Southern African Development Community for the information and availability given, there are vital to accomplish this work.
v
Resumo
Este estudo analisa a relação entre o consumo de energia de fontes renováveis e fósseis com o crescimento económico, bem como, a relação do investimento total com o crescimento económico em 10 países da Comunidade de Desenvolvimento da África Austral (SADC). O método autorregressivo (ARDL) foi utilizado para capturar os efeitos de curto e longo prazo e o estimador Driscoll Kraay foi utilizado para obter resultados robustos. Para os restantes testes complementares verifica-se a presença de heterocedasticidade, correlação contemporânea, autocorrelação de primeira ordem e a dependência da seção transversal. O resultado mostra que o consumo de energia de combustíveis fosseis a curto prazo, tem contribuído para o crescimento económico. Enquanto, que o consumo de energia renovável a longo prazo apresenta um resultado negativo no crescimento económico, este efeito pode ser causado pela aplicação de energia de fontes renováveis em atividades não produtivas. O investimento total mostra ser um grande impulsionador no crescimento económico dos países em estudo a curto e a longo prazo. A versão preliminar deste trabalho foi apresentada na 3ª Conferencia anual sobre Energy Transition: European and Global Perspectives, organizada pela Hellenic Association for Energy Economics (HAEE) na Grécia.
Palavras-chave
Investimento total, Crescimento económico, SADC, Consumo de energia renovável, Consumo de energia de combustível fóssil.
vi
Resumo alargado
Com o objetivo de reduzir a pobreza e o desemprego em África, várias são as medidas que devem ser tomadas, sendo uma delas o aumento eficiente do consumo de energia, pois esta impulsiona o crescimento social e económico, melhorando os padrões de vida e a produtividade industrial. Mas o que se verifica é que a maior parte dos países africanos possuem uma grande escassez no acesso à energia e eletricidade comprometendo o crescimento económico. Para acabar com a escassez, seria necessário aumentar a geração de energia, mas para isso deve haver mais investimentos e apoio por parte das entidades públicas e privadas.
Este estudo aborda a relação entre o crescimento económico com o consumo de energia renovável e de combustível fóssil, bem como a relação do crescimento económico com o investimento total para os países membros da Comunidade de Desenvolvimento da África Austral que são: Angola, África do sul, Botswana, Comores, República Democrática do Congo, Lesotho, Maurícias, Madagáscar, Malawi, Moçambique, Namíbia, Swazilândia, Seychelles, Tanzânia, Zâmbia e Zimbabwe. A Comunidade de Desenvolvimento da África Austral foi criada em 1992, é uma organização intergovernamental, que tem como objetivo, promover a cooperação e a integração socioeconómica, bem como a cooperação política e de segurança entre os 16 países da África austral.
O estudo considera uma abordagem de dados em painel, devido a falta de dados, apenas 10 países serão estudados, sendo eles: Angola, Botswana, República Democrática do Congo, Maurícias, Moçambique, Namíbia, África do sul, Tanzânia, Zâmbia e Zimbabwe, num período temporal de 1991 a 2013. O método ARDL é consistente para amostras pequenas, e foi usado para captar os efeitos de curto e longo prazo. Por se tratar de um estudo que engloba um conjunto de países, foi importante testar a dependência da seção transversal para verifica a possibilidade dos países em estudo serem mais sensíveis ao choque. O teste Hausman foi usado para determinar se seria usado o teste de efeitos fixos ou efeitos aleatórios para estimar o modelo final adequado. Para determinar a heterocedasticidade aplicou-se o teste Wald. A seguir foram feitos os testes de especificação, para determinar a correlação contemporânea aplicou-se o teste de Pesaran e para a autocorrelação de primeira ordem o teste Wooldrigde. Por fim o estimador Driscoll Kraay foi utilizado para obter resultados robustos devido à presença de heteroscedasticidade, correlação contemporânea, autocorrelação de primeira ordem e dependência transversal. A variável dependente usada, foi o Produto interno bruto per capita resultante da razão do produto interno bruto e o total da população. Para as variáveis independentes foram usadas: o acesso à eletricidade, o consumo de energia de combustível fóssil, consumo de energia renovável, índice de volume
vii
de exportação e o investimento total resultante da adição de investimento privado e investimento geral do governo.Os resultados mostram que existe uma relação positiva de curto prazo entre consumo de energia de combustíveis fósseis e o crescimento econômico, juntamente com o índice de volume de exportação. E para o longo prazo, o consumo de energia renovável apresenta uma relação negativa, este resultado é contrário ao que se esperava, devido ao facto da maior parte do consumo de energia nesse estudo ser proveniente de fontes hidroelétricas, e essa região tem uma grande reserva de hidrelétricas de baixo custo. O acesso a eletricidade mostra-se eficiente no crescimento económico uma vez que apresenta uma relação positiva. Para o investimento total, há uma relação positiva no crescimento económico para curto e longo prazo.
Com a limitação em obter os dados, os resultados obtidos nesse estudo devem ser olhados com um certo cuidado. É importante que para futuros trabalhos com mais dados seja feita uma análise de forma a transmitir resultados com maior robustez. E que seja realizado outro estudo referente ao crescimento económico, onde possa ser englobado outros indicadores tendo em conta as políticas públicas em relação a produção, distribuição e o consumo de energia. Com base nos resultados recomenda-se que os países em estudo continuem a consumir energia proveniente de fontes de combustíveis fosseis, apesar de esta ter um grande impacto negativo ao ambiente. Para a fase inicial onde a preocupação é reduzir a escassez elétrica e as más condições de vida, esta fonte tem dado um grande contributo no crescimento económico, como foi observado nos resultados. A posterior pode-se optar por um processo gradual de substituição das fontes de combustíveis fosseis para fontes renováveis. Em relação ao consumo de energia renovável, nota-se uma diminuição no crescimento económico e várias razões podem estar por detrás desse resultado, podendo ser a má aplicação da energia renovável, ou seja, ela está sendo aplicada para atividades não produtivas, de igual modo recomenda-se o uso de energia desta fonte, tendo em conta que causa menos danos ao ambiente, e para um desenvolvimento sustentável esta pretende ser uma excelente aliada. Recomenda-se ainda que o governo invista mais no sector energético. Crie políticas flexíveis que incentive cada vez mais a entrada de investimentos privados e a entrada de novas pequenas empresas no mercado.
viii
Abstract
This study analyses the relation between the renewable and fossil energy consume and the economic growth, as well as the relation that the total investment has with the economic growth in 10 countries from the Southern Africa Develop Community (SADC). The autoregressive method (ARDL) was used to capture the effects on a short and long run and the Driscoll Kraay estimator was used to obtain robust results. As for the remaining complementary tests it is verified the presence of heteroscedasticity, contemporaneous correlation, autocorrelation of first order and cross sectional dependence. The result shows that the fossil fuel energy consume on a short run, has been contribution to the economic growth. While the renewable energy consume in a long run presents a negative result in economic growth, this effect can be caused by the application of energy from renewable sources in non-productive activities. The total investment shows that it can be a big boost to economic growth of the countries under this study on a short and long run. The preliminary version of this work was presented in the 3th Annual Conference about Energy Transition: European and Global Perspectives, organized by Hellenic Association for Energy Economics (HAEE) in Greece.
Keywords
Total investment, Economic growth, SADC, Renewable energy consumption, Fossil fuel energy consumption.
ix
Índex
1.
Introduction ... 1
2.
Literature Review ... 3
2.1. Energy consumption nexus economic growth ... 3
2.2.
SADC Overview ... 4
2.3.
Difficulties in accessing electricity and Investments in energy ... 5
Table 1: DBSA and PPU Projects... 6
2.4.
Energy consumption interactions with the environment ... 7
2.5.
Benefits of energy to the population ... 8
Table 2: Benefits of energy ... 8
3.
Data and methodology framework ... 9
3.1. Data ... 9
3.1.1.
Angola ... 10
3.1.2.
Botswana ... 11
3.1.3.
Comoros ... 11
3.1.4.
Democratic Republic of the Congo ... 12
3.1.5.
Lesotho ... 12
3.1.6.
Madagascar ... 12
3.1.7.
Malawi ... 13
3.1.8.
Mauritius ... 13
3.1.9.
Mozambique ... 13
3.1.10.
Namibia ... 14
3.1.11.
Seychelles ... 14
3.1.12.
South Africa ... 15
3.1.13.
Swaziland ... 16
3.1.14.
Tanzania ... 16
3.1.15.
Zambia ... 17
3.1.16.
Zimbabwe ... 17
3.1. Methodology ... 17
4.
Results ... 19
Table 3: Descriptive statistics ... 19
Table 4: Cross-sectional dependence ... 19
Table 5: Correlation Matrix and VIF ... 20
Table 8: Semi elasticities and elasticities ... 22
5.
Discussing of Results and Policy recommendations ... 23
6.
Conclusions ... 26
x
Tables list
Table 1: DBSA and PPU Projects... 6
Table 2: Benefits of energy ... 8
Table 3: Descriptive statistics ... 19
Table 4: Cross-sectional dependence ... 19
Table 5: Correlation Matrix and VIF ... 20
Table 6: Specification test ... 21
xi
List of Abbreviation
ARDL Auto Regressive Distributed Lag
CSD Cross Section Dependence
CIPS Cross Section Augmented
CIA Central Intelligence Agency
DBSA Development Bank of Southern Africa
DRC Democratic Republic of the Congo EDF Companhia Électricité de France GDP Gross Domestic Product
IRENA International Renewable Energy Agency
IMF International Monetary Fund MW Megawatts
PPU Project Preparation Unit
SADC Southern Africa Development Community
SACU Southern Africa Customs Union
SAPP Southern Africa Power Pool
SEC Swaziland Electric Company TL Transmission Line
UN United Nations
USTDA US Trade and Development Agency
VIF Variance Inflation Factor WB World Bank
1
1. Introduction
The concern of investing in energy sector in Africa is not a new topic. According to Africa progress report of 2015, most part of African countries have major deficit in the access to energy and electricity. About 621 million of inhabitants have no access to electricity and 4/5 depends on solid biomass energy (firewood and charcoal), which ends up contaminating the air and causing 600 thousand deaths per year. To respond to these challenges, it will be require to increase 10 times more the energy generation in order to ensure access to electricity to all Africans by 2030 and due such lack of energy, the potential growth of Africa will reduce to around 2% to 4% per year, which causes more unemployment and poverty.
The Development Bank of the Southern Africa (DBSA) since 2013 has been promoting financial and non-financial investments in sectors of social and economic infra-structures to SADC member countries, where 60% of these investments went to energy (Dlamini, 2017). Due to weak access to electric energy that ends up compromising the sustainable development of the community, there is a major concern in reducing these effects through expansion, but they face other types of problems such as lack of funding in this sector and resistance to the entrance of new energy suppliers in the market.
What can be observed in these countries is that energy consumption is divided according to two sources: fossil fuel and renewable sources. In the consumption of energy from fossil fuel sources we have: coal, distillate, nuclear, gas, biomass and oil. And in the consumption of energy from renewable sources we have: hydroelectric, wind, solar and landfill. It is important to highlight that hydroelectric is the most used source in comparison with other energy sources inside the countries under this study.
The main purpose of this study is to understand how investments and energy consumption could influence the sustainable growth in that area. It is important to describe the benefits that energy could bring to the population and what would be its contribution to the community, and understand what other factors influence economic growth. This study contributes to the literature, because it reveals relationships between the total investment with economic growth and the consumption of energy with economic growth for a series of the African countries less explored. Furthermore, it provides a vision on the importance that total investments and the consumption of renewable and fossil fuel energy have in economic growth, in a short and long run.
2
In general run, this study aims to respond to the following questions: What other factors apart from investment and consumption of the fossil fuel and renewable energy might have influenced in some sort the economic growth? What are the major challenges for the energy sector? How the rush to end the lack of energy supply may condition clear energy? Is there a concern on environmental part in energy consumption?Concerning data analysis, the study uses annual data from 1991 to 2013, applying an approach of limit test ARDL by Pesaran and Smith (2001), with other procedures to obtain the results. In general, results show positive effect in the investments over the growth. In relation to the consumption of the fossil fuel and renewable energy, this shows different results, where the fossil fuel energy consumption in a short run boost economic growth, and consumption of the renewable energy in a long run, has no effect on economic growth. To a better understanding, this work is structured as follows: Section 2 contains introductory aspects related to the literature review, followed by the literature review based on previous studies on the relationship of the investments and energy consumption for economic growth. Section 3 presents variables studied, and the methodology used to analyse the data. Section 4 provides the results and estimations obtained in data analysis for the purpose of this study. Then next, section 5 discusses the results and recommends policies. Lastly, section 6 presents general conclusions of the work.
3
2. Literature Review
In the preparation of this work, a desk study was conducted, what contributed to the topic of this study. There was lack of empirical studies that analysed the nexus of energy consumption and investments with economic growth in Southern African countries, creating more interest in the study of this area and for a better understanding of the review.
Having that said, this section is divided in 5 parts: the first part being about the relationship between the energy consumption and the economic growth; the second part give us an overview on SADC and its main goals; the third part is about the difficulties in the access to electricity and about the investments made on energy in SADC members; the forth part talks about the interaction of the energy consumption with the environment; lastly, the fifth part concerns the benefits of energy to the population.
2.1.
Energy consumption nexus economic growth
It can be said that several studies were conducted on the relationship between consumption of the renewable and fossil fuel energy and economic growth. Starting on the year 1996, where Jones and Thompson, studied the importance of electricity in the sustainable development of population, defending that the lack of access to electricity, makes it difficult for the population to be out of terminal cycle of poverty, since energy services like: lighting, water supply, communication and cooling systems are directly linked to human development.
Recently authors like, Naseri et al., (2015), Marques et al., (2016) and Destek et al., (2017) analised the relationship between energy consumption and economic growth, by testing the traditiconal 4 hypothesis, as follows: Growth hypothesis -The increase in energy consumption can lead to an increase in production and economic growth because the consumption encourages the growth. Conservation hypothesis: It explains that even though there is no reduction in energy consumption, it will not affect the production and economic growth. If there is an increase in GDP, there will be also an increase in the energy consumption. The economic growth doesn’t depend fully on energy consumption. Feedback hypothesis: It means that there is the presence of bidirectional of causality between energy consumption and economic growth. Meaning that energy consumption and economic growth interact between each other and complement themselves. Neutrality hypothesis: The energy consumption has less or no effect in production, meaning that energy consumption and economic growth are neutral in relation to one another, where consumption may have minimum impact or any economic growth. There are several studies from the old ones to the more recent ones that address the issue of energy consumption with economic growth, what is observed is the differences in the results.
4
Looking at more recent literature by Saidi at al., (2017), that studied the relationship of energy consumption with economic growth, with the technique of co-intergration in panel of the 53 countries, that covered 11 countries of Africa (Tanzania, South Africa, Mauritius, and Zimbabwe, countries under this study) where bidirectional causality was observed on the short and long run between energy consumption and economic growth, which implies that there is a positive relationship in a long run between economic growth and energy consumption.In his study Marque at al., (2016), shows that the increase in energy consumption is related to economic growth. Where consumption of energy from renewable sources is important for an average development and consumption of non-renewable sources that managed to boost more growth. It was also concluded in this study that other main factors cause economic growth, them being: labour, trade openness, inflation, exploration of the natural resources, investment and energy. These are not the only ones that concluded on that, Schwerhoff and Sy (2017), also affirmed that renewable energy is still a strong ally for Africa’s growth, reducing poverty, because it has more potential to make many sectors competitive, like the case of agriculture, education, health, and also make the countries more independent, not needing to import fuel, as it ensures reliable and sustainable energy. The opposite is verified in another study Marques et al., (2018), where it presents a negative result in economic growth for renewable energy consumption.
2.2. SADC Overview
The Southern Africa Development Community (SADC) is an intergovernmental organization created in 1992 with the aim of reaching the sustainable and equitable economic development, peace, security and growth, besides poverty relief, improvement of the standard and living standard of the southern African population, gives support to the unprivileged throughout regional integration based on democratic principles and equitable and sustainable development throughout productive and efficient systems, deep cooperation and integration (SADC, 2017). The Southern Africa Development Community is constituted by 16 countries, them being: Angola, Botswana, Comoros, Democratic Republic of the Congo, Malawi, Madagascar, Mauritius, Mozambique, Namibia, Lesotho, South Africa, Seychelles, Swaziland1, Tanzania, Zambia and Zimbabwe.
1In 2018 Swaziland change its name to Eswatini. In order not to cause confusion and maintain the study
5
2.3. Difficulties in accessing electricity and
Investments in energy
It is observed that there are some difficulties in Africa in the access to electivity: first is in public services which are the government’s property, that they establish legal protection against any form of perceived competition (Jones and Thompson, 1994); Secondly, the IRENA indicates some challenges such as: Lack of transparency at institutional level, lack of funding, lack of experience in developing projects and lack of relevant information, markets and availability of resources leading to bankable projects; Thirdly, is the lack of funding in energy projects (Oji, Soumonni and Ojah, 2016), where they investigated the ways by which the funding of renewable energy projects could help African countries to develop.
Hence they believe that the lack of access to reliable energy presents a major challenge for economic development of the Southern Africa, excluding South Africa for having a high electrification rate of 85%, in turn. According to IRENA (2016), as a way of meeting some difficulties, apart from facilitating the development and funding of the projects, by offering adequate tools and platforms for all stakeholders (main players of the markets, including governments, developers of the projects and investors). They created strong relationship with the government and international community of the investors as a way of expanding rapidly the investment in renewable energy.
At a global level, there is an unprecedented growth of investment in the renewable energy sector, this growth is important to mobilize rapidly a transition of sustainable energy. IRENA (2016), has been mobilizing several actions of investment sources either private as, or as public capital. In August 1996, this issue has been given more importance at SADC, after signing a protocol that entered into force in April 1998, being the main legal document that tackles the issue of energy development in the region and it provides wide range of legal and political framework for co-operation in the energy sector. The protocol aims to harmonize the regional and national energy politics, strengthen the cooperation in energy development and energy pooling; and guarantee reliable, continuous and sustainable energy service provision efficiently and economically. It also aims to promote the joint human capital development, organizational capacity buildings and the strengthening of the regional cooperation under research, development, adaptation, dissemination and transfer of low-cost energy technologies (Yearbook SADC, 2016 pg21).
A study made by IRENA (2016), defends the importance of the public policy as a form of supporting the electrification programs, especially in rural areas, through well-structured policies that are possible to secure loans, IRENA (2016) complements this idea of the importance of the public policies, by saying that it is possible to mobilize private investment through financial institutions, as the public funds may help to introduce the seed fund in an
6
emerging sector or new technology. Taking the risks of investment which increases the trust of the private investors and reduces funding costs. It’s important to keep in mind that Aguirre and Ibikunle (2014), in his study about factors influencing renewable energy growth, shows another idea saying that certain government-backed energy policies blocks renewable energy's investments. According to Cedrick and Long (2017), due to high initial investment needed for required manufacture technologies and installations while facing budget restrictions. They should be integrated into the private sector that is at a better financial position to fund and carry out such expensive projects through their available capital or innovative technology. Concerning SADC, the Development Bank of Southern Africa mentions that since 2013 the investments in infrastructures in Africa in each sector are distributed in the following way: 60% in energy; 21% to utilities; 11% to transport; 5% to telecoms; 2% to social areas; and 1% to others. The bigger part of the investments going to energy, dividing them in sources. It can be observed that the biggest bet is the renewable sources, as it is distributed in: 51% to solar power; 23% to wind power; 11% to hydropower; 8% to energy (exclude renewable); 5% to diversified renewable energy; 2% to biomass and biofuel facility. The DBSA’s in partnership with the projects preparation unit (PPU) approve and committed that by the 2017, 2018 and 2019 the projects would be close financially. These project will reach an area of more than 800Km's of transmission and generation of 1200MW (Dlamini 2017 pg.7-8). For more details on this projects see table 1.Table 1: DBSA and PPU Projects
Project Name Country DBSA Role Financial close
MoZiSA Regional
Transmission Line Mozambique, Zimbabwe and South Africa
Source e manage funds for advisory services to compile feasibility studies until financial close. August 2018 BoSA Transmission Line Botswana and South Africa
Fund management for the transaction advisory from IIPSA
April 2018
ANNA
Interconnector
Angola and Namibia
Leverage PPDF with IIPSA funding and other co-funding to commence early stage development.
December 2019
2nd
Alaska-Sherwood
Zimbabwe PPU secured gap funds for consultants to produce a bankable feasibility study.
June 2018
2nd DRC – Zambia
Transmission Line
DRC and Zambia
PPU managed the co-funding contribution for the TL construction, on behalf of DFID.
N/A
Luapula – Lelya Hydro Schemes
DRC and Zambia
PPU was instrumental in approving funds for the technical feasibility studies, and catalysing funds from the WB for the ESIA.
December 2019
Mulembo Hydro Power Schemes
Zambia PPU sourced project preparation funding from PPDF and is currently managing the feasibility study. DBSA potential for MLA and debt financing.
December 2018
Muchinga Power
Station Zambia PPFS approved a preparation facility for 300 MW Hydro Power Station on the Lunsemfwa river.
September 2018
Ngonye Falls Hydro
Power Project Zambia PPFS approved a preparation facility for a 40-120 MW hydroelectric Power Project upstream on the Zambesi River
April 2018
Arandis HFO and Tank Farm
Namibia PPU approved a project preparation facility for 120MW HFO power plant. The facility will go towards the completion of the projects bankable feasibility study.
December 2017
7
2.4.
Energy consumption interactions with the
environment
The work of Quaschning (2010), says that the use of energy has always influenced significantly the environment, that is why it becomes difficult to talk about energy without talking about the component of environment, because all generated energy is a result of use and transformation forces that the nature provide. It does not matter the source of energy to be used, it will always harm the environment, either in a form of forestry destruction or through gas emission in atmosphere ending up with climate change.
There is a different idea concerning the relation between the energy sources and its impact to the environment, Destek and PhD (2017) states that the fossil fuel energy consume is the main cause to global warming and climatic changes while the renewable energy consume is essential to the sustainable growth. At the same time electricity has a bad impact on the environment, because of that Cedrick and Long (2017), came up with the conclusion that renewable energy is less polluting. More recent studies made by Oji et al., (2016), describe the access to clean and stable energy as a major challenge for many African developing countries, noticing that these countries, urging to reduce the lack of energy, tend to prefer non-renewable sources. Although some countries opt by non-renewable sources, according (Marques, Fuinhas and Gaspar, 2016) some African governments, regional organizations and donor community, acknowledge that the access to sustainable energy is a prerequisite for African economic development. The energy consumption is not enough to generate economic growth, this consume also has to be sustainable, what can only be possible with renewable sources.
The UN has been supporting through deployment of technologies and services of the renewable energy and energetic efficiency, in order to tackle challenges related to access and energy safety, as well as mitigation and adaptation on climate change, by contributing to global and sustainable social and economic development for the SADC region (Booklet SADC, 2016).
The SADC development agenda has as priority, the provision of reliable and sustainable energy, economic wellbeing and poverty eradication. For the issue of energy provision, this establishes as initiatives: sustainable energy for all, double the global rate of improvement in energy efficiency and double the share of renewable energy in the global mix by 2030, inspired by objectives of sustainable development that comprise 3 goals (clean energy and accessible price, climate action and sustainable communities) and in historical commitment
8
assumed in Paris at COP 212 in 2015, of reducing gas emission with greenhouse effect, to limitglobal warming to not more than 2 degree Celsius or 1.5 degree Celsius in comparison to pre-industrial levels.
2.5. Benefits of energy to the population
Without a doubt, energy consumption and its access brings major contribution to social and economic growth, as it allows improvements in living standards and industrial productivity. Based on (Booklet SADC, 2016), table 2 describes the benefits to different sectors such as: home, work and community.
Table 2: Benefits of energy
Home Work Community
Faster cooking Reduced physical effort Medical procedure at night Less smoke saves lives Faster processing Evening education
More efficient, less wood Cheaper price Light streets: safe communities Study after sunset Greater range of service Cool vaccines, less spoilage Connection and Communication Business after dark Reliable and rapid testing Increased Comfort Trade without traveling Clean, reliable water supply
Leisure and learning Access market information Less time spent, less distance travelled Less food waste Cool and frozen products Sterilized equipment
Better nutrition Fresher for longer Fever infection
Order and accessible records Digitized institutions Source: Booklet SADC (2016)
The benefits of energy mentioned in the table above are a few of many other, the rural areas present more lack when compared to urban areas. A very important aspect mentioned by the (Booklet SADC, 2016), is that energy and food security are vital for a sustainable future in a limited resources context. One of the benefits that is relevant to mention is that energy allows, transport, water treatments and pumping to take place, which allows water to be supplied to the production and processing of agricultural goods. It is also used in tractors, irrigation machines and in transportation of agricultural goods.
2Was the 21st Conference Of the Parties – otherwise known as Paris 2015, an annual UN conference on
the subject of the climate, and climate change where countries will meet to negotiate a new climate change agreement. The meeting is held in Paris.
9
3. Data and methodology framework
This section will be divided in two parts: the first one will be data presentation, classification and sources and the second one will be the methodology tests applied to get the results.
3.1. Data
There are 16 SADC member countries and due to the lack of data, only 10 countries will be analysed in a period of 23 years, from 1991 to 2013, and them being: Angola, Botswana, Democratic Republic of Congo, Mauritius, Mozambique, Namibia, South Africa, Tanzania, Zambia and Zimbabwe. The data analysis was performed using the Software STATA MP 14.0 where data will be transformed into the data panel format that will increase the number of observation by bringing more viability to the study.
There are several studies related to energy consumption with economic growth, but what can be observed is that most of them do not take into consideration the use of some variables that may better explain the relationship among them, according to the reality of countries under the study, apart from that, other variables help to explain the economic growth. For that reason and after several trials done with several variables, the following are the variables used in this study. The source of the variables was the World Bank, for: gross domestic products (constant 2010 U.S dollars); population (number of people); export volume index (index); renewable energy consumption (% of total final energy consumption); fossil fuel energy consumption (% of total) and access to electricity (% of population). The IMF was the data source for general government investment (billions of Constant Dollars 2011) and Private investment (billions of Constant Dollars 2011).
The variable used in the estimated model are as follows: (i) Gross domestic product per capita – the ratio between gross domestic product and total population that is the dependent variable. The GDP is a good index to measure economic growth of a country since it comprises in exposing the amount produced in a certain country in terms of goods and services (Fuinhas et al. 2013). The data of GDP will be analysed in values per capita because this way is possible to eliminate distortions produced by price variation and the distortion produced by population variation, taking into account countries under the study. In several literatures related to this study, the GDP variable per capita is used to create a relation between the economic growth and the energy consumption. And the remaining are independent variables: (ii) Total investment resulting from the sum of general government investment and private investment. For Coelho (2013), what feeds the process of economic production are: the savings and investment, which can be concluded that to encourage economic growth, there are several factors to take into account, and investment well combined is one of them.
10
For this study is relevant because is related to economic growth and is one of the focuses of this study. (iii) Export volume index, are comprised of sales of goods and services produced in a country to abroad. This variable is important because it analyses the progress of products in the external market and to what extent this will influence economic growth. (iv) Access to electricity. Due to weak access of countries under the study on what they present and according to the literature and to the observed data, that variable would help to understand if really the access to electricity implies in certain way the economic growth. This variable integrates the access to electricity of the urban and rural areas. (v) Renewable energy consumption, by the diversity found in several studies on the influence that the consumption of renewable energy may have, it intends to test in emerging economies in which effects this will have in the economic growth. This variable is represented by renewable sources, where for SADC member states most part comes from hydroelectric sources. (vi) Fossil fuel energy consumption is comprised of coal, oil petroleum and natural gas products. The purpose of using this variable is also to test separately its impact on growth. The separation of energy sources is important to test separately the impact of each one of them, as that in terms of consumed quantity they are not in the same level and also in terms of costs.The following will be presented in a general way, all members of SADC, giving an overview that covers: the population, the geographic location, including the economic situation and its situation concerning energy
.
3.1.1. Angola
With the population of more than 29 million inhabitants (2017), Angola is located at the coast of Atlantic ocean, south of West Africa. According to Euronews Journal (2017), 65% of population lives without electricity. The capacity of the installed generation in Angola is mostly from hydroelectric, thermal and gas sources, however, this capacity is not enough to meet the current demand in Angola although it has major potential to be self-sufficient in energy supply based on hydro resources, gas and available oil. To establish the security on demand of electric energy, Angola intends to bet on hydroelectric sources (even with threats of drought) and on gas, also the abandon of diesel. It is relevant to highlight that Angola it is on top 10 of world users of the renewable and lower emissions of CO2. With the establishment of the general law of the electricity of 1996 and the Law 5/02 on delimited areas of the economic activities, the State will have more control in generation, transmission and distribution of the electric energy for public consumption, that means that these activities require concession of the State to be operated by the private entities, apart from its dimension. Although the Angolan legal Framework allows investment attraction from the private sector, the regulation framework will not sustain private investment due to low tariffs, caused by tariffs or concessions of the Government subsidies (Magombo, 2009).
11
Angola is currently interconnecting the internal transmission network from north to central and south and it is expanding to the south part of the country, mainly in cities of Xangongo, Cahama and Ondjiva. Apart from major hydroelectric undertakings with the potential of more than 6.000MW are being planned, with some constructions on their way. Angola currently has a repressed demand with deficit of 300MW that will change when new generation starts operating (SADC 2017 pg 8).3.1.2. Botswana
Located in the Centre of the Southern Africa, with a small population, Botswana counts with population of 2 million inhabitants (2018), it has very limited explored energy resources and currently depends on all oil products and import of electricity from South Africa and Zambia. The available energy resources in Botswana are: coal, solar energy and bioenergy, having an adequate strong potential for installation of solar energy, with more than 3.200 hours of solar light per year, but unfortunately its contribution to the shortage of the national energy is not felt. The fact that Botswana has no resources for the hydroelectric energy, most part of electricity comes from thermal source and coal (generated from Morupule Power Station), with some small diesel generators in rural areas (BITC, 2018). This country has one of the highest tariffs of electric energy in the Southern Africa; the justification of high tariffs is because of relocation of some intensive energy industries in neighbour countries. The electric concessionaire that Botswana Power Corporation has chosen EDF (Companhia Électricité de
France) to put its rural electrification program decentralized, being that EDF has opportunity
to show its capacity in terms of installations that are ecologically responsible and long lasting (Vallon, 2014).
3.1.3. Comoros
For the One World Nation (2018) the archipelago of Comoros, is located in the east of Mozambique, off the east coast of the African continent and west of the northern tip of Madagascar. It is composed by 4 islands, Grande Comoros, Mohéli, Anjouan and Mayotte, with a small population of 808 thousand (2017). In 1975 Comoros gains independence from France, except for the Mayotte Island. In mid-2017, Comoros joined other 15 SADC member states and now is a full member. It is a poor country, but in comparison with some other Sub-Saharan African countries it can be said that Comoros is in a better position. According to the poverty evaluation report about Comoros published by the World Bank in 2018, there have been a 10 per cent reduction on the level of poverty since 2014, which it is more verified in the urban area. According to the Central Intelligence Agency (2018), most part of the installed electricity capacity comes from fossil sources, 96.2%, and the other part comes from hydroelectric sources, 3.8%. By 2015 about 200.000 of population had no access to electricity, in 2016 the elected government advanced with several commitments, one of them was to reduce expenditures and improve the access to electricity.
12
3.1.4. Democratic Republic of the Congo
The Democratic Republic of the Congo is the largest francophone African country and also the most populated Southern Africa country, with many natural resources. It occupies an area of 2, 3 million km², and it has about 77 million inhabitants, 80 million hectares of arable land and more than 1.100 minerals and precious metals. About 80% of the country’s income comes from copper and cobalt exportation. In 2016 a currency depreciation took place and as well as a decrease in the global exportation, that caused damage in the external accounts and a loss of 31% in the exchange rate between the local currency and US dollar (The World Bank, 2017). According the OECD (2014), the CDR’s electricity rate is 9%, in other words, about 60 millions of people do not have access to electricity, even though the country possesses a hydroelectric potential.
3.1.5. Lesotho
Lesotho is one of the smallest country and it is mountainous and landlocked, located in the Southern Africa, and geographically is surrounded by South Africa which shares linguistic and cultural traits. It is comprised of 2 million inhabitants (2018), this country faces major social and economic challenges, hence more than half of the population live under the poverty line and it has the second highest rate of HIV/AIDS prevalence. Due to little arable land, the population becomes vulnerable due to the lack of food, depending on deliveries, agriculture, regional customs revenues and still depending on narrow economy based on textile manufacturing. It imports about 85% of consumption goods from South Africa including most of the agricultural inputs. In terms of education, it is notorious to verify the progress, and it has one of the highest rates of adult education in Africa (CIA, 2018). The installed capacity of hydroelectric plants is in 100%, the government promotes the use of renewable energies, subsidizing 84% of the buying price and installation of USD 1864.37, and the remaining 16% is reimbursed in a period of 7 years (Jadhar et al., 2017). Even though, 1.700.000 of the population still continues without access to electricity.
3.1.6. Madagascar
According to One World Nation (2018), Madagascar is the largest African island, located in the Indian ocean, about 950km east of the coast of Mozambique with the general population of about 22 million (2017). Considered one of poorest country in the world, its economy is sustained by mining, fishing, clothing manufacture and agriculture. With environmental destruction, the agricultural activity has been compromised, (Wildmadagascar, 2017). According to euronews (2017) the equipment used on energy supply are outdated and the country has many illegal connections, causing many shutdowns and cuts in the energy supply. Aiming to respond to the increasing demand and to produce low-cost electricity, in 2017 a business plan was developed to solve this problem and make the quality network stable.
13
3.1.7. Malawi
According to the SADC website, Malawi is a landlocked country, located in the centre of Africa, on the north and northeast it is border by Tanzania, on the east, south, and southwest is border by Mozambique and on west by Zambia, it occupies an area of 118,484 km². It has about 14 million habitants. It also has the third largest lake in Africa with a 568km extension. The Malawian economy is supported by the agriculture (Tabaco, tea and sugar), contributing to more than a third of the GDP, generating more than 90% of the total exportation income. Another big bid is the tourism sector, which is seen as growing sector and economic diversification to increase foreign exchange earnings. Malawi has been through some restrictions in the energy supply. In the cooperation scope between SADC countries in a protocol implementation, Mozambique that has been sharing energy with South Africa, starts sharing energy with Malawi as well, as the Malawi no Shire hydroelectric station has outdated equipment, making the energy supply irregular (Ngozo, 2012).
3.1.8. Mauritius
Mauritius is an island in the Indian Ocean, located off the eastern coast of Africa. Mauritius lies about 500 miles (800 km) east of Madagascar in the Indian Ocean, it has about 1 million inhabitants (2017). The economy is based on manufacture exportation, agriculture, tourism and financial services. A few years ago the economy was completely dependent on the sugar production. Thanks to Government’s effort the economy is now more diverse. With this diversification, the dependency on the agricultural sector decreases, although it still is quite important, as about a sixth of the income comes from the agricultural exportation (Bowman, 2018). The country’s revision report number 13 issued on July 2010, states that most part of the energy consumed in this country is imported. Until 2016 about 100% of the population had access to electricity, where, 66.3% of the electricity comes from fossil fuel sources, 29, 4% comes from other renewable sources and 5.8% comes from hydroelectric (CIA, 2018).
3.1.9. Mozambique
Mozambique is located in the Southeast of Africa, surrounded by Indian Ocean, between South Africa and Tanzania, with about 30 million inhabitants (2018). Mozambique is a poor country and with high rate of poverty and is affected by natural disasters, diseases, high population growth, low agricultural productivity, unequal wealth distribution, emigration in large scale, economic dependence and political conflicts.
In the previous decade of 2015 Mozambique has grown considerably, to an annual average rate of 6 to 8%, but in 2016 some information, reveals that Mozambican Government was responsible for more than 2 billion U$ in loans secured by the government, made by state companies of defence and security without parliament approval or inclusion in the national
14
budget, what led IMF and international donors to withdraw the budget support, creating high currency depreciation, slowing down the growth in the recent years.Mozambique has a vast potential to energy production in the north of the country, producing more than the country itself could use. And this potential is more in hydroelectric sources of about 85.6% and 14% for fossil fuel and 0.5% for other renewable sources. The region as a whole, lacks adequate offer and estimations indicate that the high and growing demand, and it’s about 15.700.000 people have no access to electricity. (CIA, 2018)
Despite, the current infrastructure of energy transmission, Mozambique is far to be sufficient to transport major quantities of energy that could be generated by projects in the north to the market of south and of the region. Alternatives routes to the market of the region are being explored, for example, through Zimbabwe. (SADC 2017 pg25).
3.1.10. Namibia
Namibia is located in the Southern Africa, border by Atlantic Ocean south, and located between Angola and South Africa, with about 2 million inhabitants (2018). The Namibian economy is fully connected to South Africa and is highly dependent on extraction and mineral processing for exportation. One of the major world producer of uranium, the Namibian economy still continues to be vulnerable to world price fluctuation of the commodities making it volatile to SACU annul quotas (Southern Africa Customs Union) in Namibia and global prices of minerals that complicate budget planning. Another issue that makes the economy of this country vulnerable is drought, so in drought years, they normally import about 50% of their cereal needs (CIA, 2018).
The installed capacity is divided in 64.6% for hydroelectric power, 30.1% for fossil and 5.9% for other renewable sources, where only 32% of the population have access to electricity. Namibia imports the rest of the energy from Southern African Power Pool (Jadhar 2017).
3.1.11. Seychelles
Seychelles is an archipelago in the Indian Ocean, situated at northeast of Madagascar, with a well reduced population of about 98 thousand inhabitants (2018).
The sustainable investment of this country comes from services of social welfare, such as free basic health care and education up to secondary level, what make the country reach high rate in human development index, being among the highest of Africa.
15
It has the highest income among other African countries, in spite that, it has very unequal income. The economic growth is estimated in 55% of the GDP from tourism sector and tuna fishing. In recent years the Government has encouraged foreign investment, in order to improve hotels and other services, to promote agriculture development, fishing and manufacturing in a small scale and make the country less dependent on tourism.In recent years, Seychelles acquired the status of the developed country, due to strong touristic sector and to the low prices of the commodities. It is also noticed that the lack of access to electricity presents a high reduction rate, of about 2.795 people without access to electricity, meaning that 97% have access to electricity and the sources of the installed capacity are 92% for fossil and 9.2% for other renewable sources (CIA, 2018). Being aware of that they need to improve the energy security, the government has intensified efforts to reduce the dependency on fossil fuel and encourage the use of renewable energy through incentives, such as financial rebate scheme, subsidies (Seychelles News Agency, 2017).
3.1.12. South Africa
Officially the Republic of South Africa, it occupies the southern tip of Africa, stretching from north to south for about 1,600 km and from east to west for about 1,600 km. South Africa has a coastline with the Atlantic Ocean to the west and no the east with the Indian Ocean. It has common borders with the republics of Zimbabwe, Mozambique, Namibia, Botswana, and the kingdoms of Lesotho and Swaziland. (Geography of South Africa, 2005).
According to the Focus Economics website although South Africa had hopes of recover their economy with the ascension of Cyril Ramaphosa to the country’s presidency in February of 2018, the weak performance of the mining and manufacturing sector in March of 2018 have frustrated the expectation of strong growth in the first quarter. Despite that, full-year prospects appear relatively bright as other sectors of the economy have shown initial of an upturn, since Ramaphosa took place, with the hopes of business-friendly policies and a crackdown on corruption. Upbeat PMI reading through April suggest that the private sector keeps on posting gains and hiring workers despite a VAT hike and ongoing labour strikes. According to the energy advocacy issued on May 2015, the country’s energy situation starts receiving the Government’s highest priority and at an attempt to minimise the disruptions in the energy supply, the government has been doing everything possible.
Central Intelligence Agency (2018), says that, the supply of instable electricity is one of the factors that also delays the country’s development. ESKOM, an energy state company is constructing three new plants and installing new programs of the energy demand management to improve reliability of the electricity network in order to meet the needs of the minority, estimated in 7.700.000 inhabitants that have no access to electricity, but this
16
company has been accused of mismanagement and corruption and it faces a debt that is becoming bigger. Another factor that limits the growth is the fact that the country faces structural restrictions such as lack of competencies, global competitiveness in declining and frequent shutdowns due to the strike. The government ends up facing major pressures of the urban groups to improve basic service provision, for low income areas, to increase employments and reduction of fees at universities. South Africa has a much diversified energy system; most part is comprised of fossil sources 86.7%, followed by other renewable sources 7.1%, nuclear with 3.9% and hydroelectric with 1.4%. All these factors of the economy instability; end up creating concern to international investors.3.1.13. Swaziland
According to the Monthly Newsletter of SADC Secretariat issued on May 2018, the Kingdom of Swaziland changed the name to the Kingdom of Eswatini, during the double celebration of the 50th birthday of His Majesty, king Mswati III and 50th Independence Anniversary of the
Kingdom, on the 19th of April 2018. The Kingdom of Swaziland is a small landlocked country,
located in the southern part of Africa bordered by the Republic of Mozambique to the east and the rest by the Republic of South Africa. Covers a total area of 17,364 km² with 1 million inhabitants (2017). Currently, Swaziland Electricity Company (SEC) import 80% of its total energy consumption from SADC region through Southern Africa Power Pool (SAPP). Only 20% are internally generated in hydroelectric plants. The total installed capacity of the internal energy production is 60MW. The current maximum demand for the country is 230MW leaving 900.000 people without electricity. The main objective is the development of several solar photovoltaic plants located in the east and in the north east of the country to improve the quality of supply in those areas. This will increase the generation capacity installed in the country in 95%, reducing significantly on dependency of the imported energy from outside the country (SADC 2017 pg31).
3.1.14. Tanzania
Tanzania is located on the east of Africa. It has the Africa’s tallest mountain, the Kilimanjaro Mountain, covered in snow. The total population is of about 58 million. The backbone of the Tanzanian economy is the agriculture that represents 46% of Gross Domestic Product, its main crops that bring income are: cotton lint, cashew nut, Tabaco, coffee and tea. Tanzania has many mineral deposits (gold, diamond, rubies, tin, copper, nickel, lead cobalt, limestone, titanium, vanadium, uranium, phosphate and gypsum), as well as coal and natural gas deposits (SADC, 2012). Concerning energy, according to CIA (2018) data, 24% of the population have access to electricity. Its main installed capacity are hydroelectric (47%) and fossil fuel (46%).
17
3.1.15. Zambia
Officially the Republic of Zambia is located in a landlocked country, is in centre of Southern Africa, with about 15, 9 million inhabitant (One World Nations Online, 2018). According to the World Bank (2017), in 2017 the Zambian economy keeps on recovering. It is predicted an increase of the economy of 4.5% for 2018 and 4.7% for 2019, the kwacha3 stability allowed the
Central Bank to release the monetary policy. Improvements are being made in the agricultural sector, it can be verified an increase in the agricultural production, mainly in corn, what ends up reducing the vulnerability associated to the high dependency on dry farming. Concerning energy, Zambia has been evolving to a technology level in this field. The Trade and Development Agency (USTDA) approved a subsidy to support the viability study to the country’s first Aeolic energy central. (Caterpillar, 2017).
3.1.16. Zimbabwe
Zimbabwe is located between South Africa and Zambia, it has about 16 million inhabitants (2018). The economy of Zimbabwe strongly depends on its mining sectors and agriculture. From 2010 to 2013 recorded a real growth of more than 10% per year, but it suffered a drop in 2014 to 2017 due to weak harvest, low revenue of the diamonds and reduction of investments.
The World Bank and African Development Bank (SADC 2017 pg.31), want Zimbabwe to implement fiscal and significant structural reforms before they can grant them new loans, not only the foreign and domestic investment continues to be hindered by the lack of land tenure and titling, but the inability to repatriated dividends to investors overseas, and the lack of clarity regarding the government's Indigenization and Economic Empowerment Act. (CIA, 2018). About 40% of population in Zimbabwe has access to electricity, being that, 30% of the consumed energy is imported from Mozambique, South Africa, DRC and other neighbouring counties of the region. Its installed capacity for fossil sources are 58%, for hydroelectric 37.1% and 5% for other renewable sources, in the rural area 80 to 90% of people depend on firewood.
3.1. Methodology
When we intend to analyse the data in panels, it is important to choose adequate technique namely attending to the characteristics of the data. For this study, it is intended to analyse the relationship of causality between energy consumption, investment and the Gross Domestic Product per capita relationship with other chosen variables.
18
The ARDL (Autoregressive Distributed Lag) Approach was used to capture the short and long run effects, introduced by Pesaran and Smith (2001), in order to incorporate I (0) and I (1) variables in same estimation. This approach is consistent with small samples and they may deal with endogeneity potential between variables and structure breakdown that could have happened in series. But before that, it is important to test the possibility of having crosssection dependence (CSD), in countries under this study, them belonging to the community,
whether there is more possibility of having more financial integration, or a possibility of one country being more sensible to the shock of one another. The Hausman test was conducted to determine which model should be used. Afterwards the additional tests was applied, in which it was verified the existence of contemporaneous correlation, heteroscedasticity and first order autocorrelation. After gaining the results, the estimator Driscoll Kraay was used to obtain robust results.
19
4.
Results
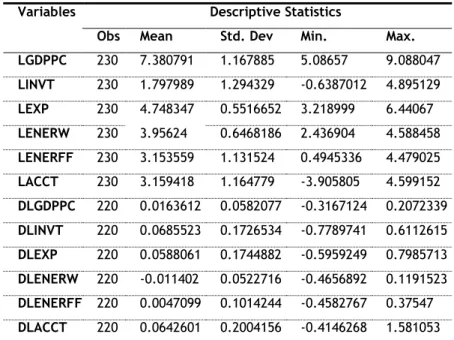
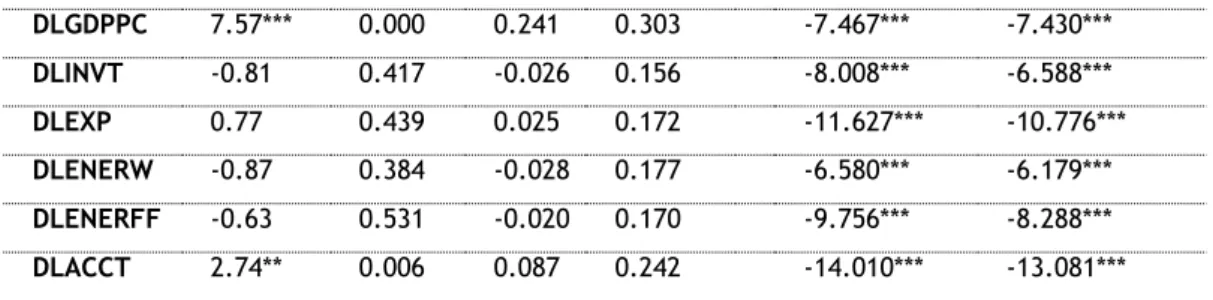
Table 3, shows the descriptive statistics and table 4 the CSD test. What is observed is Cross section dependence, which could be consequence of the similar characteristics of the countries under study. After observing the existence of CSD, second generation unit root test was done, (CIPS – Cross section augmented) by Pesaran (2007), to verify the order of variables integration. It is a test for panel with fixed effects that allow heterogeneity in the parameters and serial correlation of the cross-sectional units, besides correcting dependency between them and being applied for unbalanced panels. The CIPS test for most level variables rejects H0 which implies that there is no unit root and for variable in the first differences the null hypothesis is accepted, which means that series are I(1). It can be said that there is a presence of I (0) and I (1), which implies that the presence of borderline variables are accepted for the ARDL model.
Table 3: Descriptive statistics
Variables Descriptive Statistics
Obs Mean Std. Dev Min. Max. LGDPPC 230 7.380791 1.167885 5.08657 9.088047 LINVT 230 1.797989 1.294329 -0.6387012 4.895129 LEXP 230 4.748347 0.5516652 3.218999 6.44067 LENERW 230 3.95624 0.6468186 2.436904 4.588458 LENERFF 230 3.153559 1.131524 0.4945336 4.479025 LACCT 230 3.159418 1.164779 -3.905805 4.599152 DLGDPPC 220 0.0163612 0.0582077 -0.3167124 0.2072339 DLINVT 220 0.0685523 0.1726534 -0.7789741 0.6112615 DLEXP 220 0.0588061 0.1744882 -0.5959249 0.7985713 DLENERW 220 -0.011402 0.0522716 -0.4656892 0.1191523 DLENERFF 220 0.0047099 0.1014244 -0.4582767 0.37547 DLACCT 220 0.0642601 0.2004156 -0.4146268 1.581053 Note: The prefix’s “L” and “D” means natural logarithm and first differences respectively.
Table 4: Cross-sectional dependence
Variables Cross-sectional dependence (CSD) 2nd generation panel unit root
test CIPS CD-test P-Value Corr. Abs(corr) No trend Trend LGDPPC 12.31*** 0.000 0.383 0.789 1.406 2.542 LINVT 20.14*** 0.000 0.626 0.750 -0.732 -1.021 LEXP 24.37*** 0.000 0.757 0.757 -4.767*** -4.858*** LENERW 5.65*** 0.000 0.176 0.610 0.762 3.371 LENERFF 2.13** 0.033 0.066 0.575 0.861 -0.945 LACCT 15.02*** 0.000 0.467 0.809 -3.725*** -6.753***
20
For assess the eventual presence of collinearity between variables, the VIF (Variance inflation factor) was calculated; The results in table 5, show absence of collinearity due to its low values being 3.11 for the mean of the variables in level and 1.05 for variable in the first differences. In addition to correlations, although these present some high correlations, they are not reasons of concern.Table 5: Correlation Matrix and VIF
Lgdppc Linvt Lexp Lenerw Lenerff Lacct
Lgdppc 1.0000 Linvt 0.4397 1.0000 Lexp -0.0298 0.2324 1.0000 Lenerw -0.8845 -0.3601 0.0486 1.0000 Lenerff 0.9350 0.3247 -0.1875 -0.8511 1.0000 Lacct 0.7838 0.4541 0.2058 -0.6725 0.7361 1.0000 VIF 1.32 1.50 3.85 5.76 3.12 Mean VIF 3.11
Dlgdppc Dlinvt Dlexp Dlenerw Dlenerff Dlacct Dlgdppc 1.0000 Dlinvt 0.1801 1.0000 Dlexp 0.2405 0.0322 1.0000 Dlenerw -0.0854 -0.0711 0.0789 1.0000 Dlenerff 0.2460 -0.0585 0.0580 -0.2932 1.0000 Dlacct -0.1237 0.0066 -0.0371 0.0203 0.0435 1.0000 VIF 1.01 1.02 1.12 1.11 1.01 Mean VIF 1.05
Hausman test was designed to understand what type of model, from fixed effect (FE) or random effects (RE), could be the best option to estimate final model. The Hausman test was performed, where the null hypothesis is rejected (X²= 49.43) at a significance level of 1%, which implies that fixed effect (FE) model is the appropriate one. Due to the presence of fixed effects, in order to select the robust estimator, additional specification test were made them being: presence of heteroscedasticity, autocorrelation of the first order,
DLGDPPC 7.57*** 0.000 0.241 0.303 -7.467*** -7.430*** DLINVT -0.81 0.417 -0.026 0.156 -8.008*** -6.588*** DLEXP 0.77 0.439 0.025 0.172 -11.627*** -10.776*** DLENERW -0.87 0.384 -0.028 0.177 -6.580*** -6.179*** DLENERFF -0.63 0.531 -0.020 0.170 -9.756*** -8.288*** DLACCT 2.74** 0.006 0.087 0.242 -14.010*** -13.081***
21
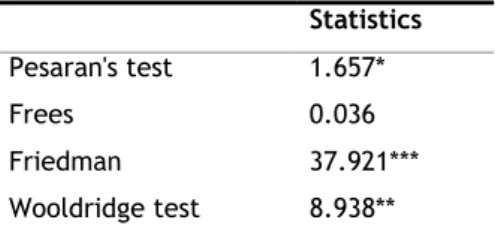
contemporaneous correlation and cross sectional dependence. To check heteroscedasticity the Modified Wald test was performed. Followed by, Wooldridge test, that was used to verify the existence of first order autocorrelation. The Pesaran test was performed to appraise contemporaneous correlation. Frees and Friedman test are used to analyse the presence or non-presence of cross sectional dependence, this test is ideal for studies with fixed effects. To verify the presence of heteroscedasticity the Wald test was conducted, and the result shows the existence of heterocedasticity because the null hypothesis is rejected at a significance level of 1%.The specification tests results are showed in table 6. The Wooldridge test reveals autocorrelation of the first order in panel data, existence of contemporaneous correlation was confirmed by Pesaran test. Friedman test there is cross sectional dependence, because the null hypothesis of the test is rejected, and for Frees test the null hypothesis H0 is accepted, which implies that there is sectional dependence. Afterwards the Driscoll Kraay estimator was used, as it can be observe in table 7.
Table 6: Specification test
Statistics
Pesaran's test 1.657* Frees 0.036 Friedman 37.921*** Wooldridge test 8.938**
Notes: *** denotes significance at 1% to 10%; the results of the Modified Wald test, Wooldridge test and Pesaran test, are based on Chi-squared distribution, F distribution and standard normal distribution, respectively. The null hypothesis of the modified Wald test. Wooldridge test is autocorrelation of the first order and Pesaran test the existence of contemporaneous correlation.
22
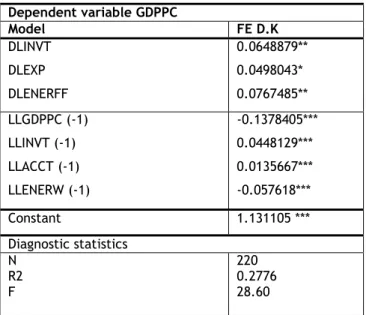
Table 7: Estimation result
Dependent variable GDPPC Model FE D.K DLINVT DLEXP DLENERFF 0.0648879** 0.0498043* 0.0767485** LLGDPPC (-1) LLINVT (-1) LLACCT (-1) LLENERW (-1) -0.1378405*** 0.0448129*** 0.0135667*** -0.057618*** Constant 1.131105 *** Diagnostic statistics N R2 F 220 0.2776 28.60
Table 8: Semi elasticities and elasticities
Dependent variable GDPPC Model D.K Semi-elasticities Constant 1.131105*** DLINVT 0.0648879** DLEXP 0.0498043* DLENERFF 0.0767485** Elasticities LLINVT (-1) 0.3251072*** LLACCT (-1) 0.0984233*** LLENERW (-1) -0.4180046*** ECM -0.1378405*** Notes: ***, ** and * represent a significance level of 1% to 10%, respectively
In order to evaluate the magnitude of the effects, semi elasticities and elasticities were verified. The results presented at table 8 show a positive effect on fossil fuel energy consumption, as well as Export volume index for economic growth on a short run. The results also reveal that the total investment has a positive effect in both short and long term in economic growth. Regarding the Access to electricity variable, it has a positive effect on economic growth on the long run. A different scenario is observed for renewable energy consumption. Indeed, the results suggest that an increase of 1% (one per cent) decreases economic growth by -0.4180046%. This result turns out to be surprising, as for the renewable energy consumption where the biggest sources are the hydroelectric, which are known to be low-cost sources, were the majority.